Multi-layer AI agents analysing 153+ stocks daily — no human bias, no emotion, just data. Updated every trading day at 6 PM ET.
FolioCharts uses a multi-layer AI agent system to produce consistent, unbiased technical analysis for every ticker, every day. Each chart is analysed independently with zero lookahead bias — no anchoring, no confirmation bias, no fatigue.
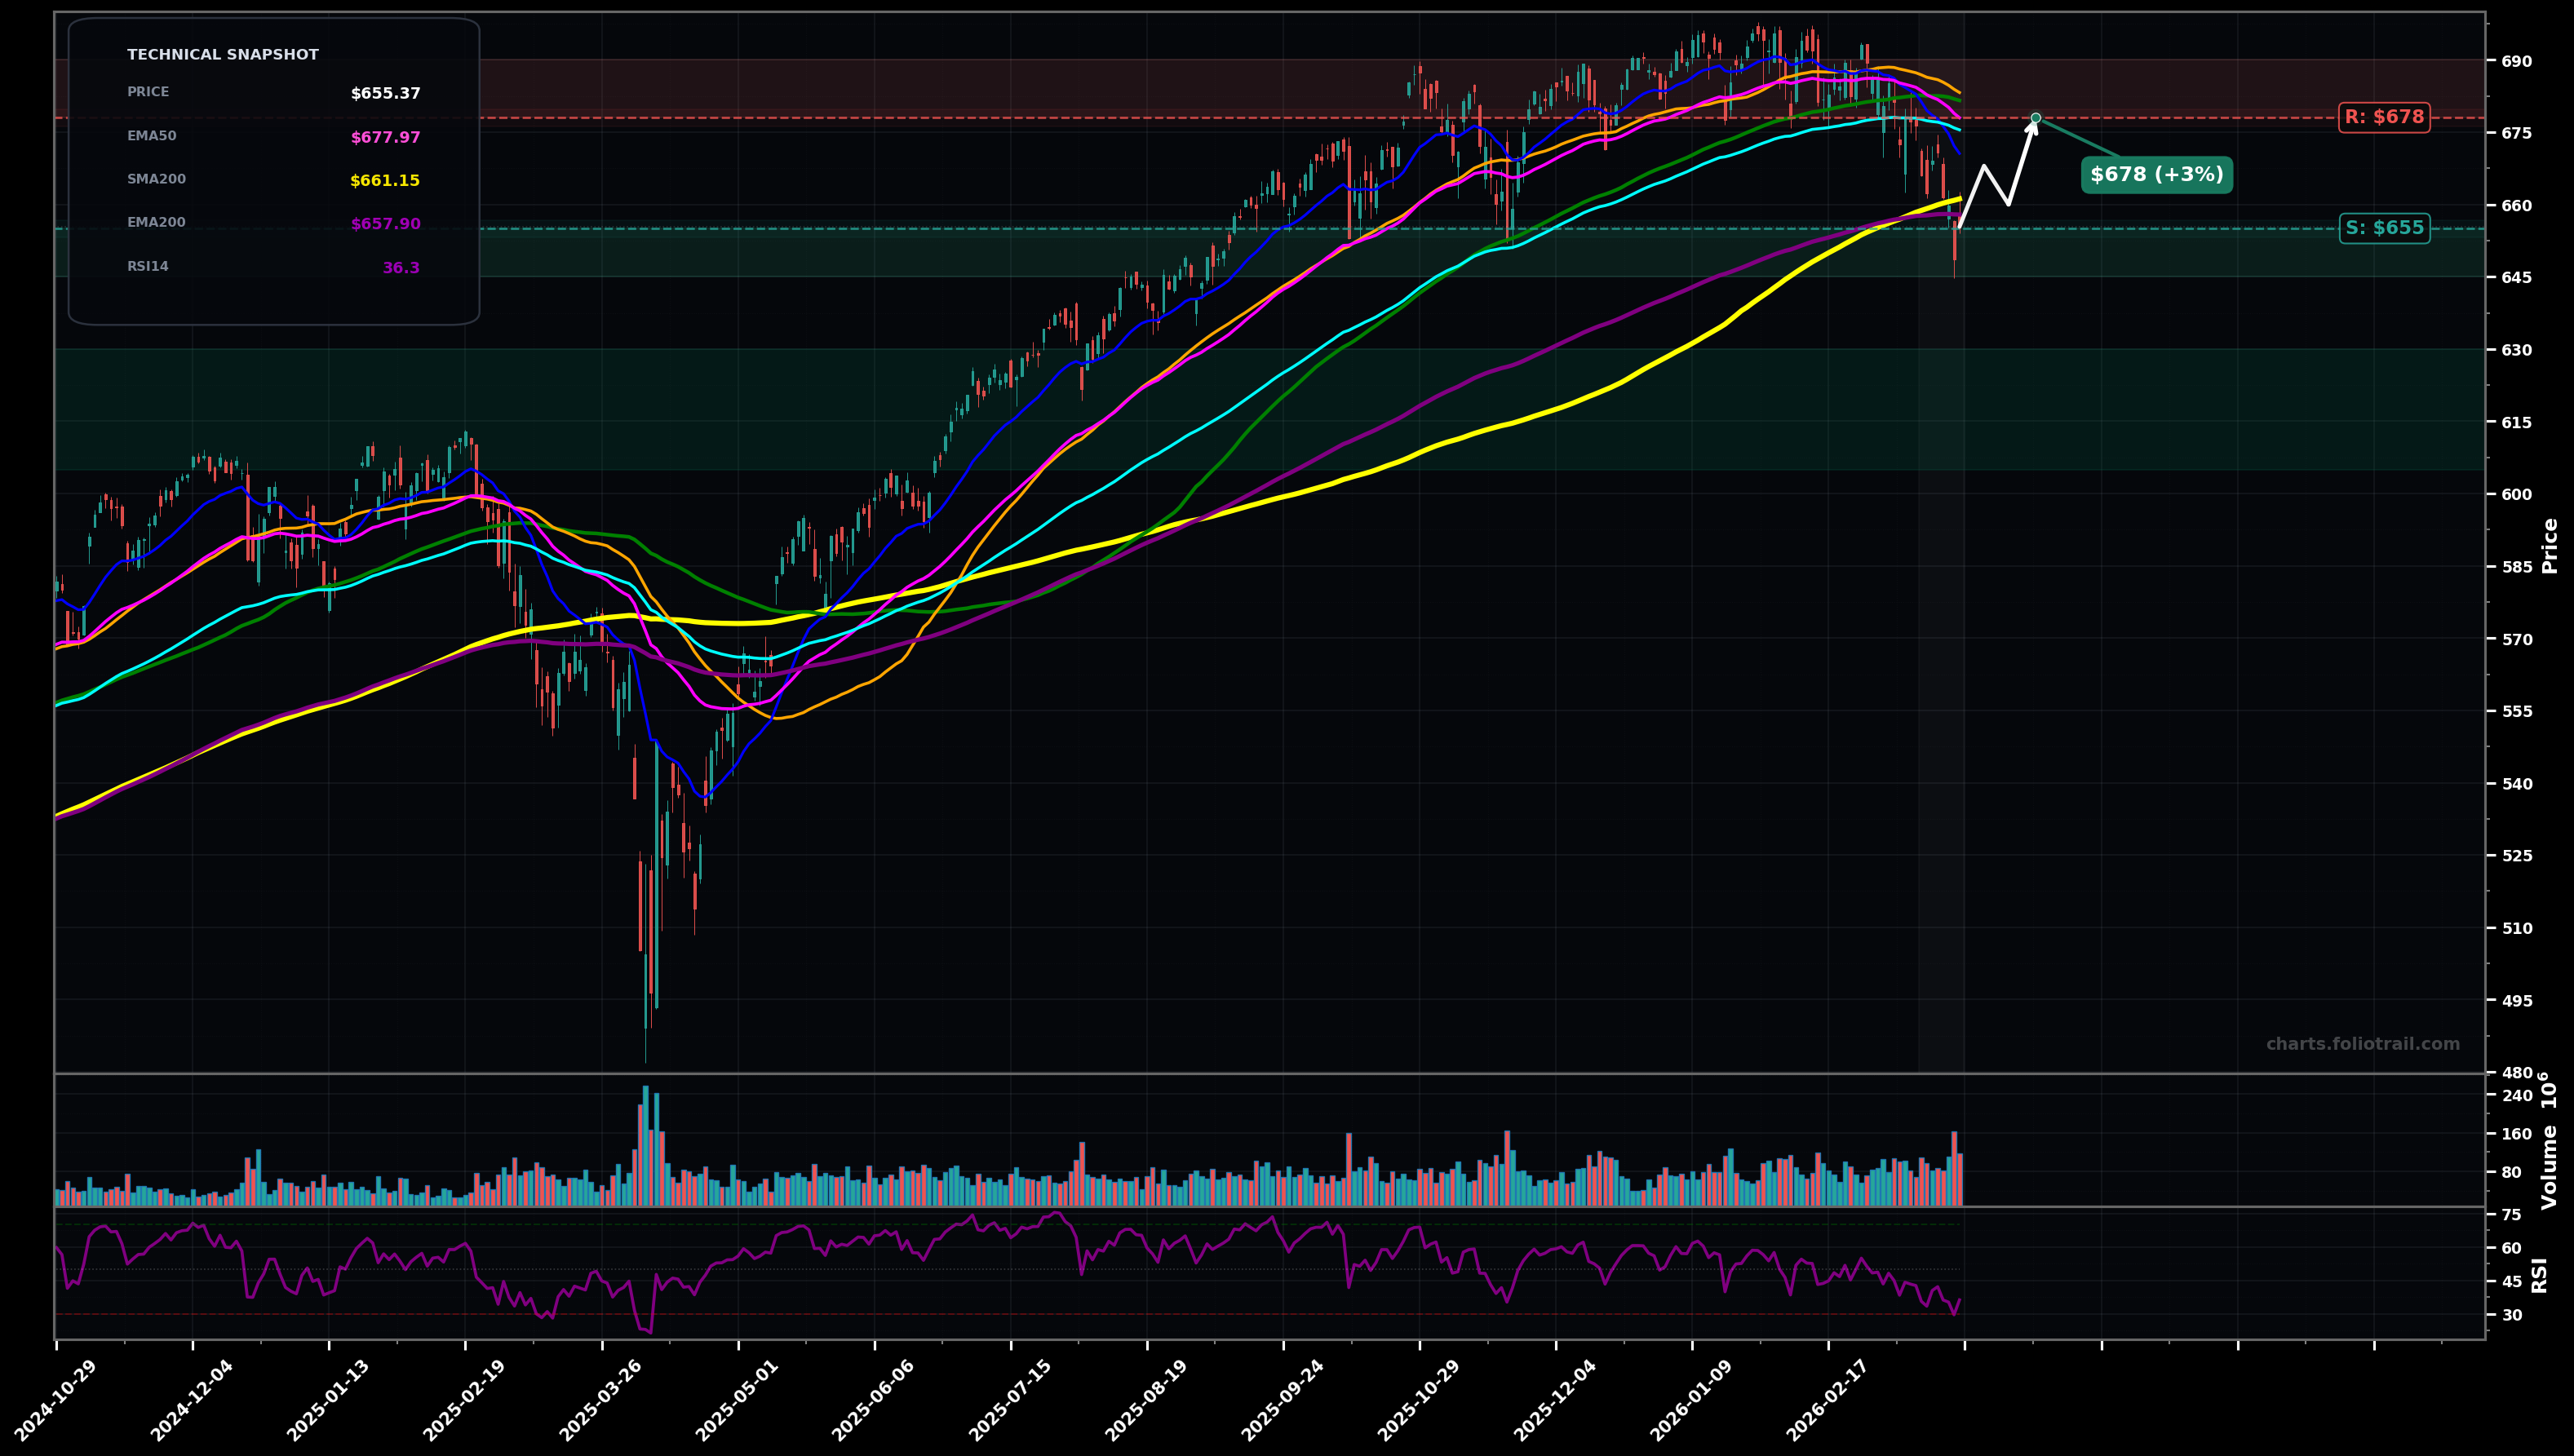
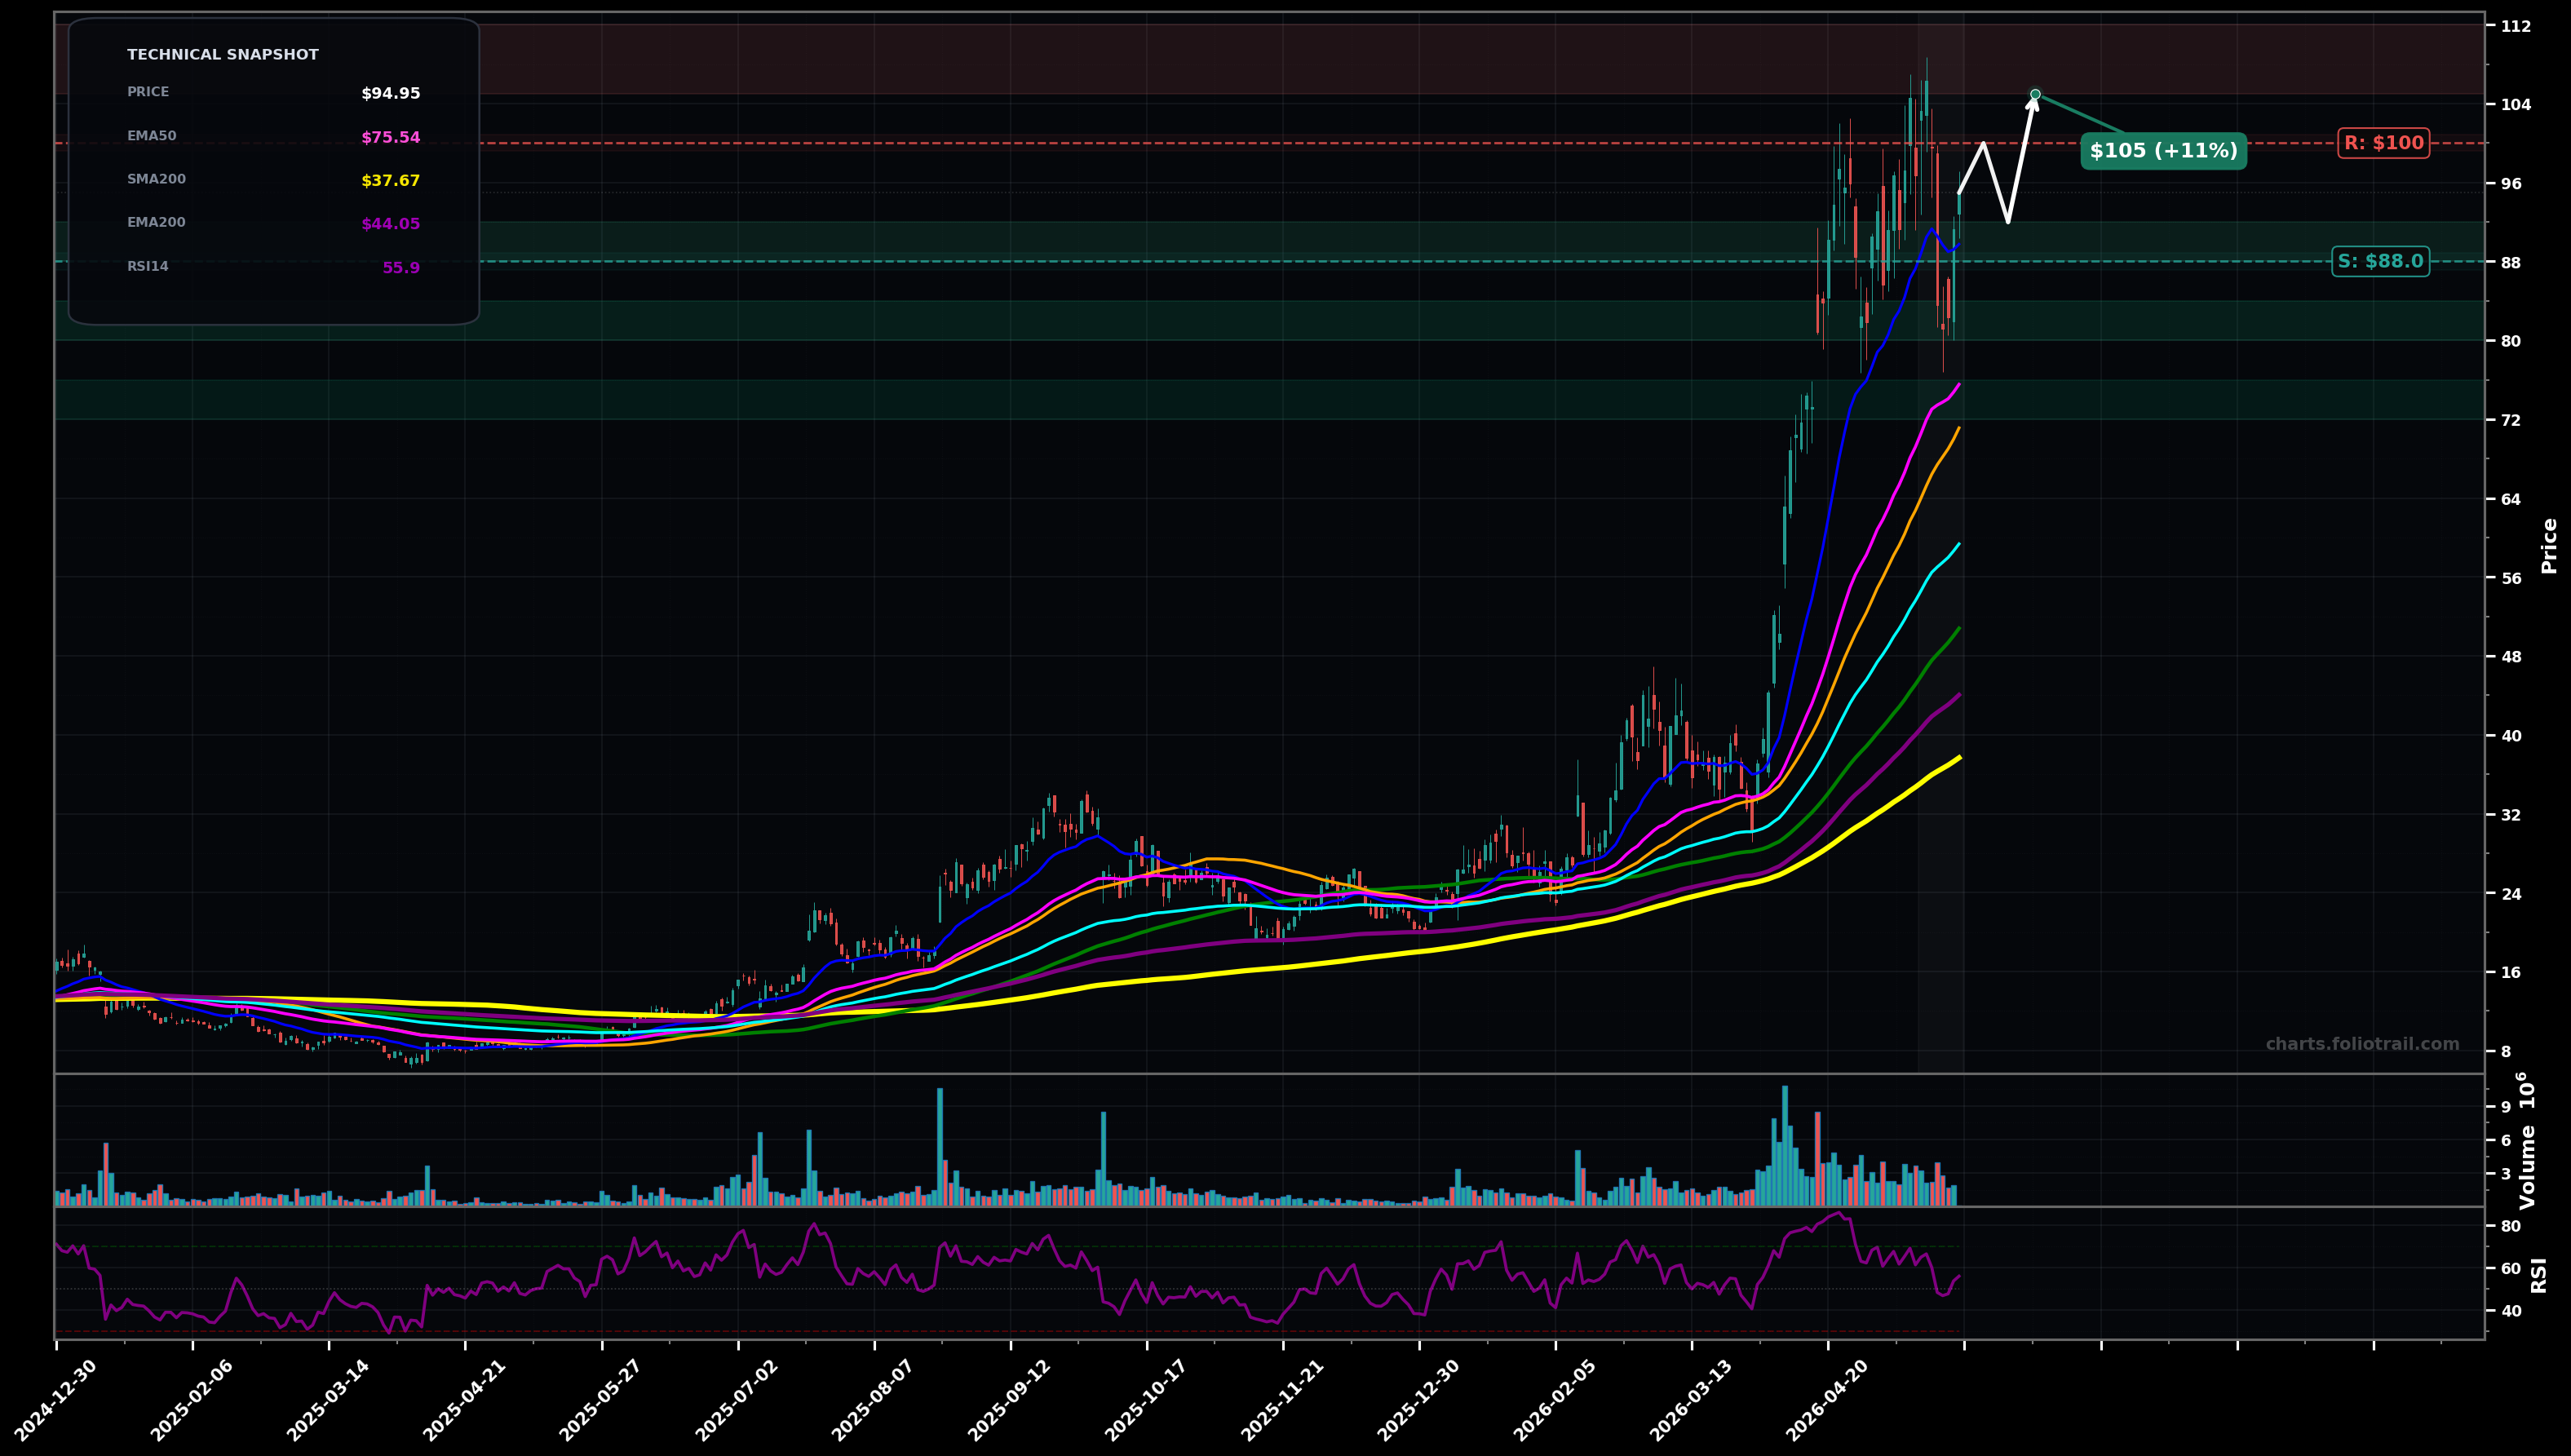
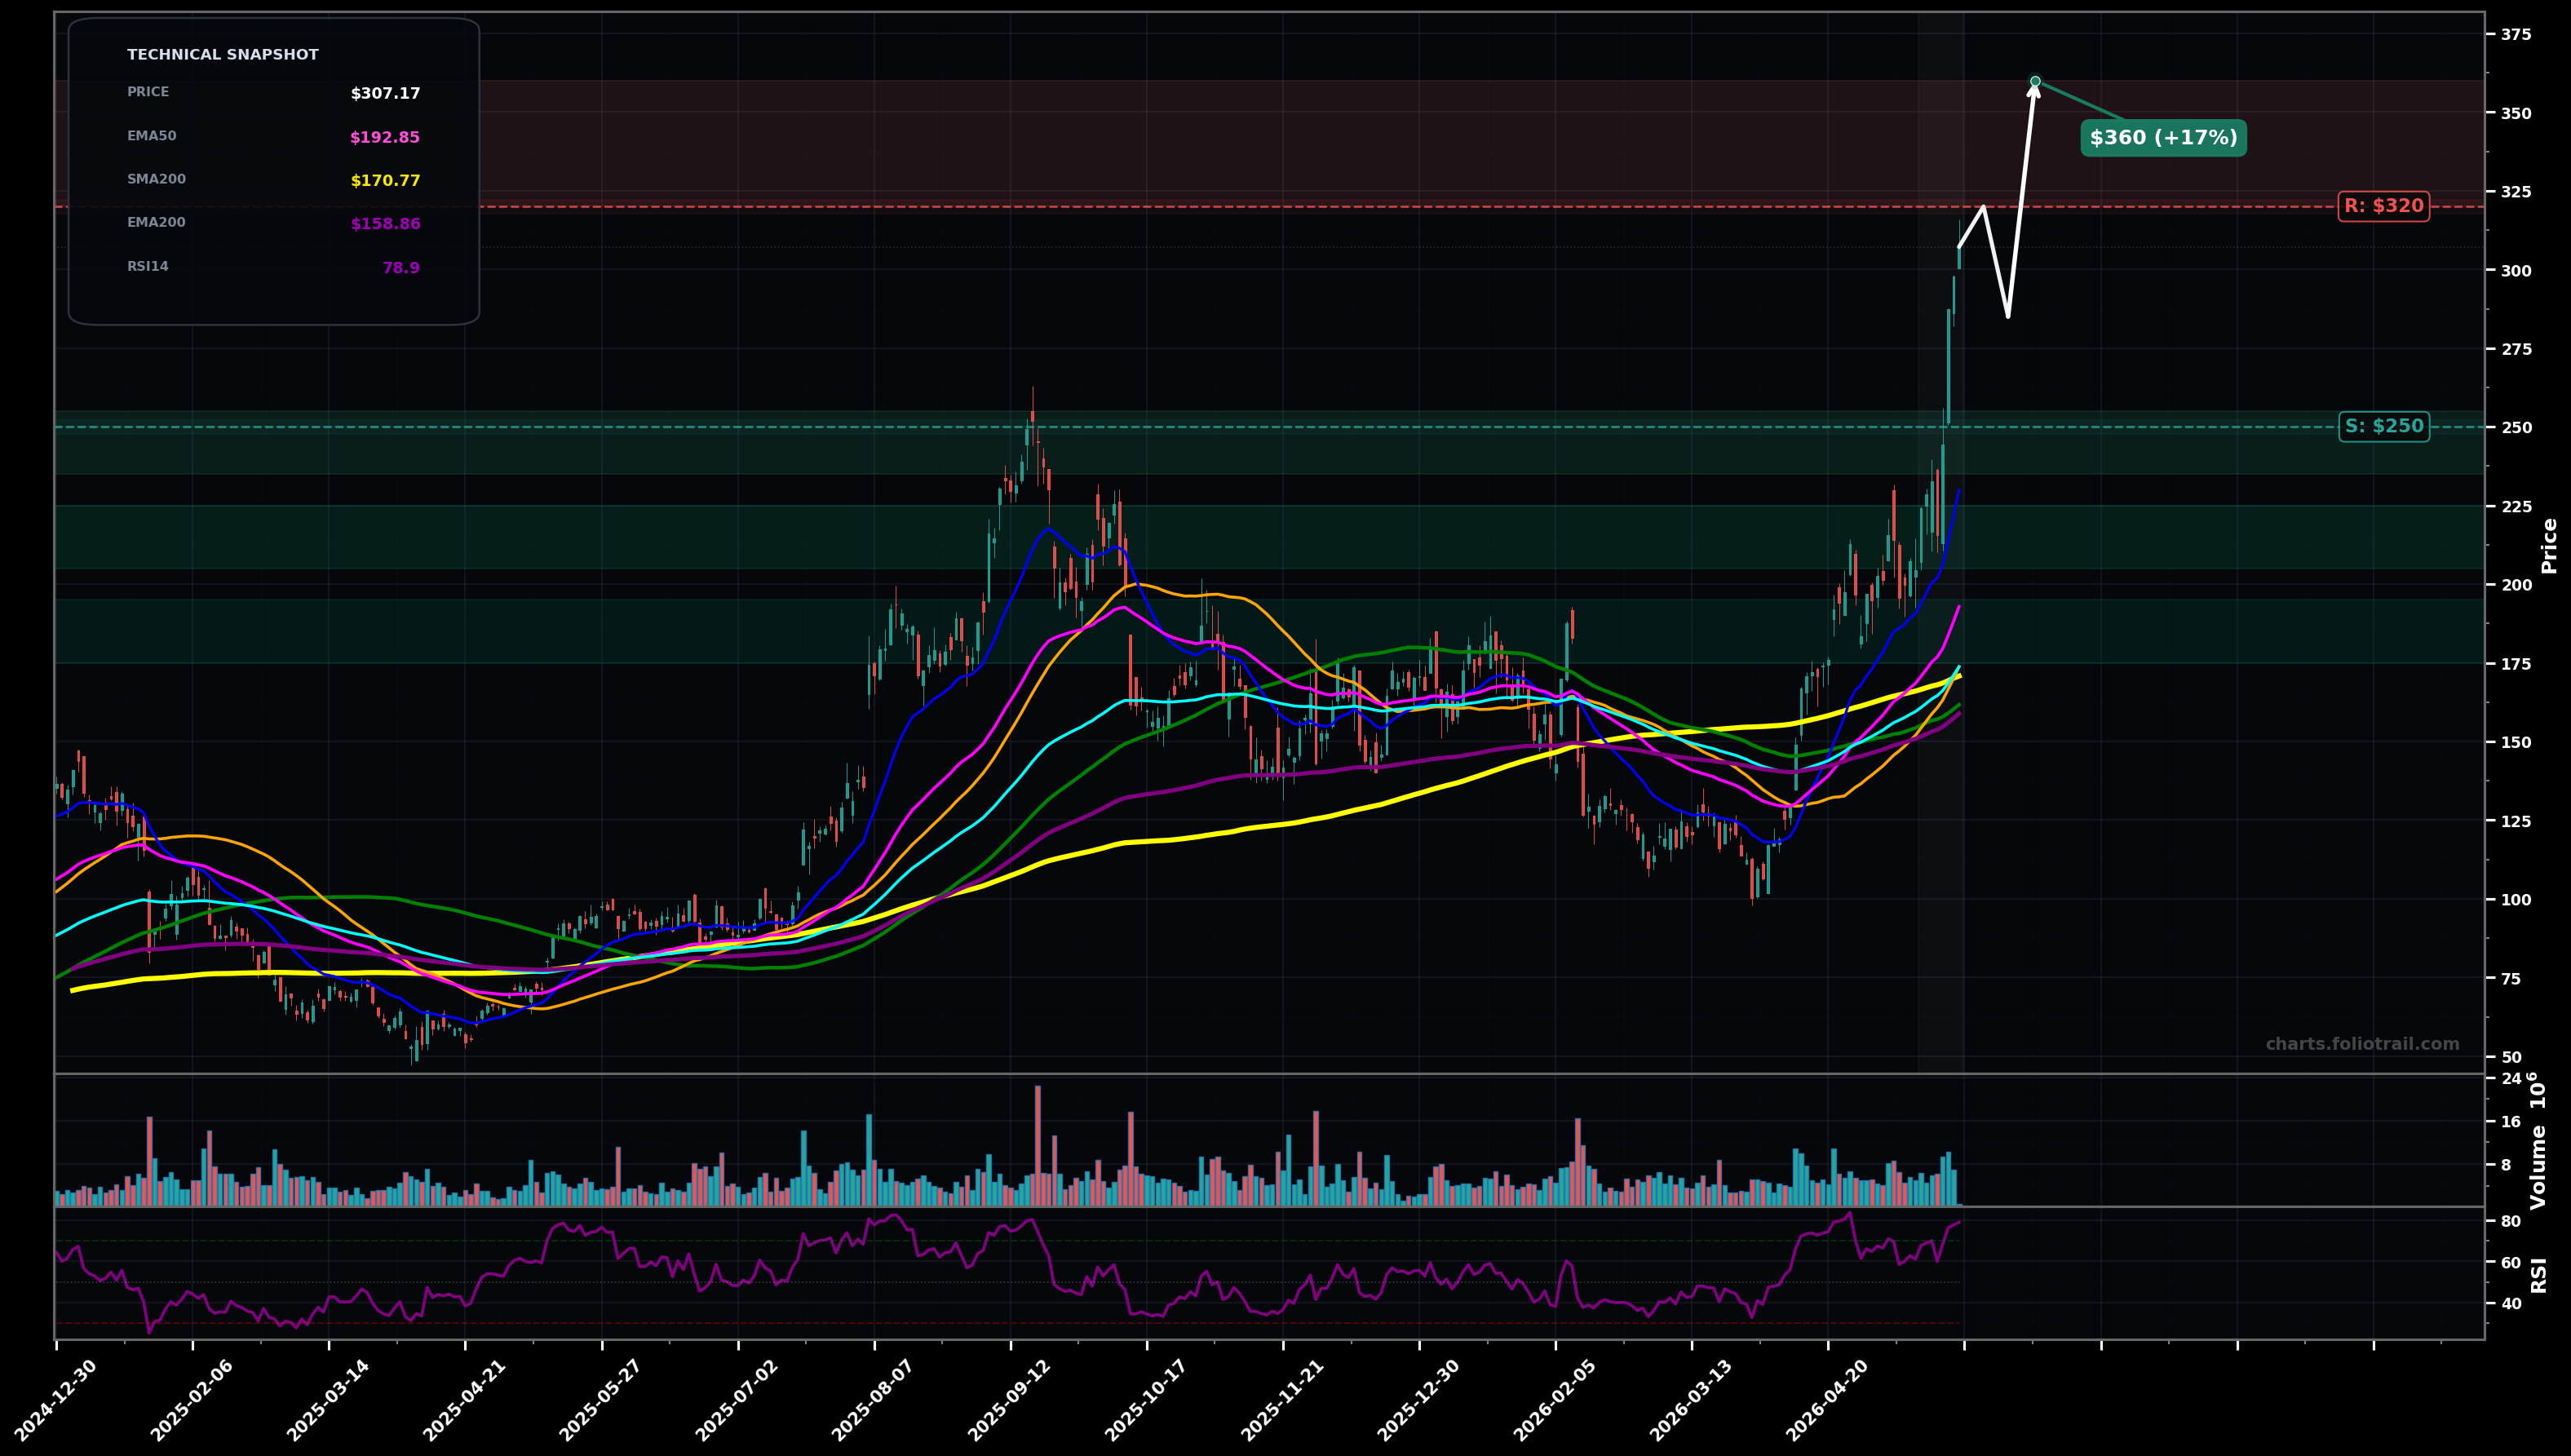
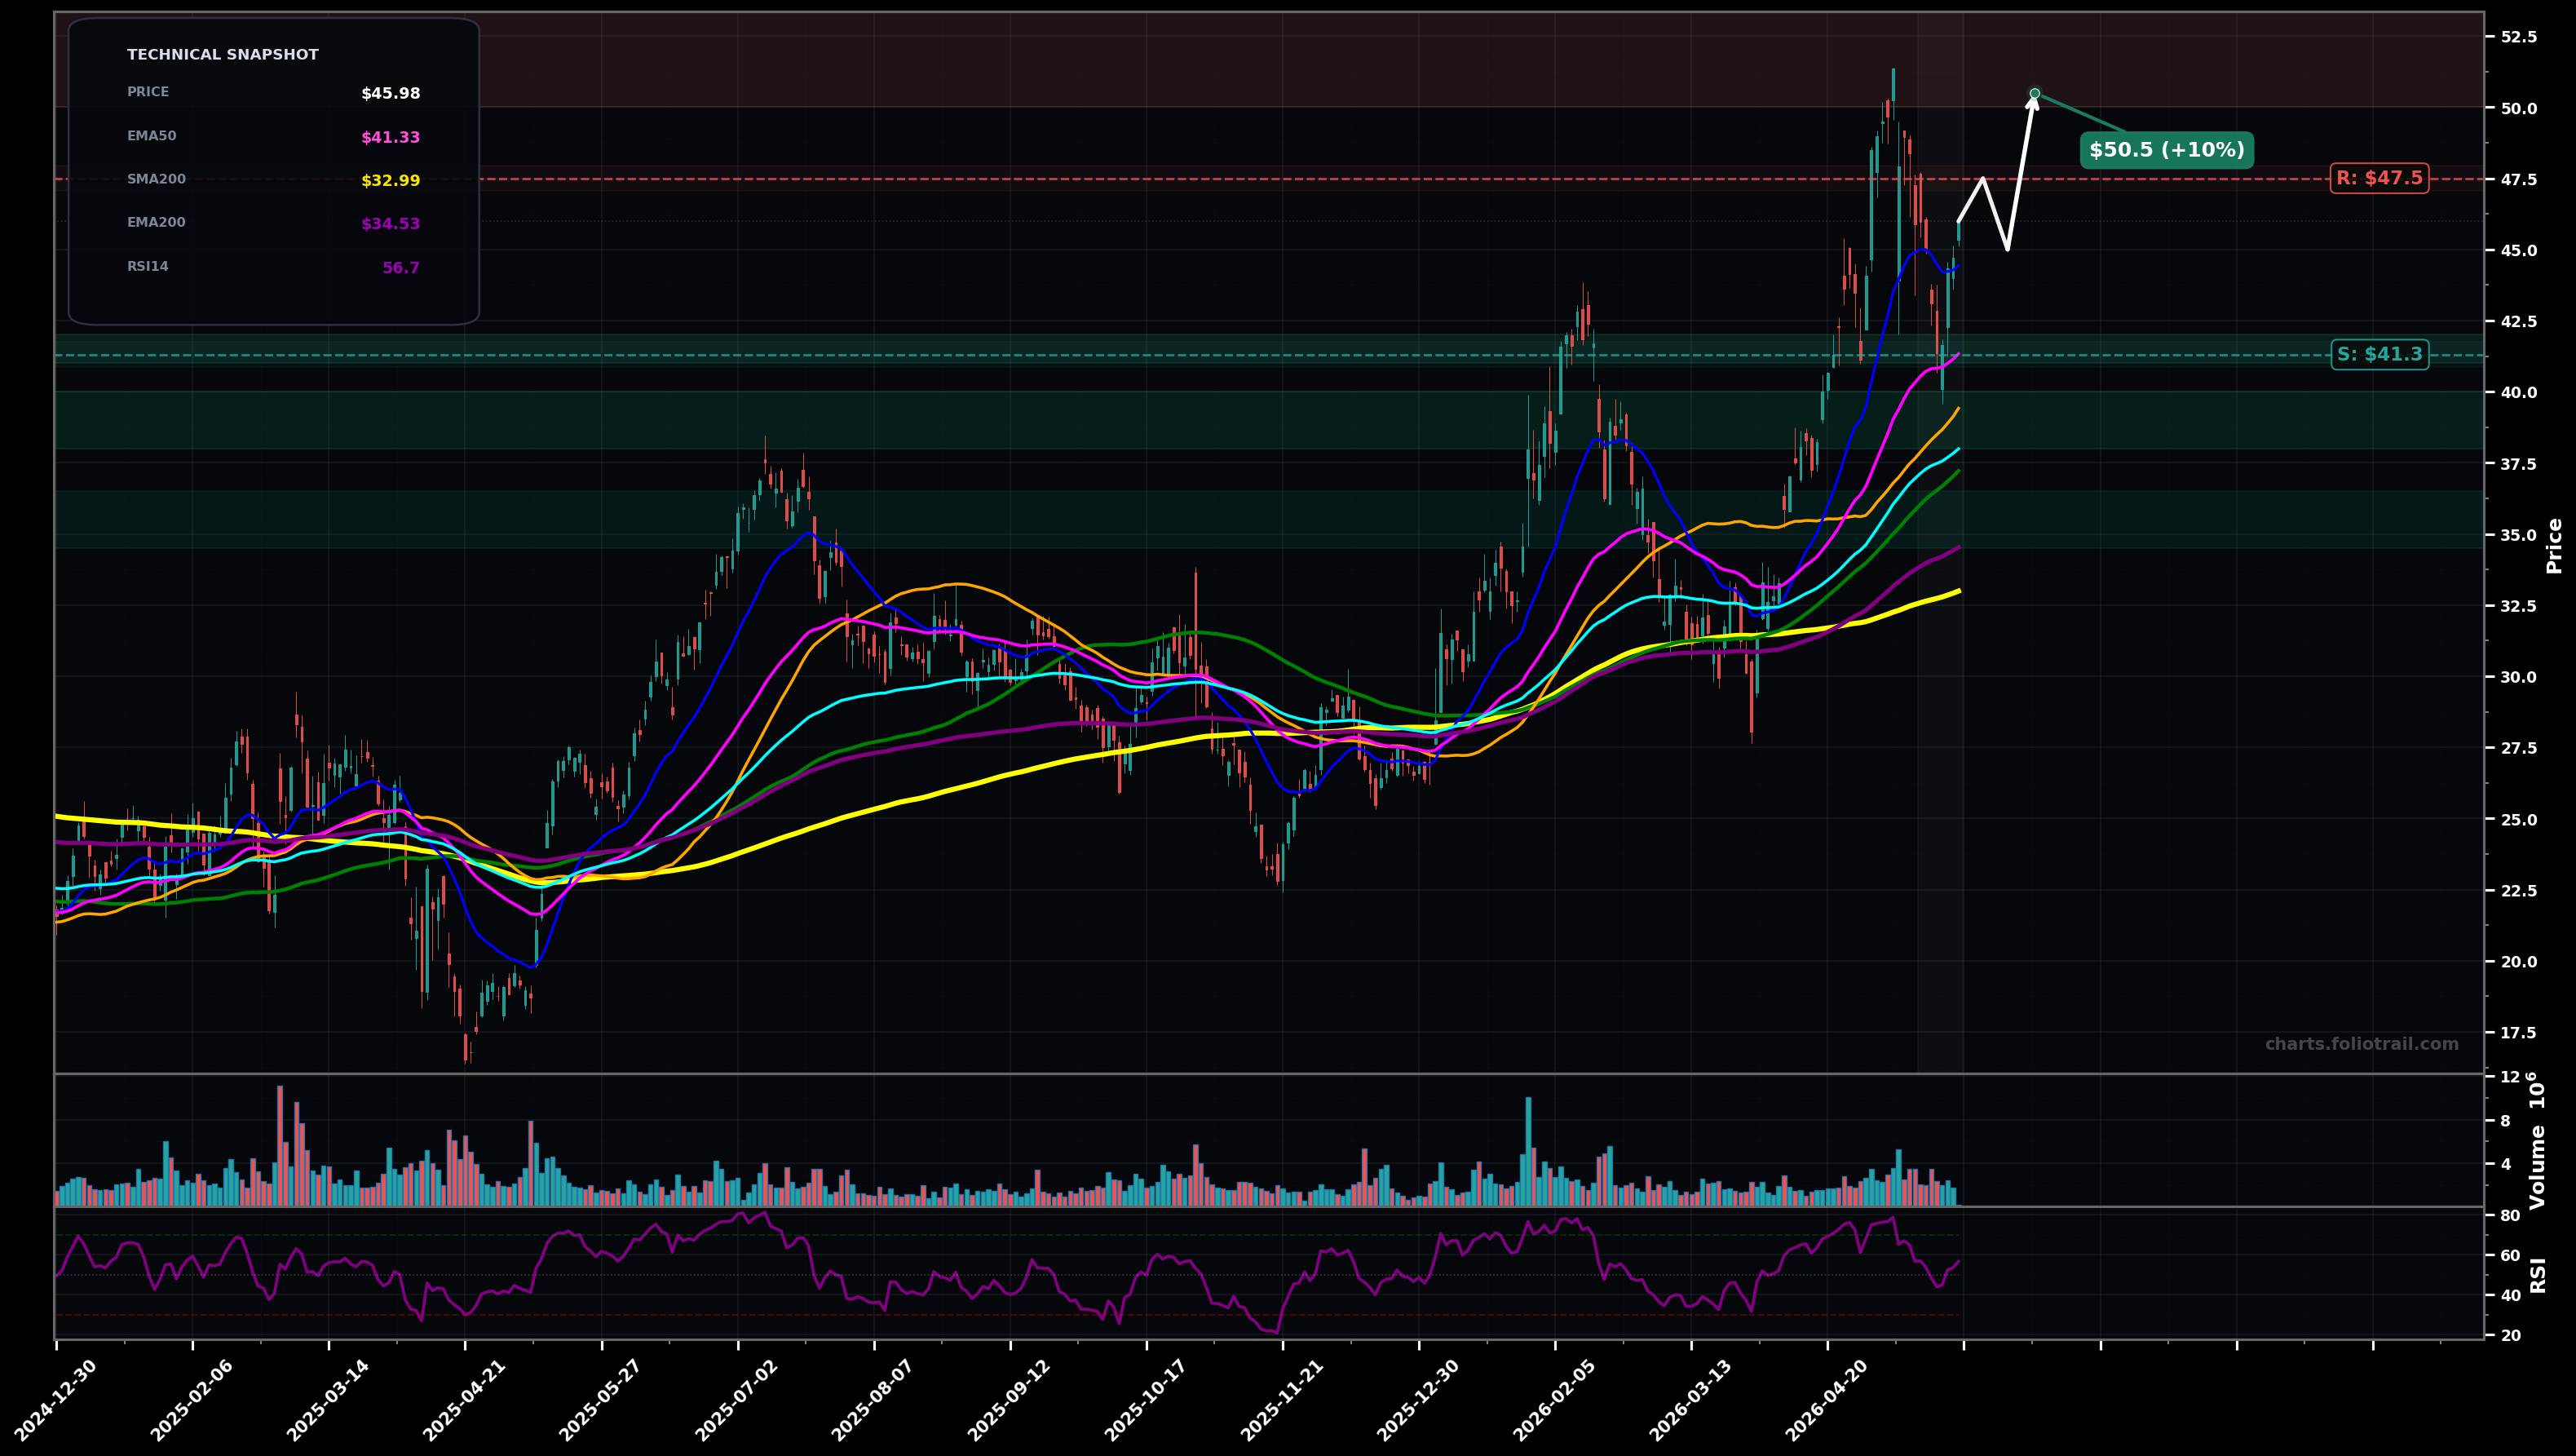
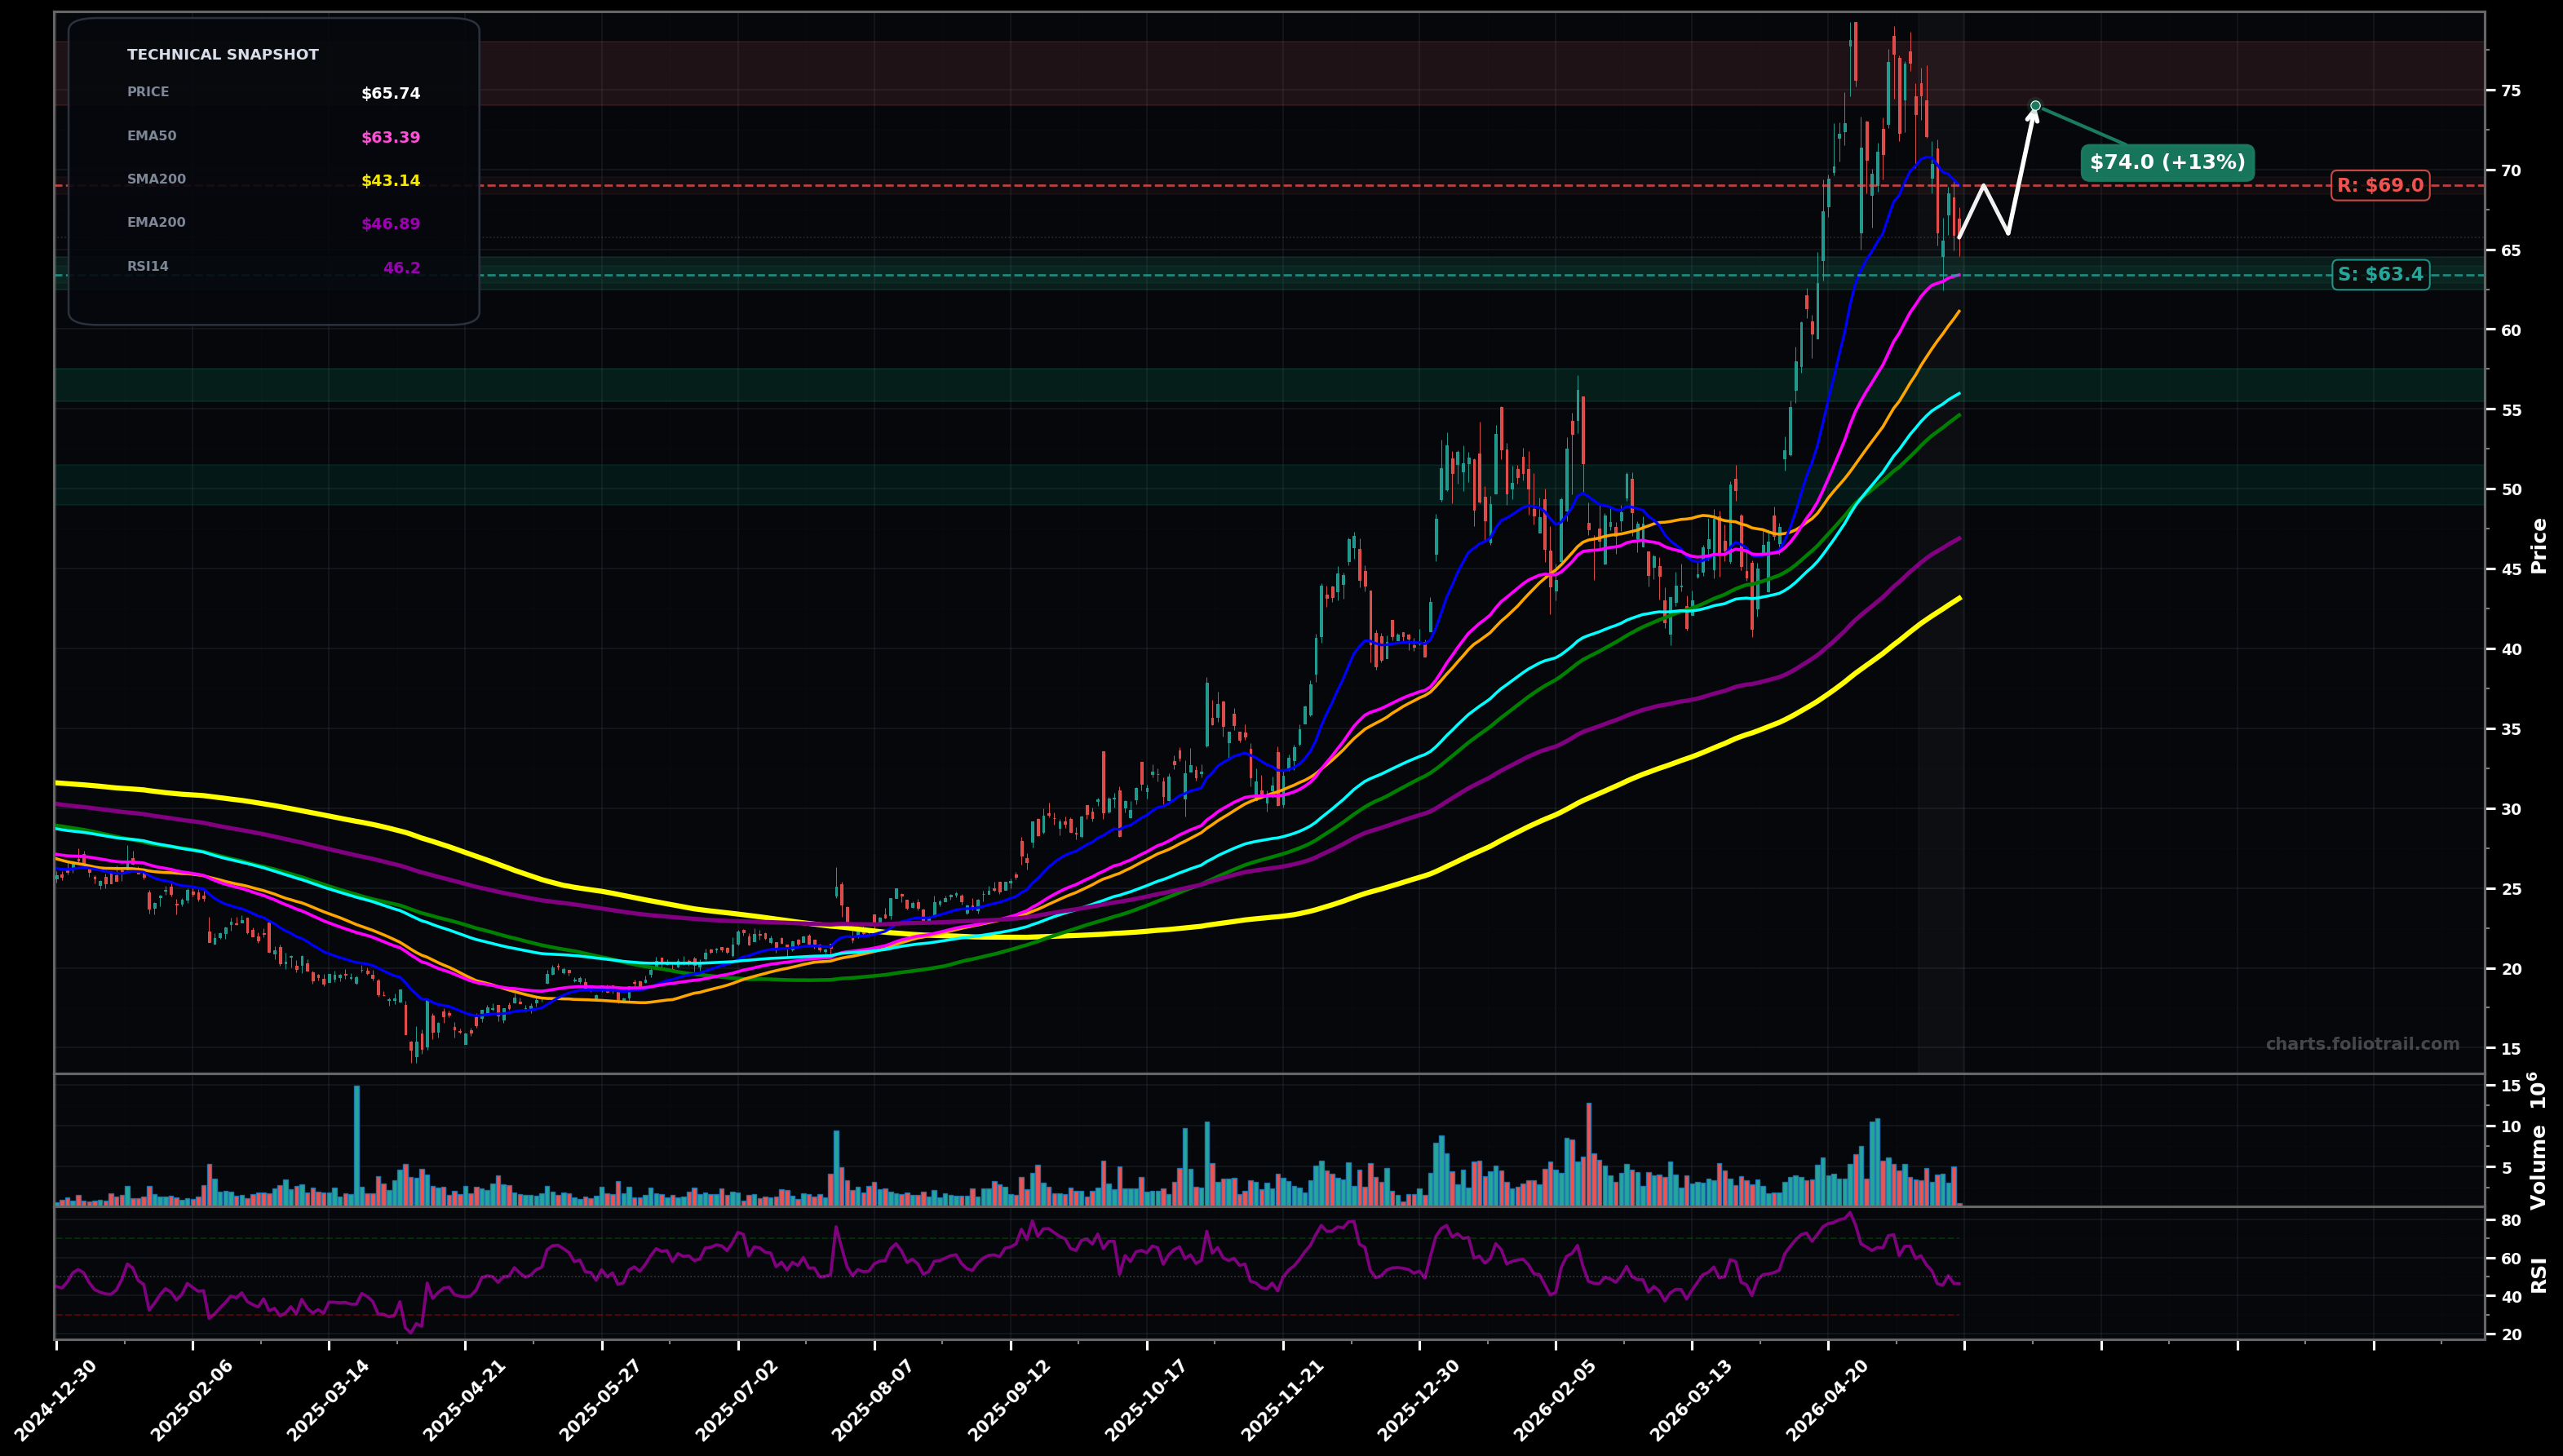
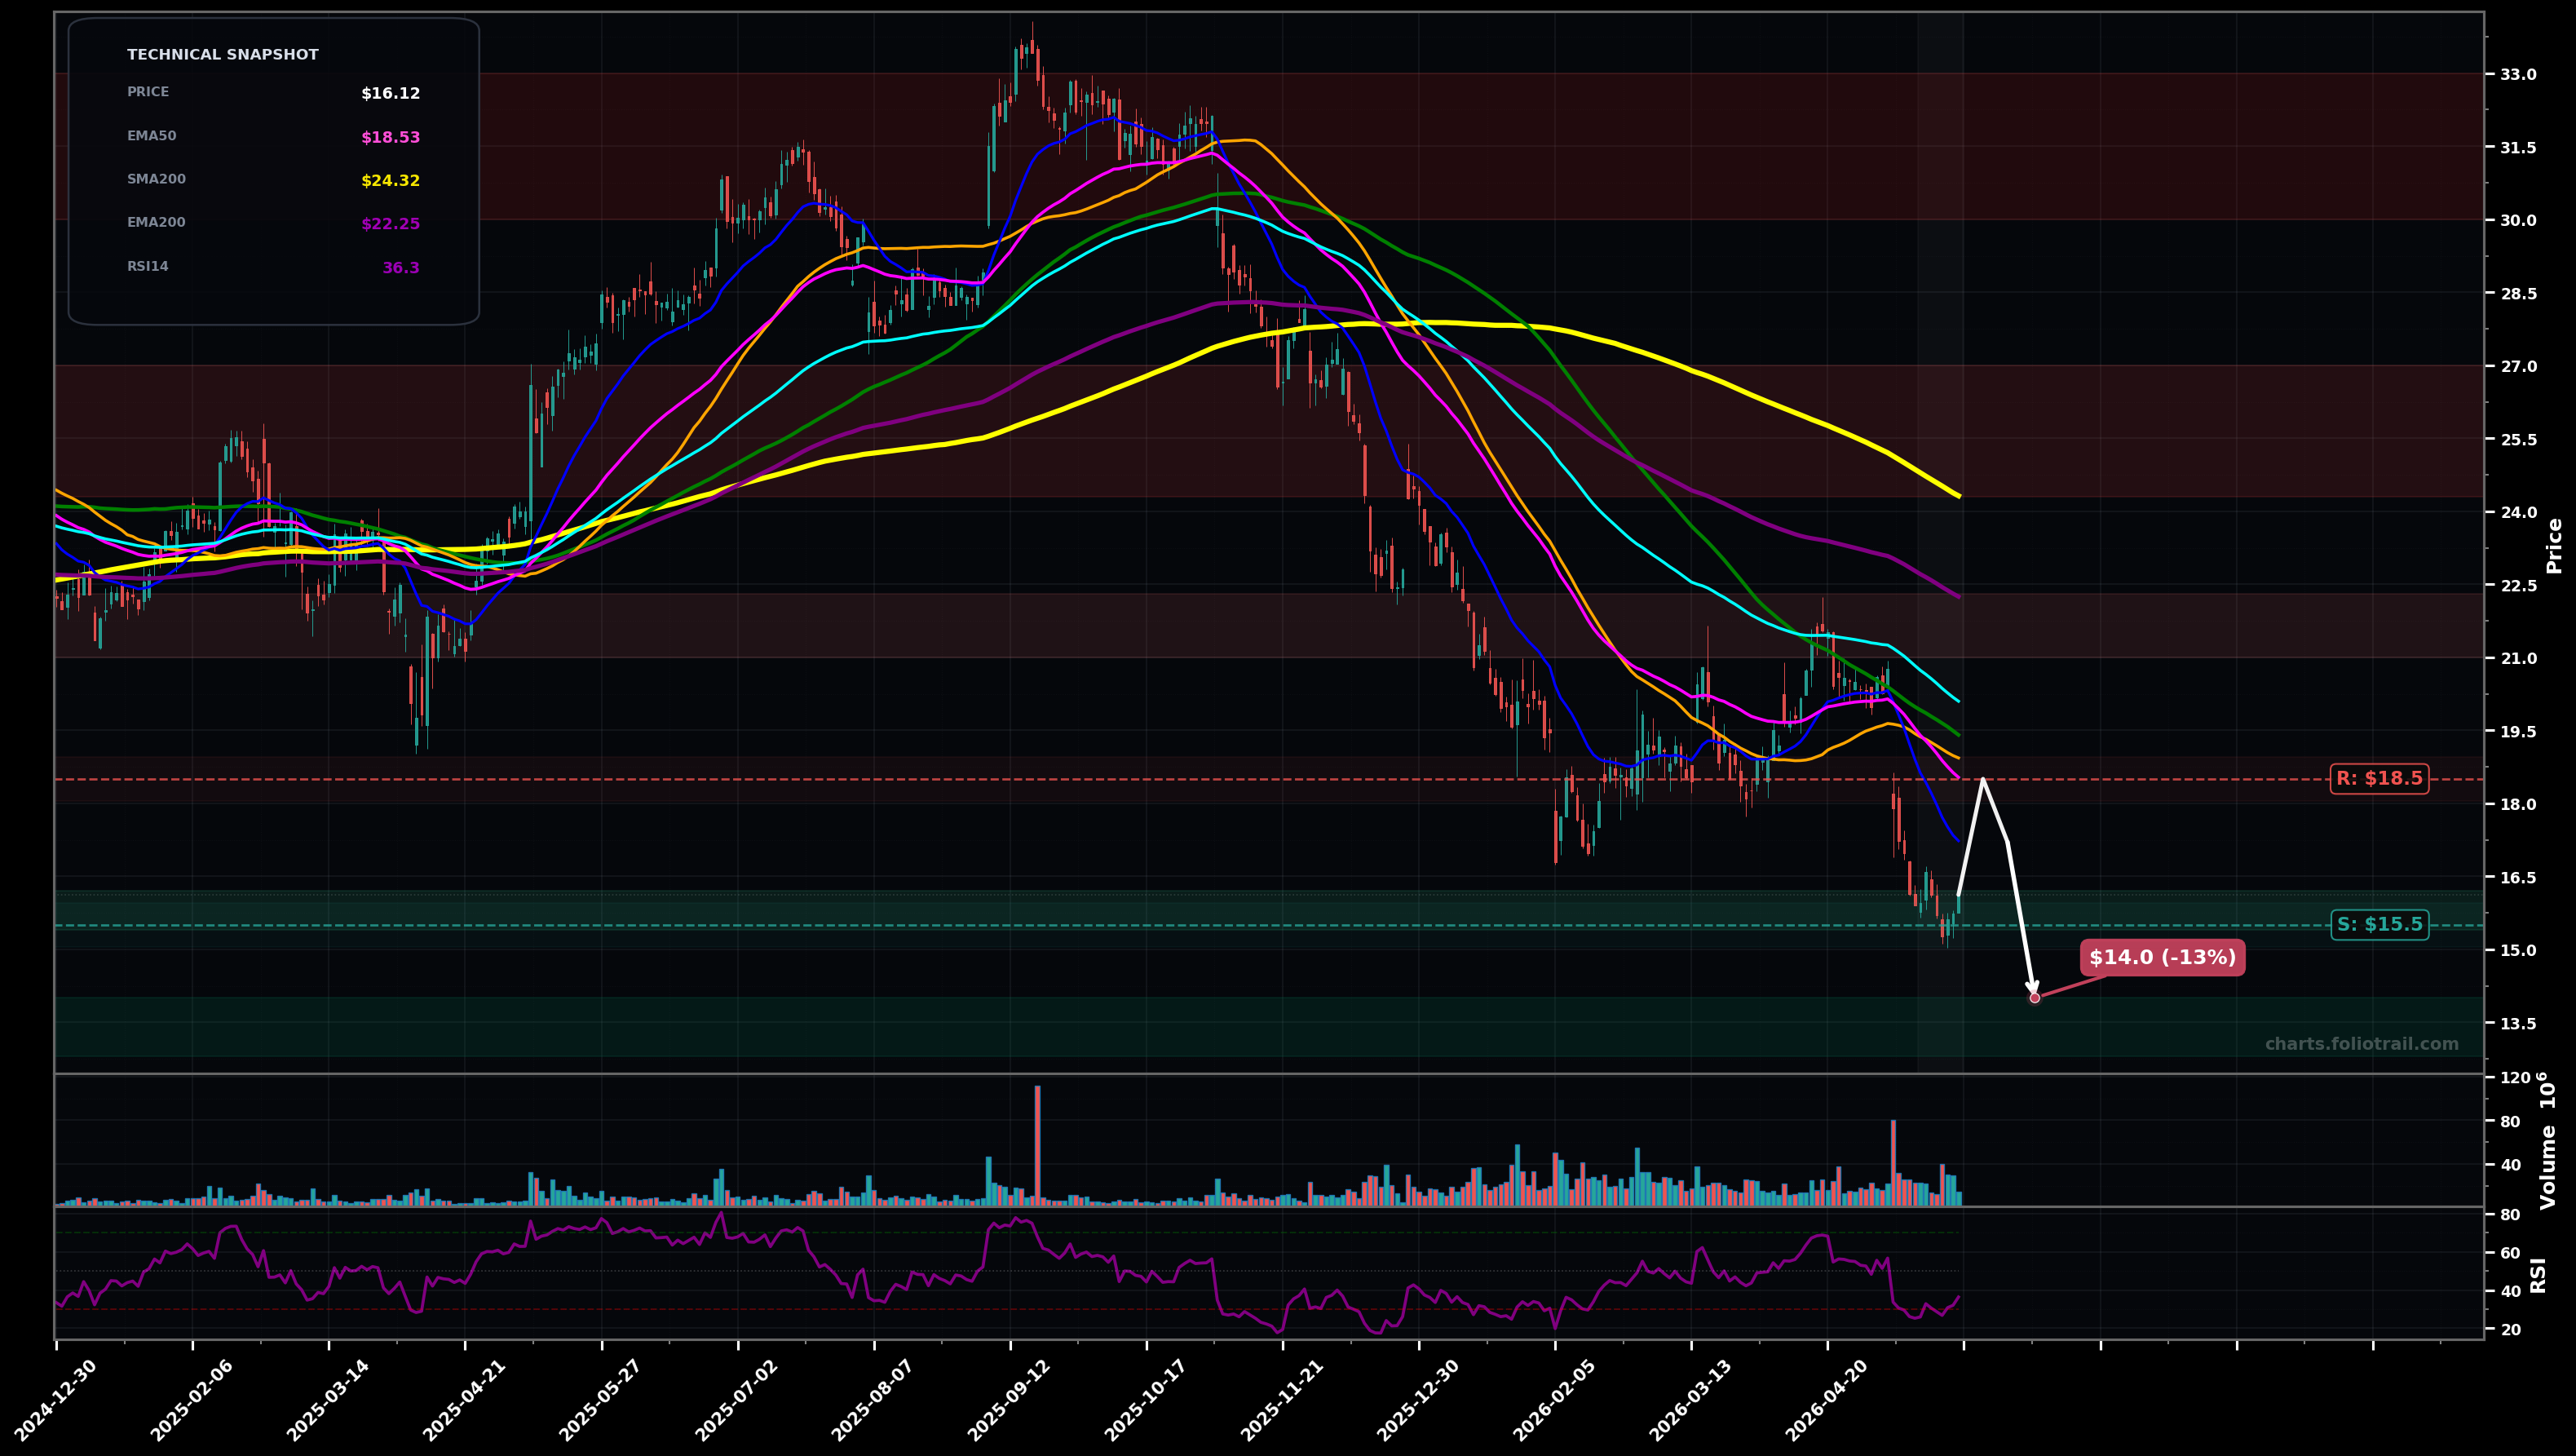
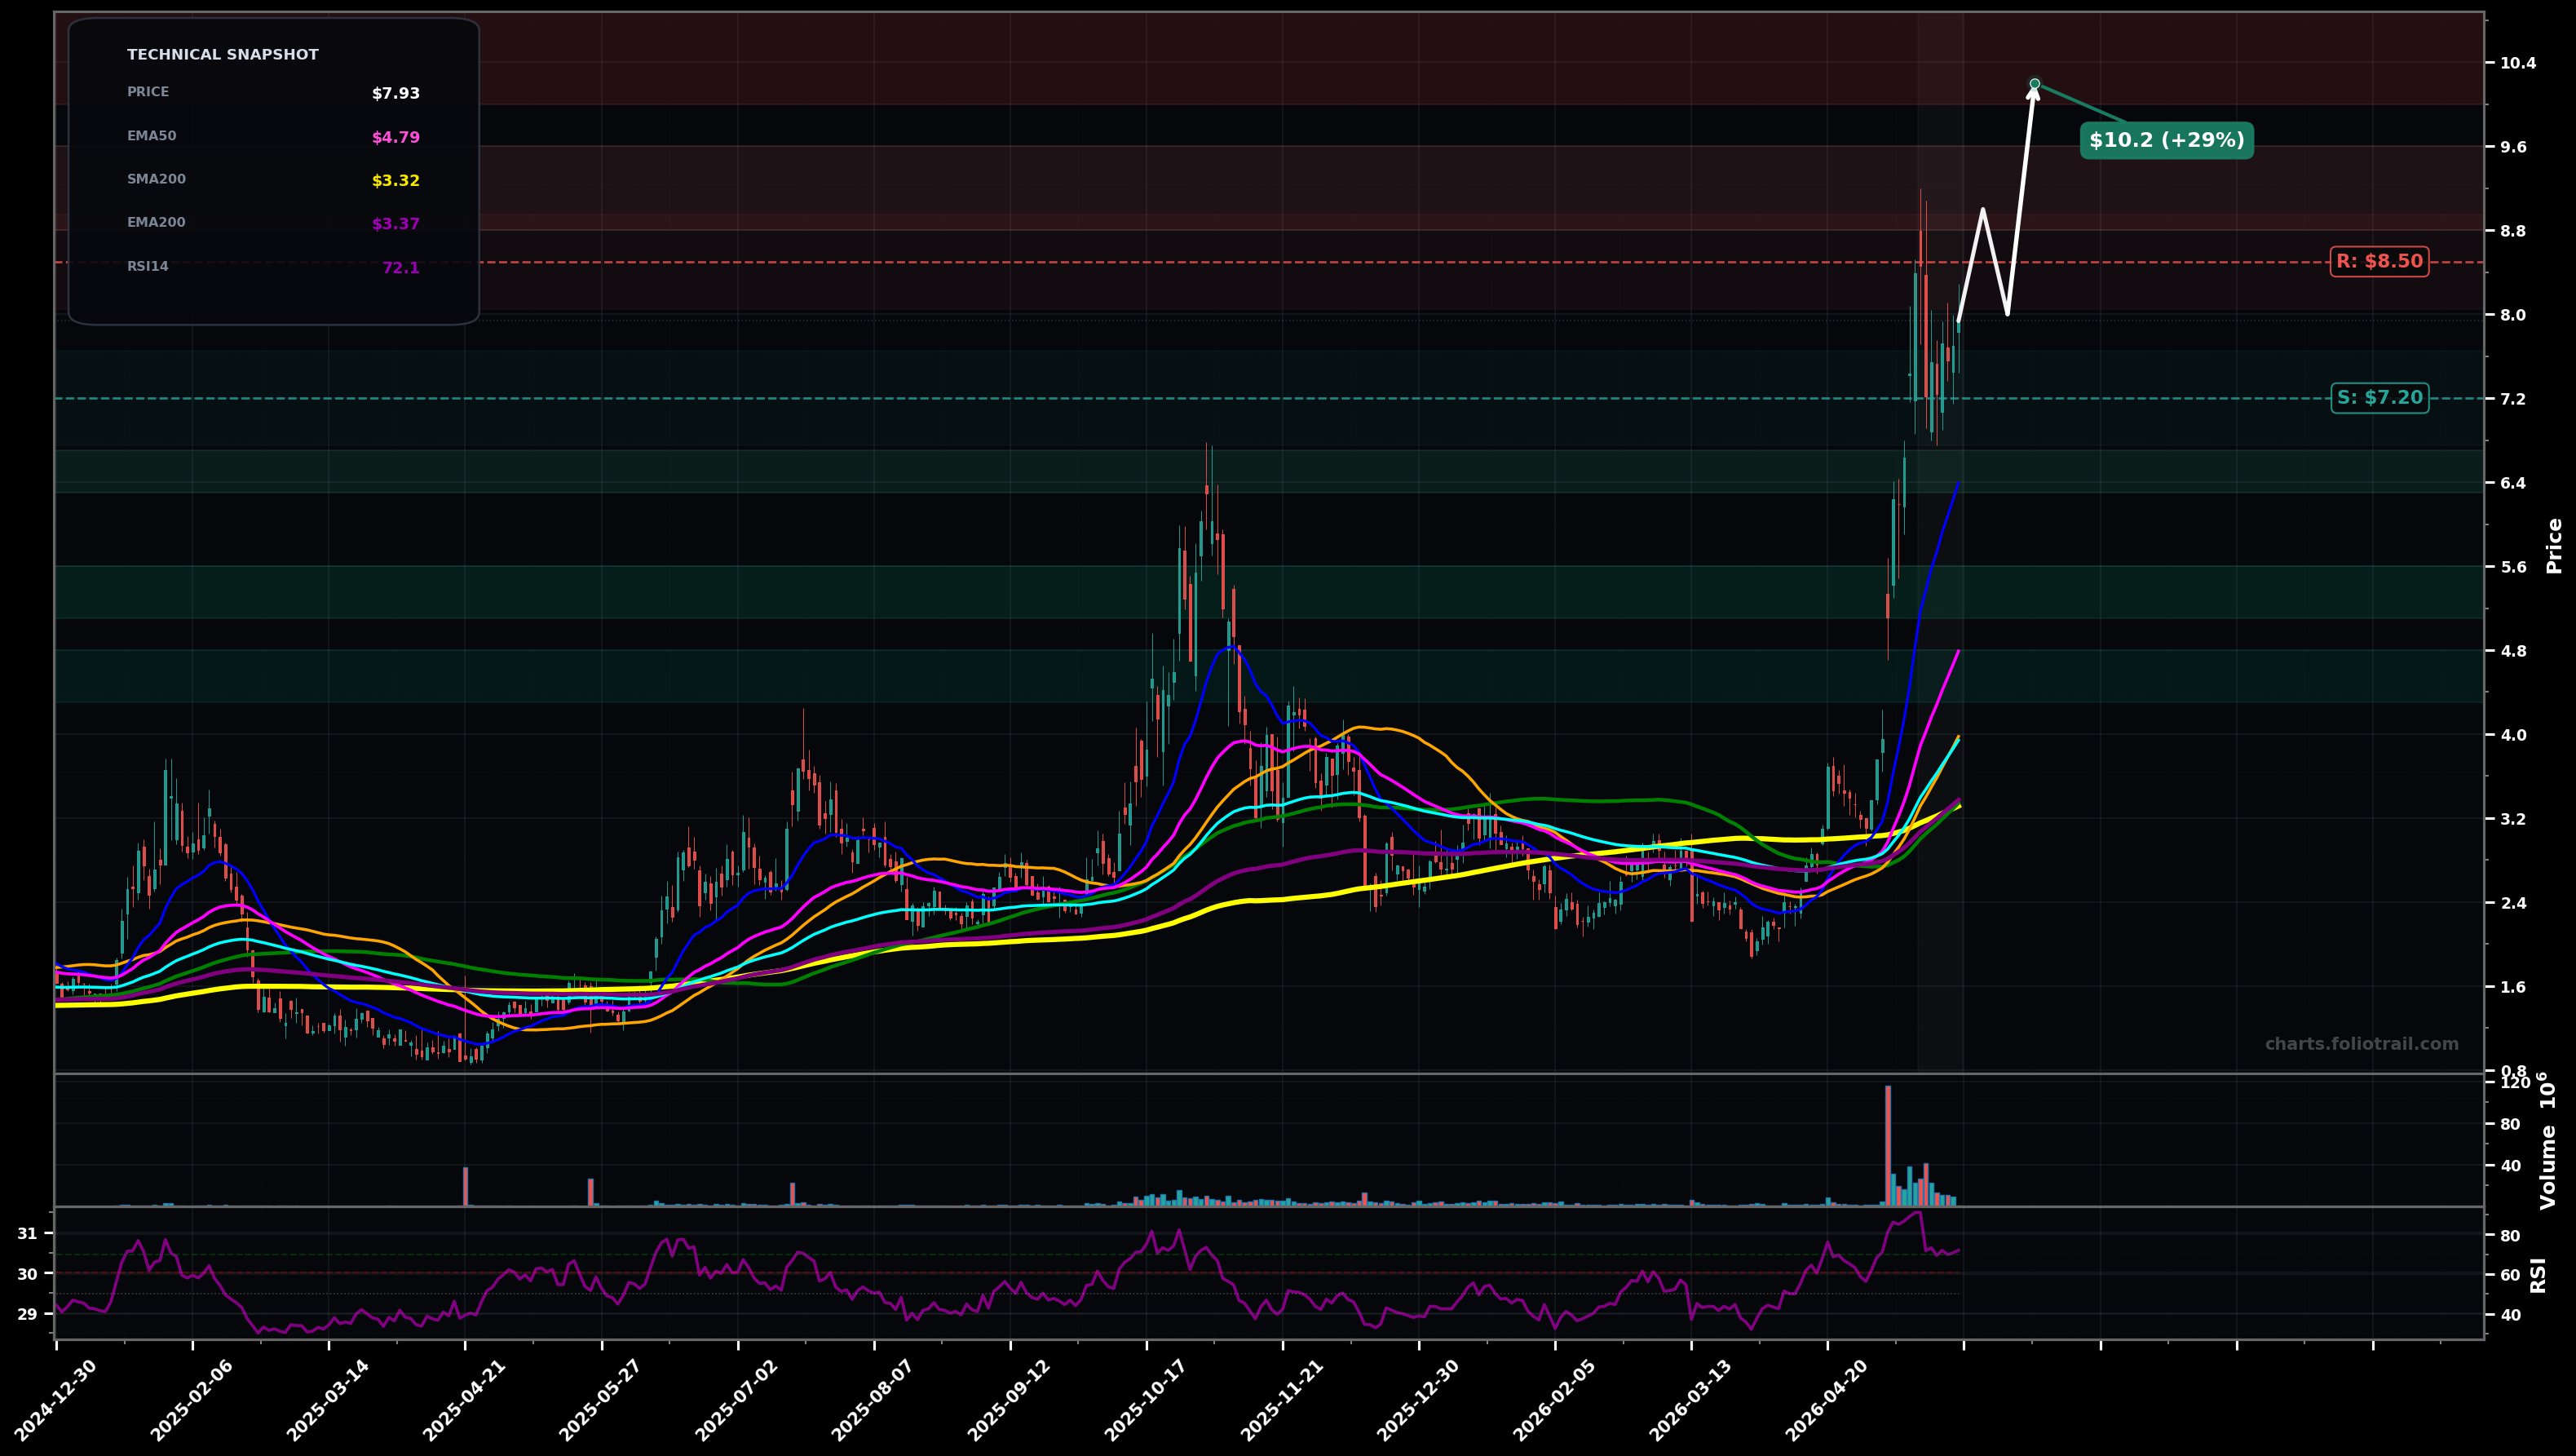
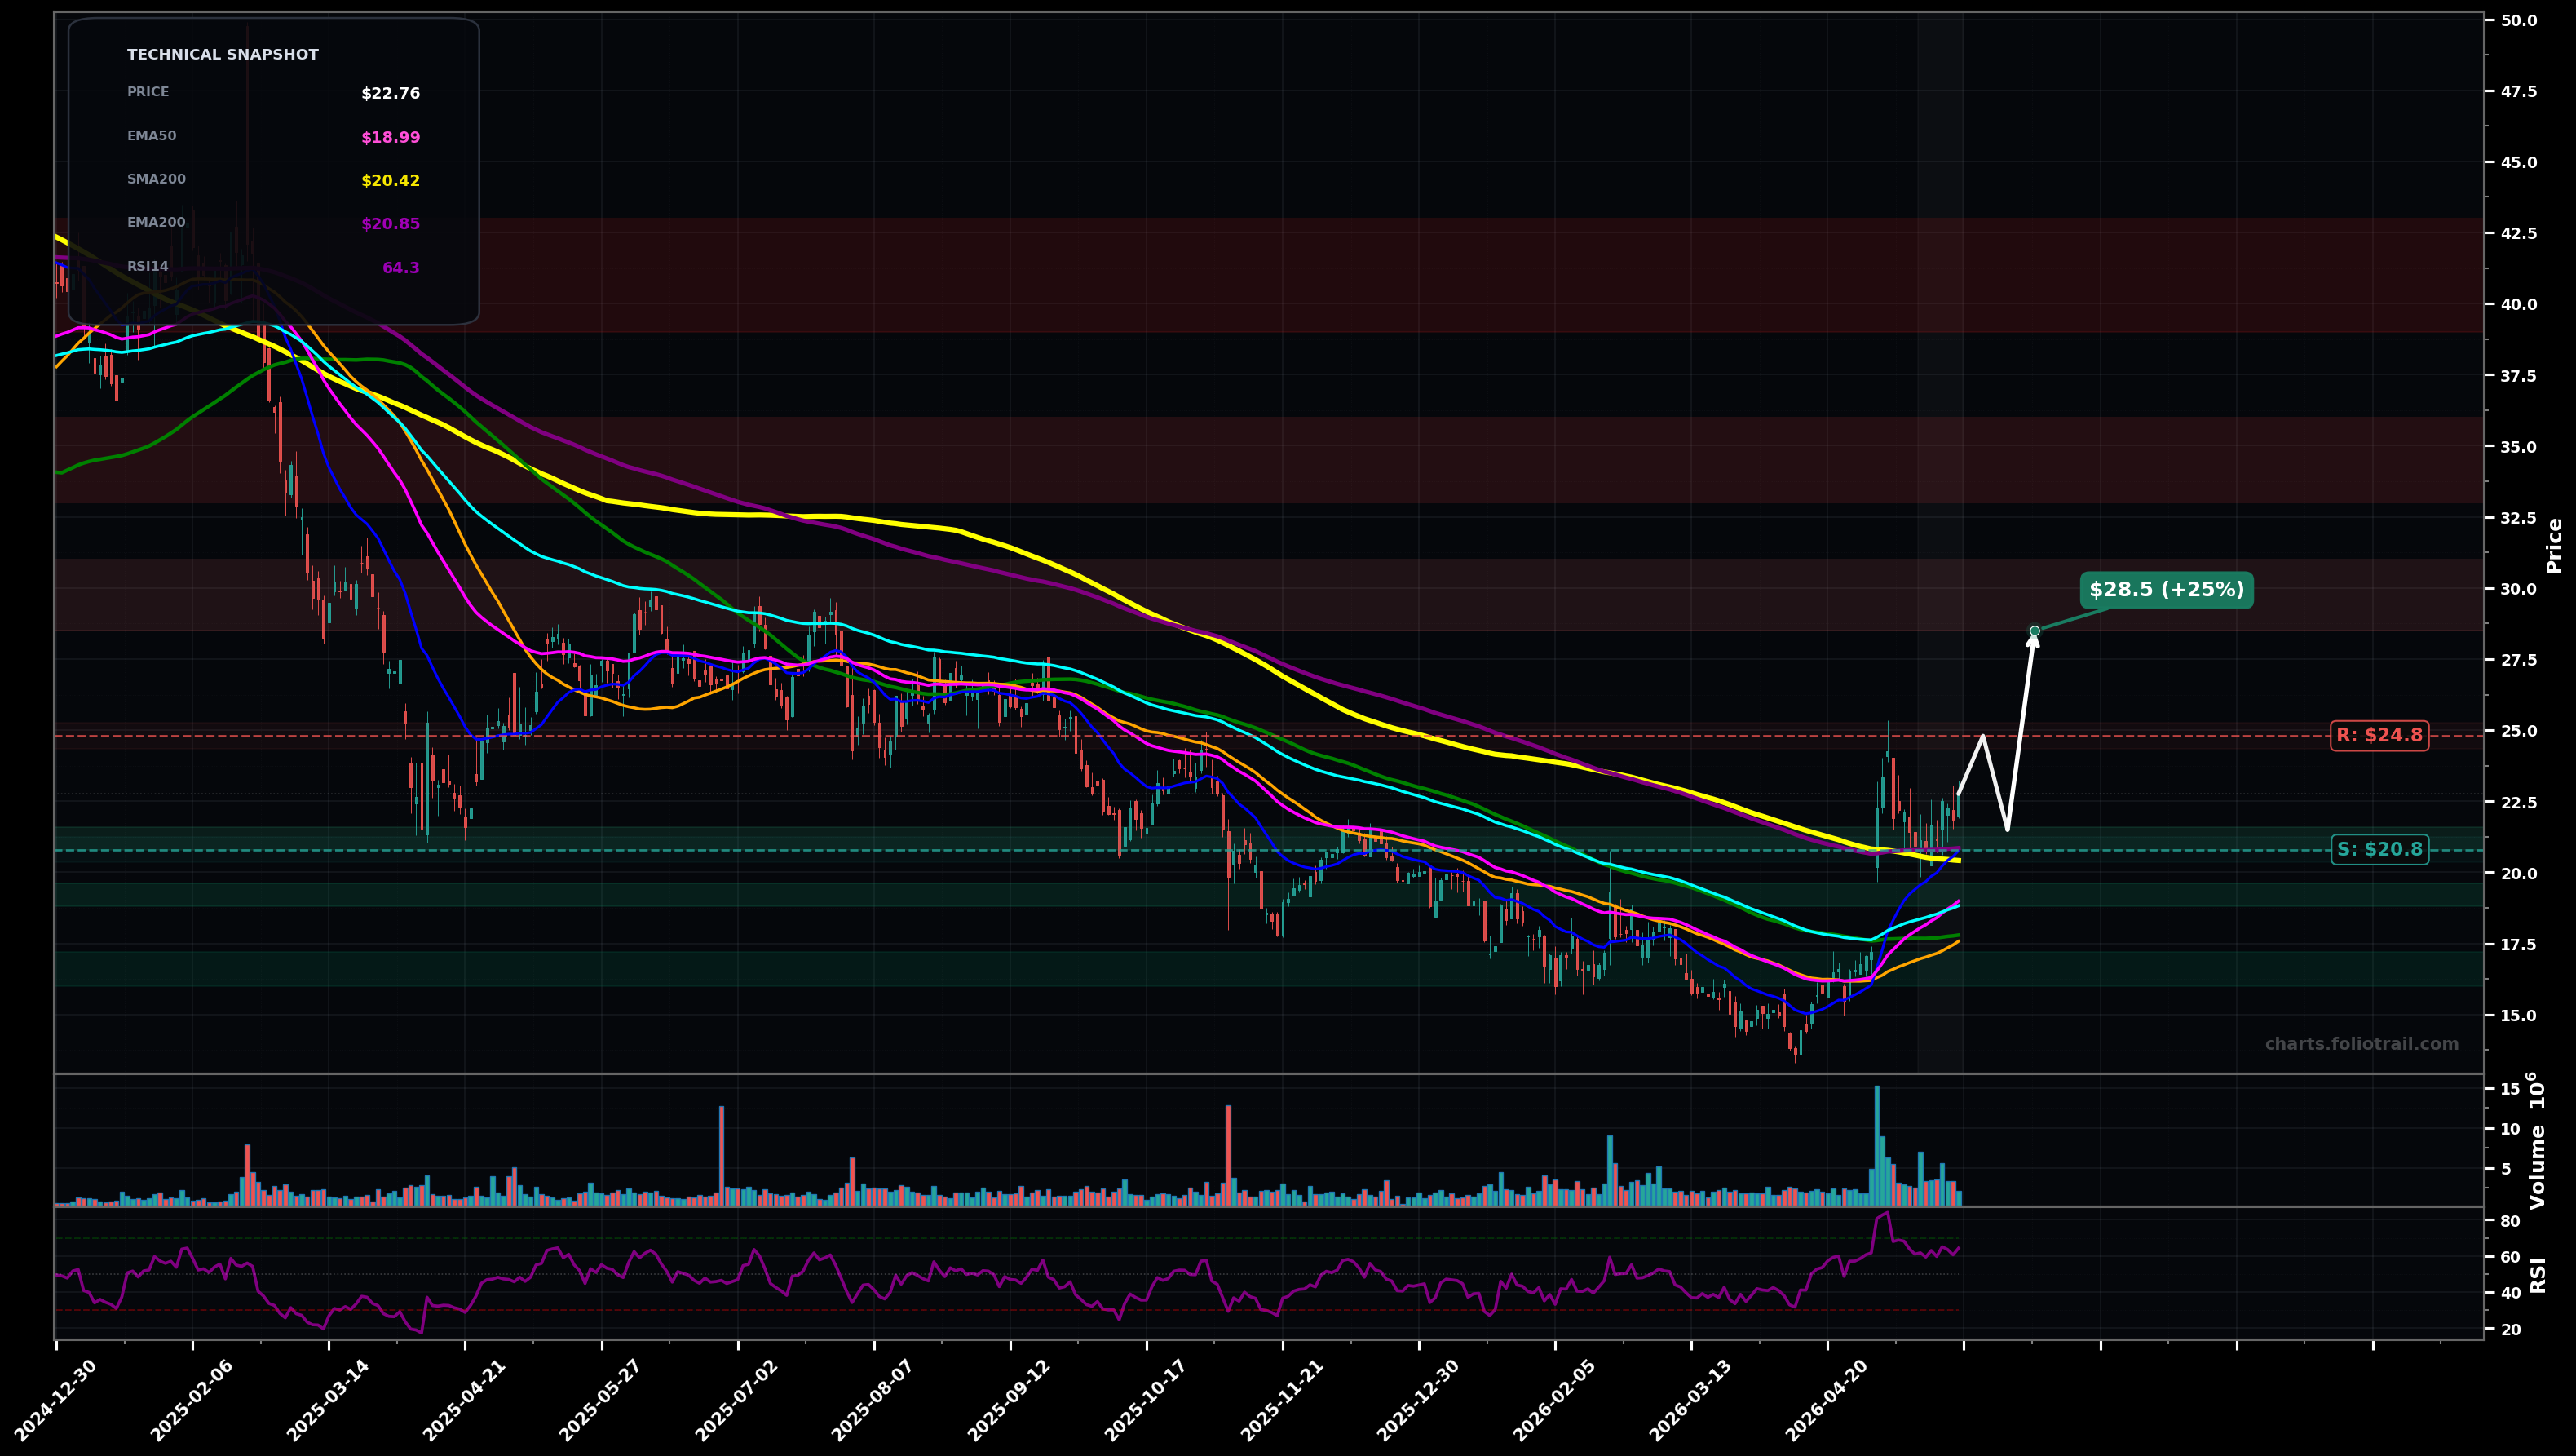
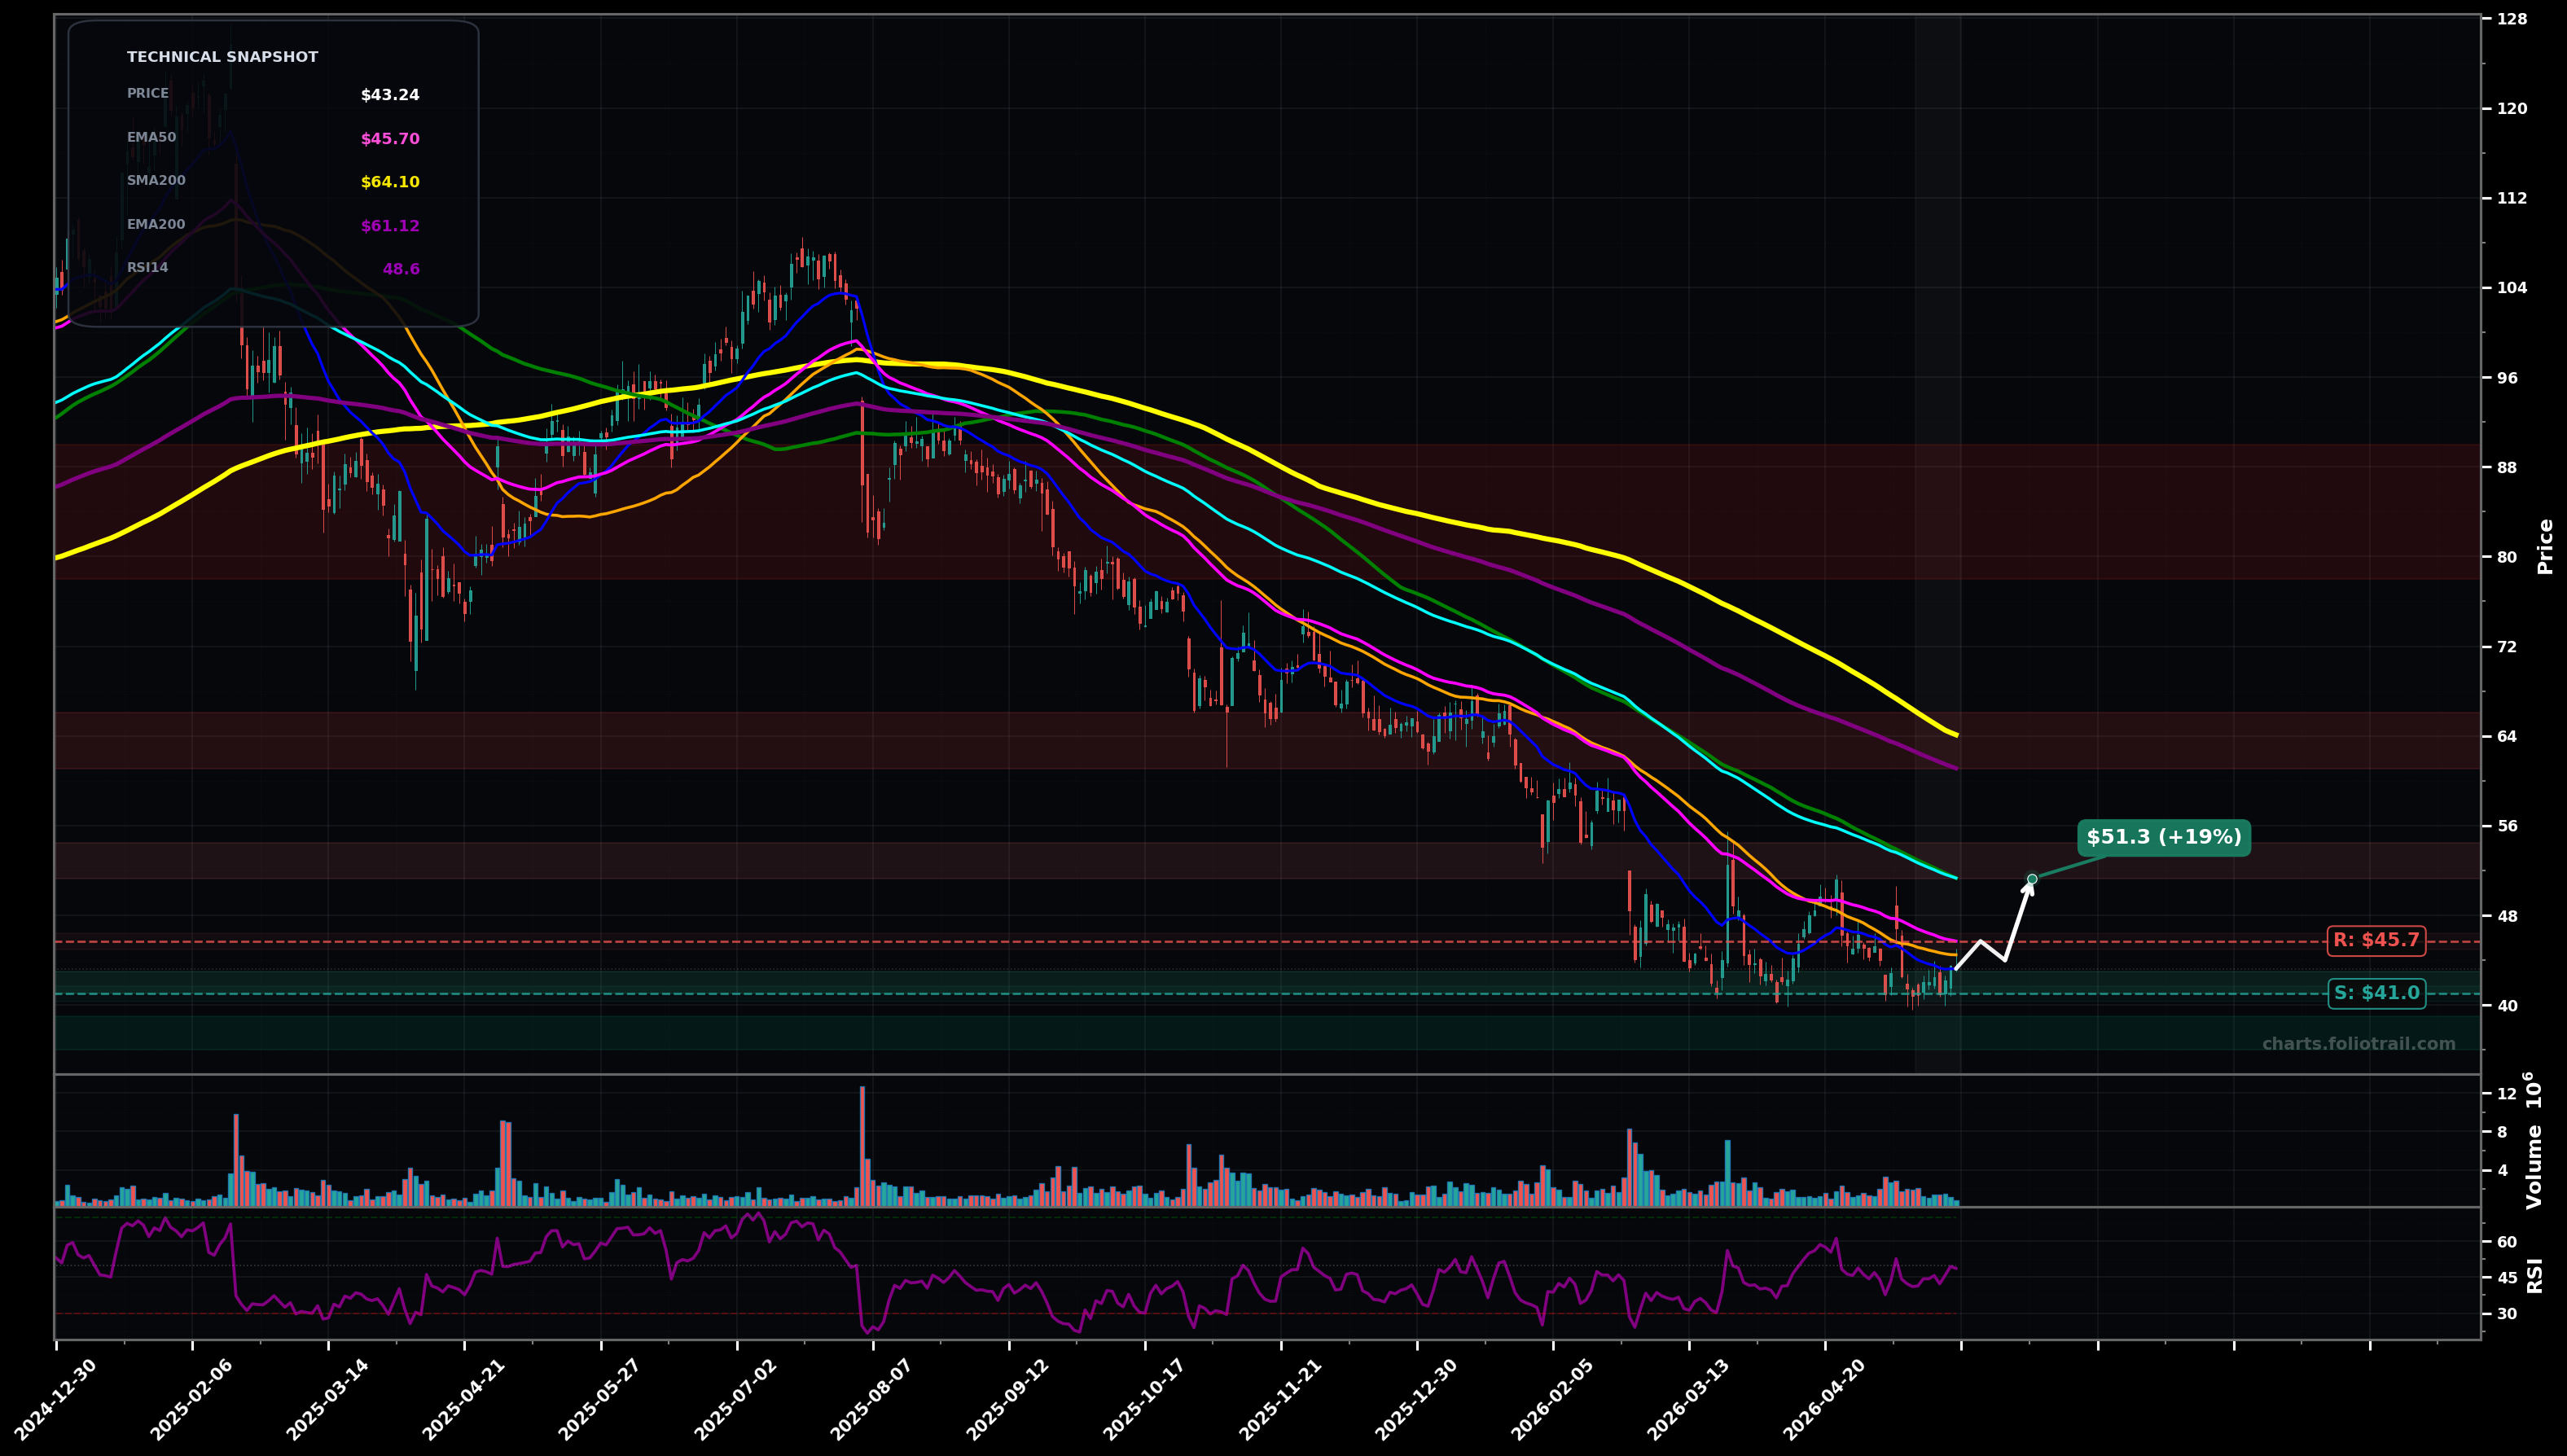
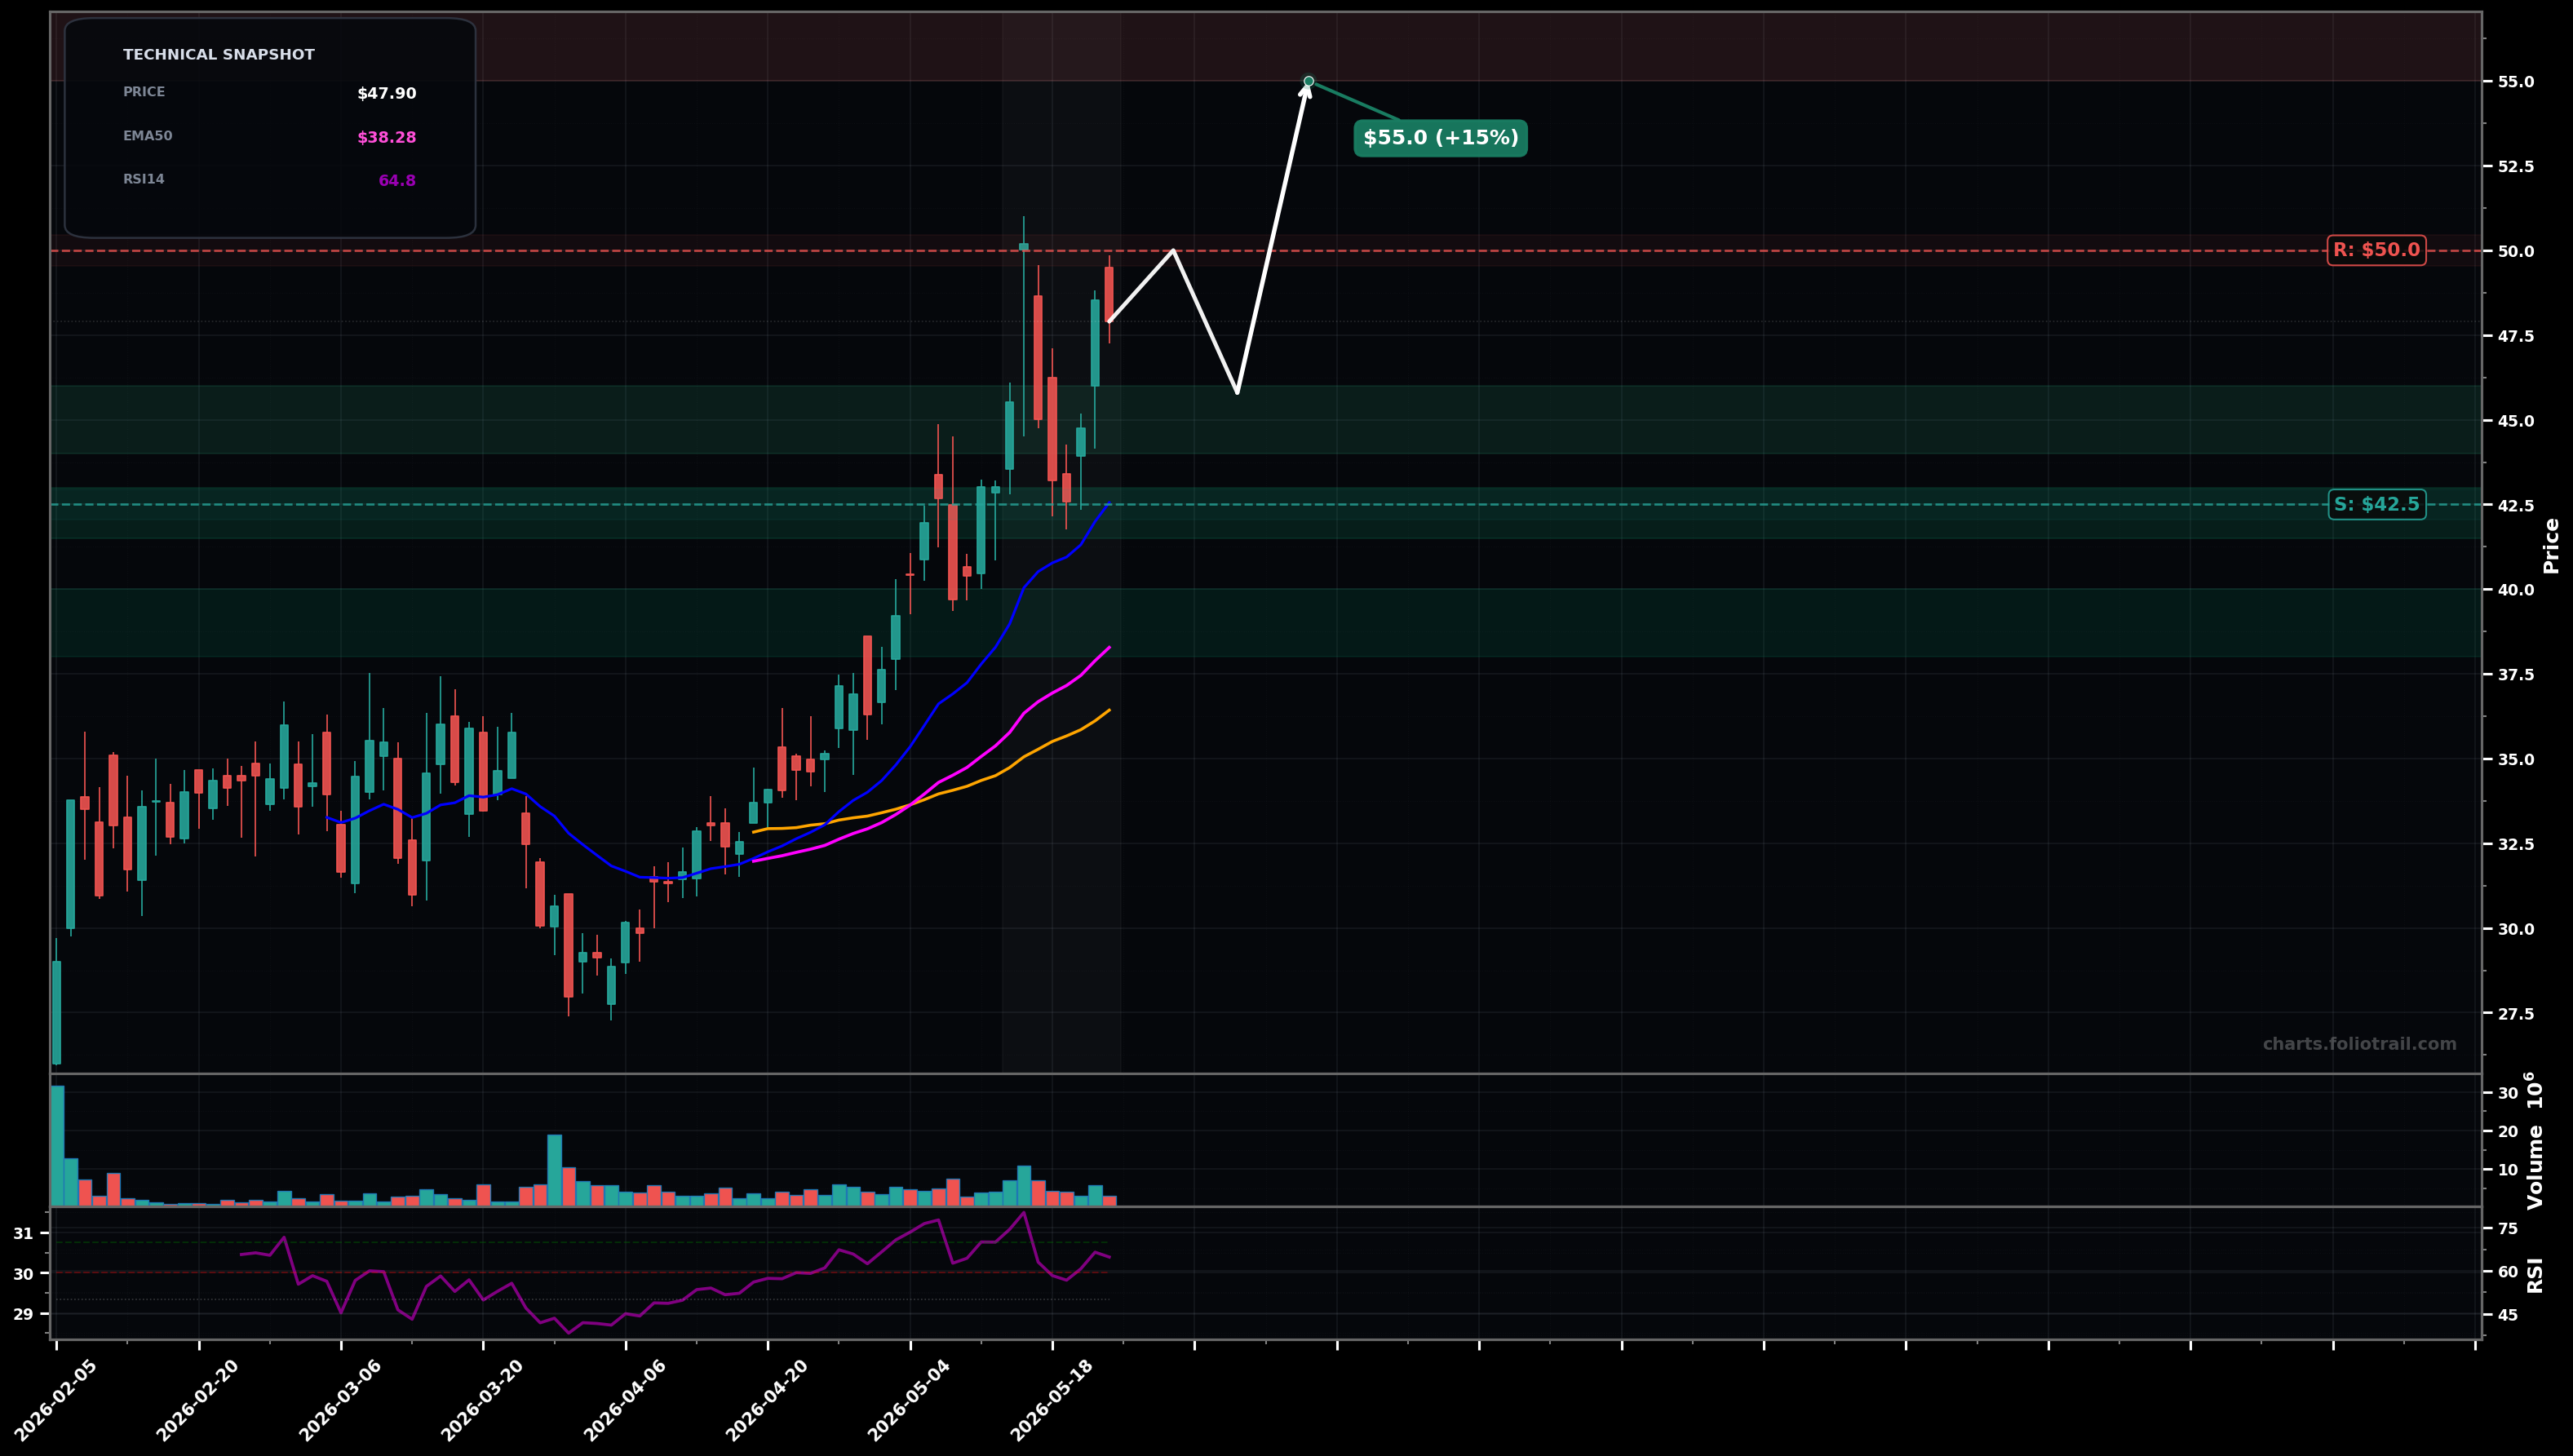
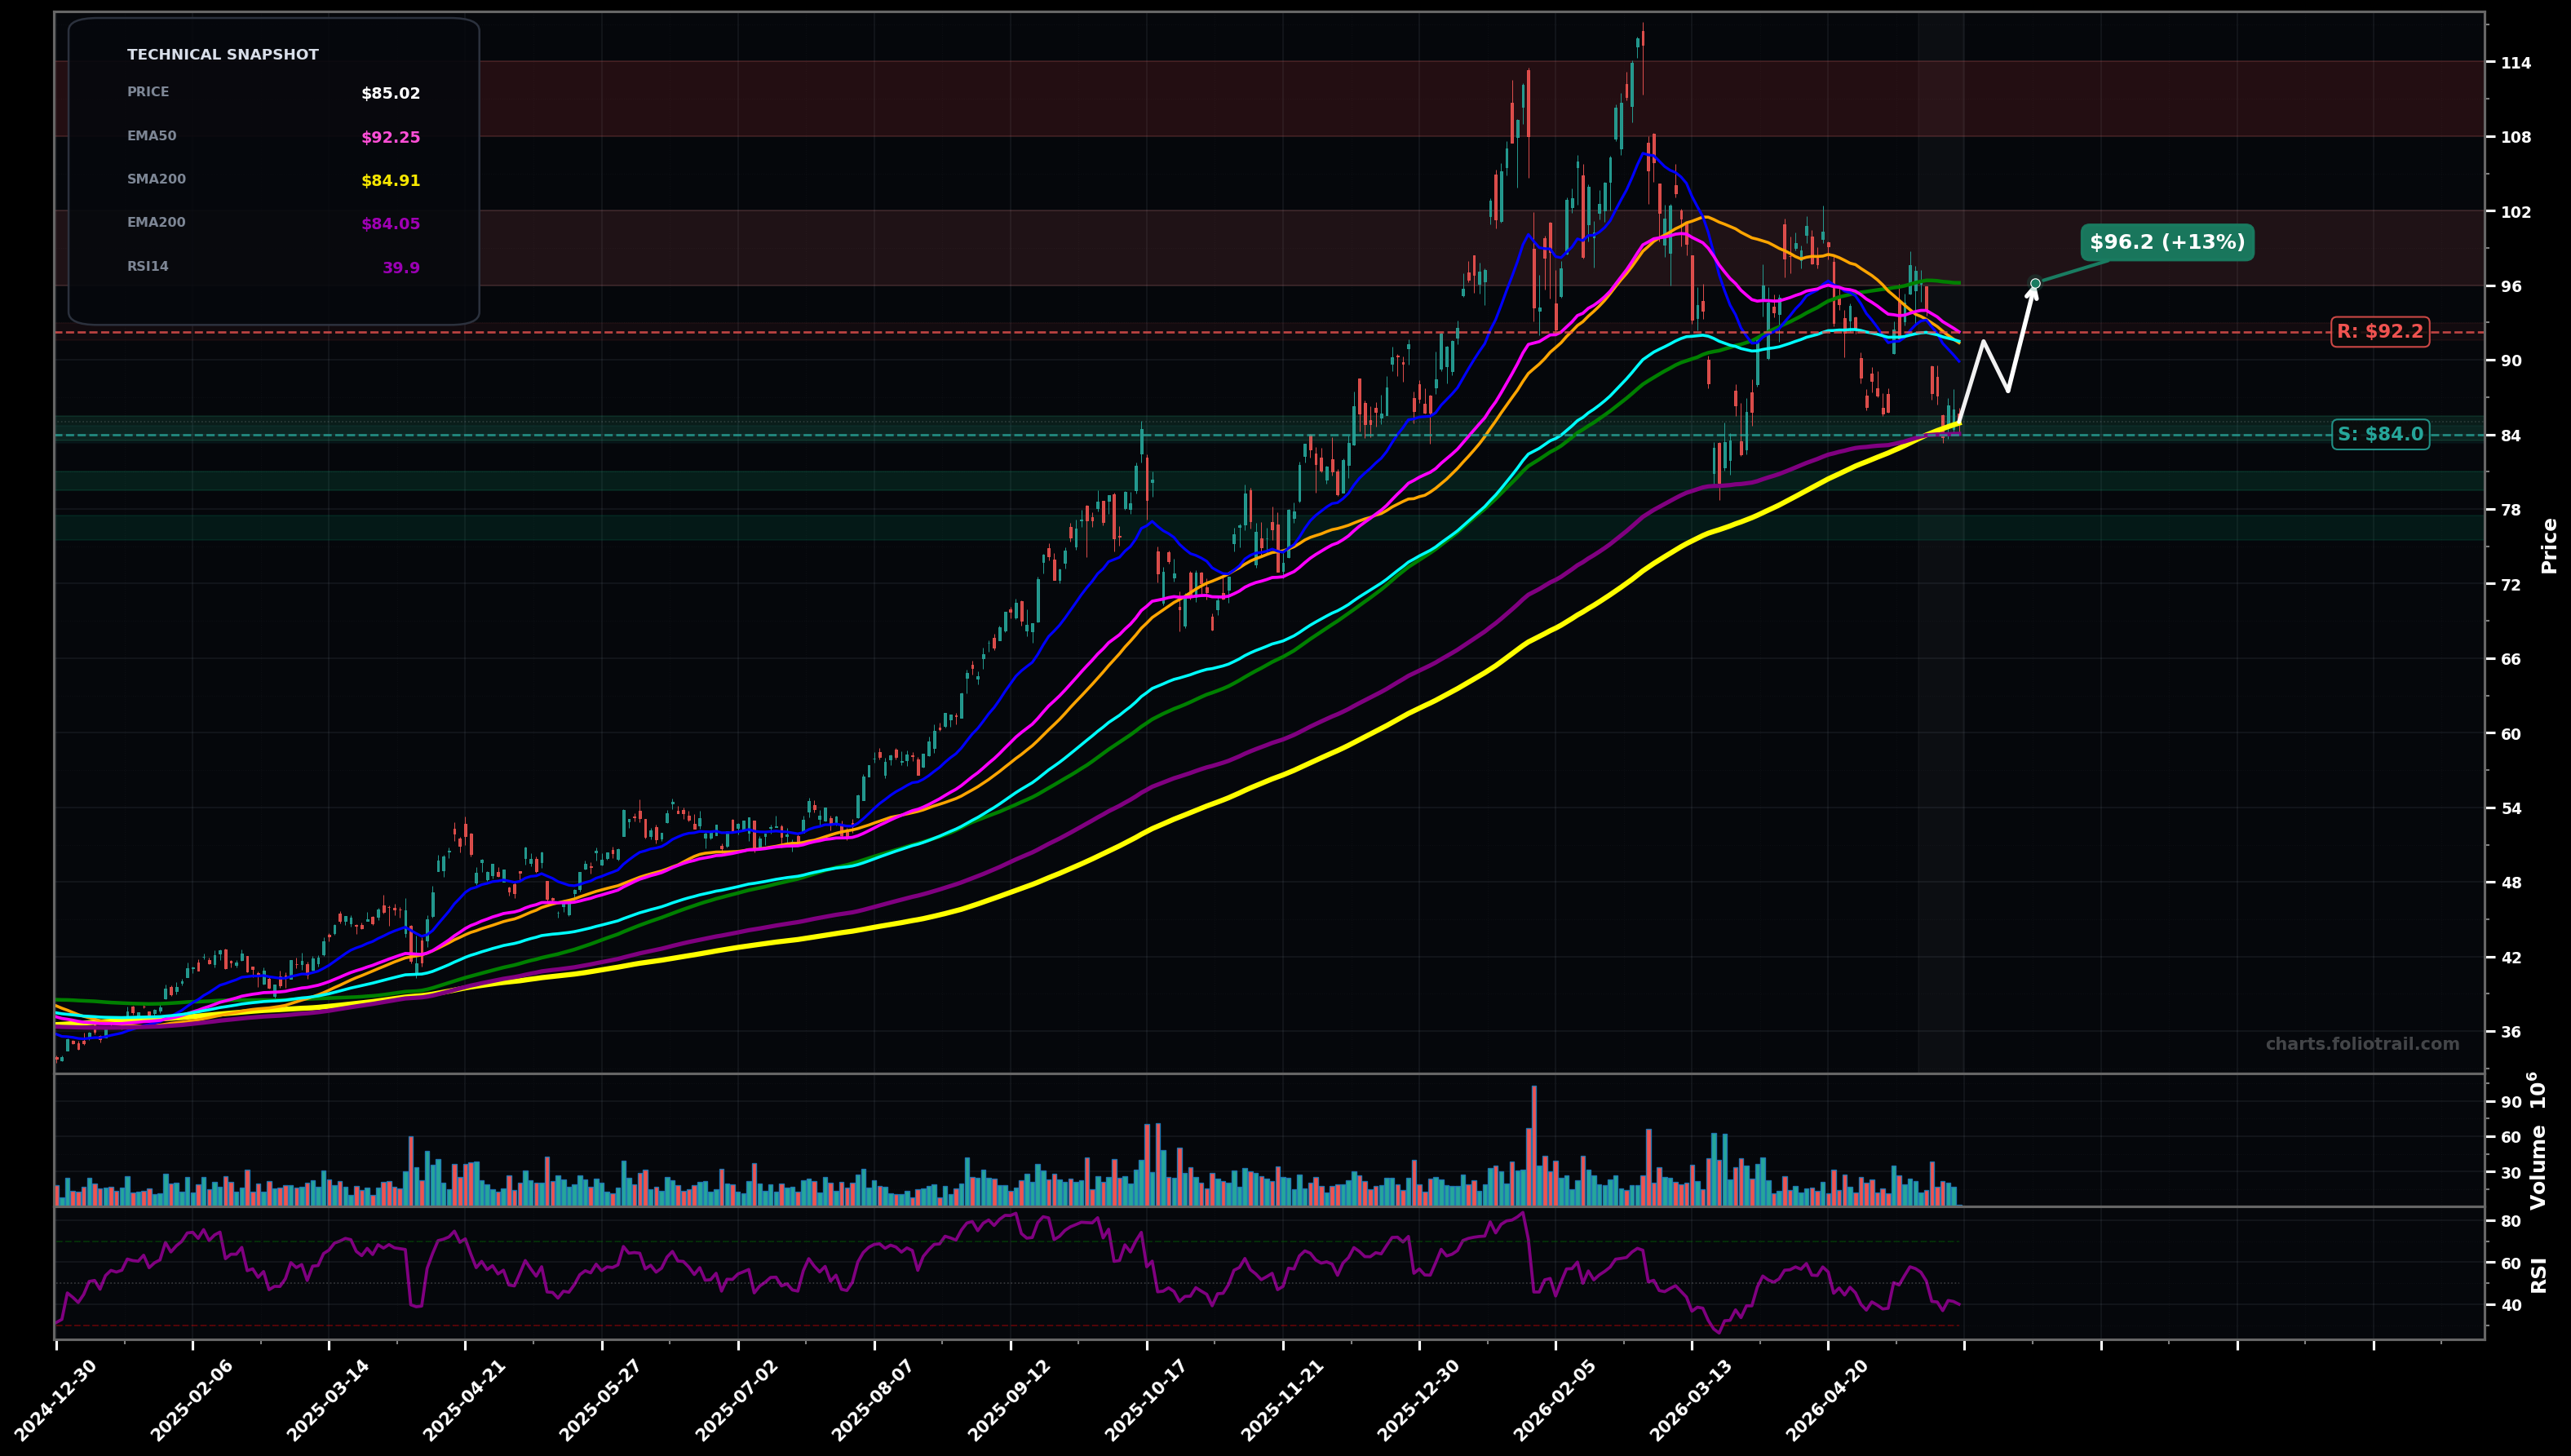
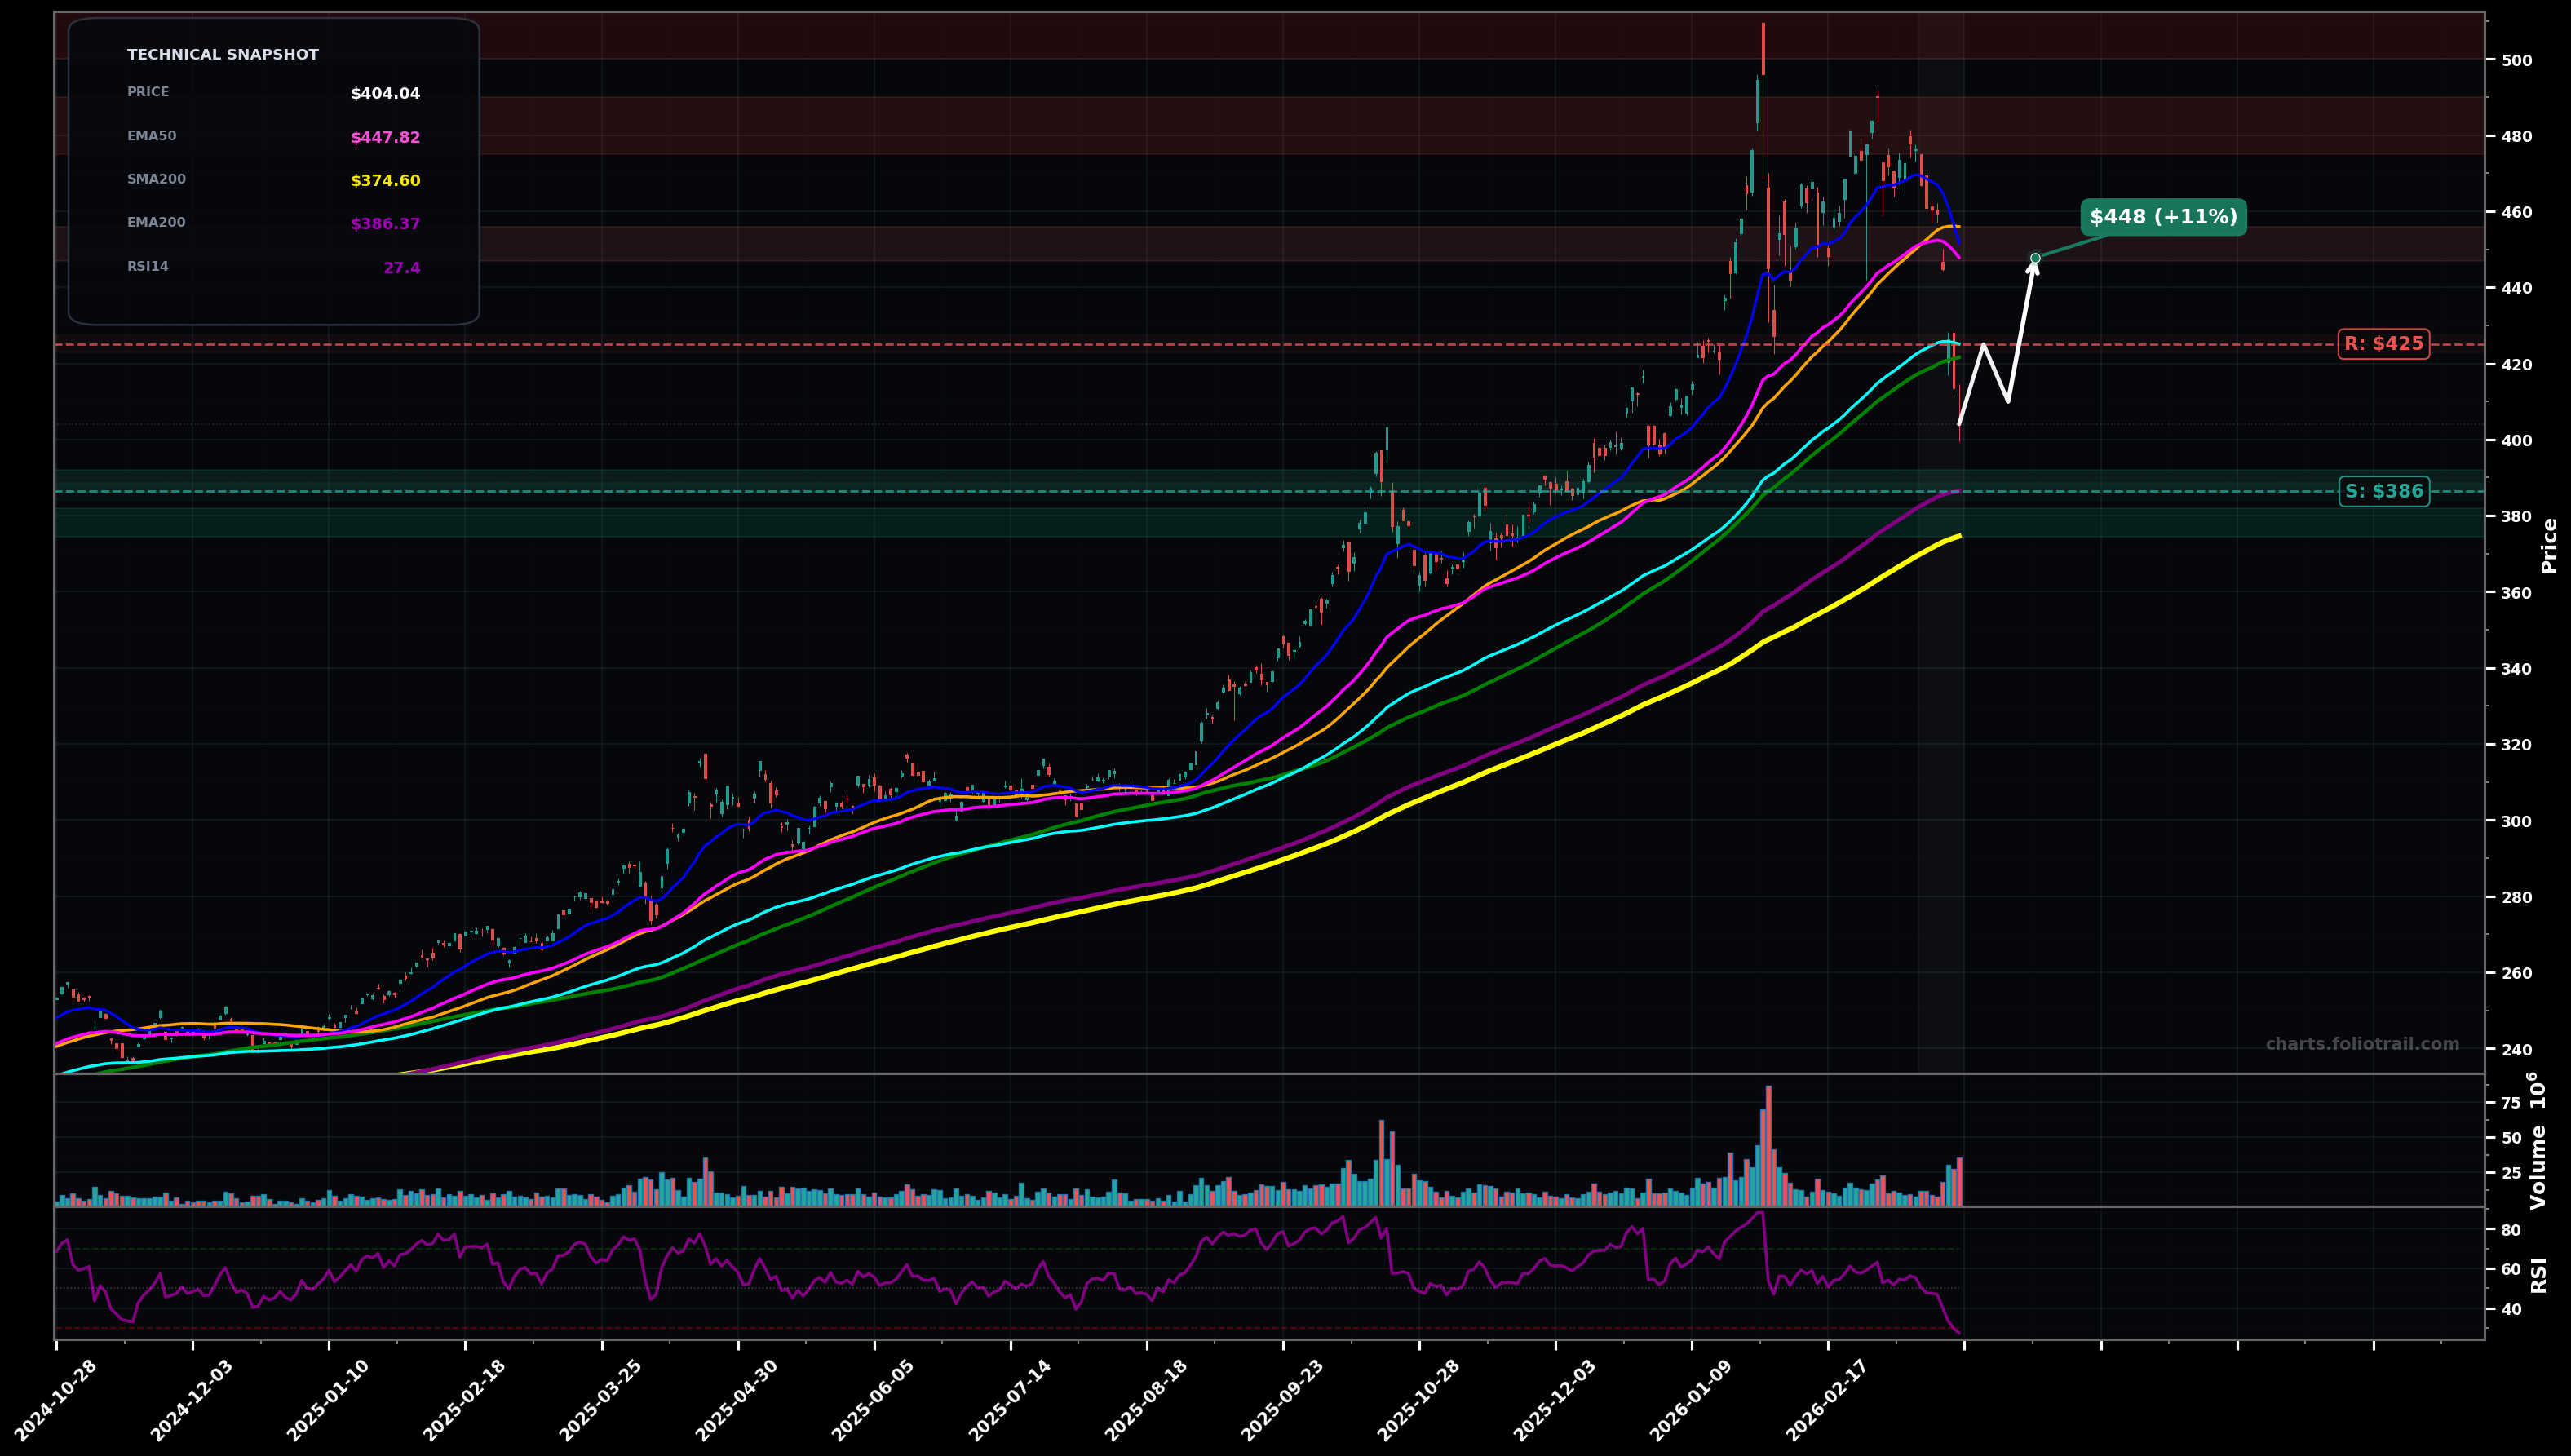
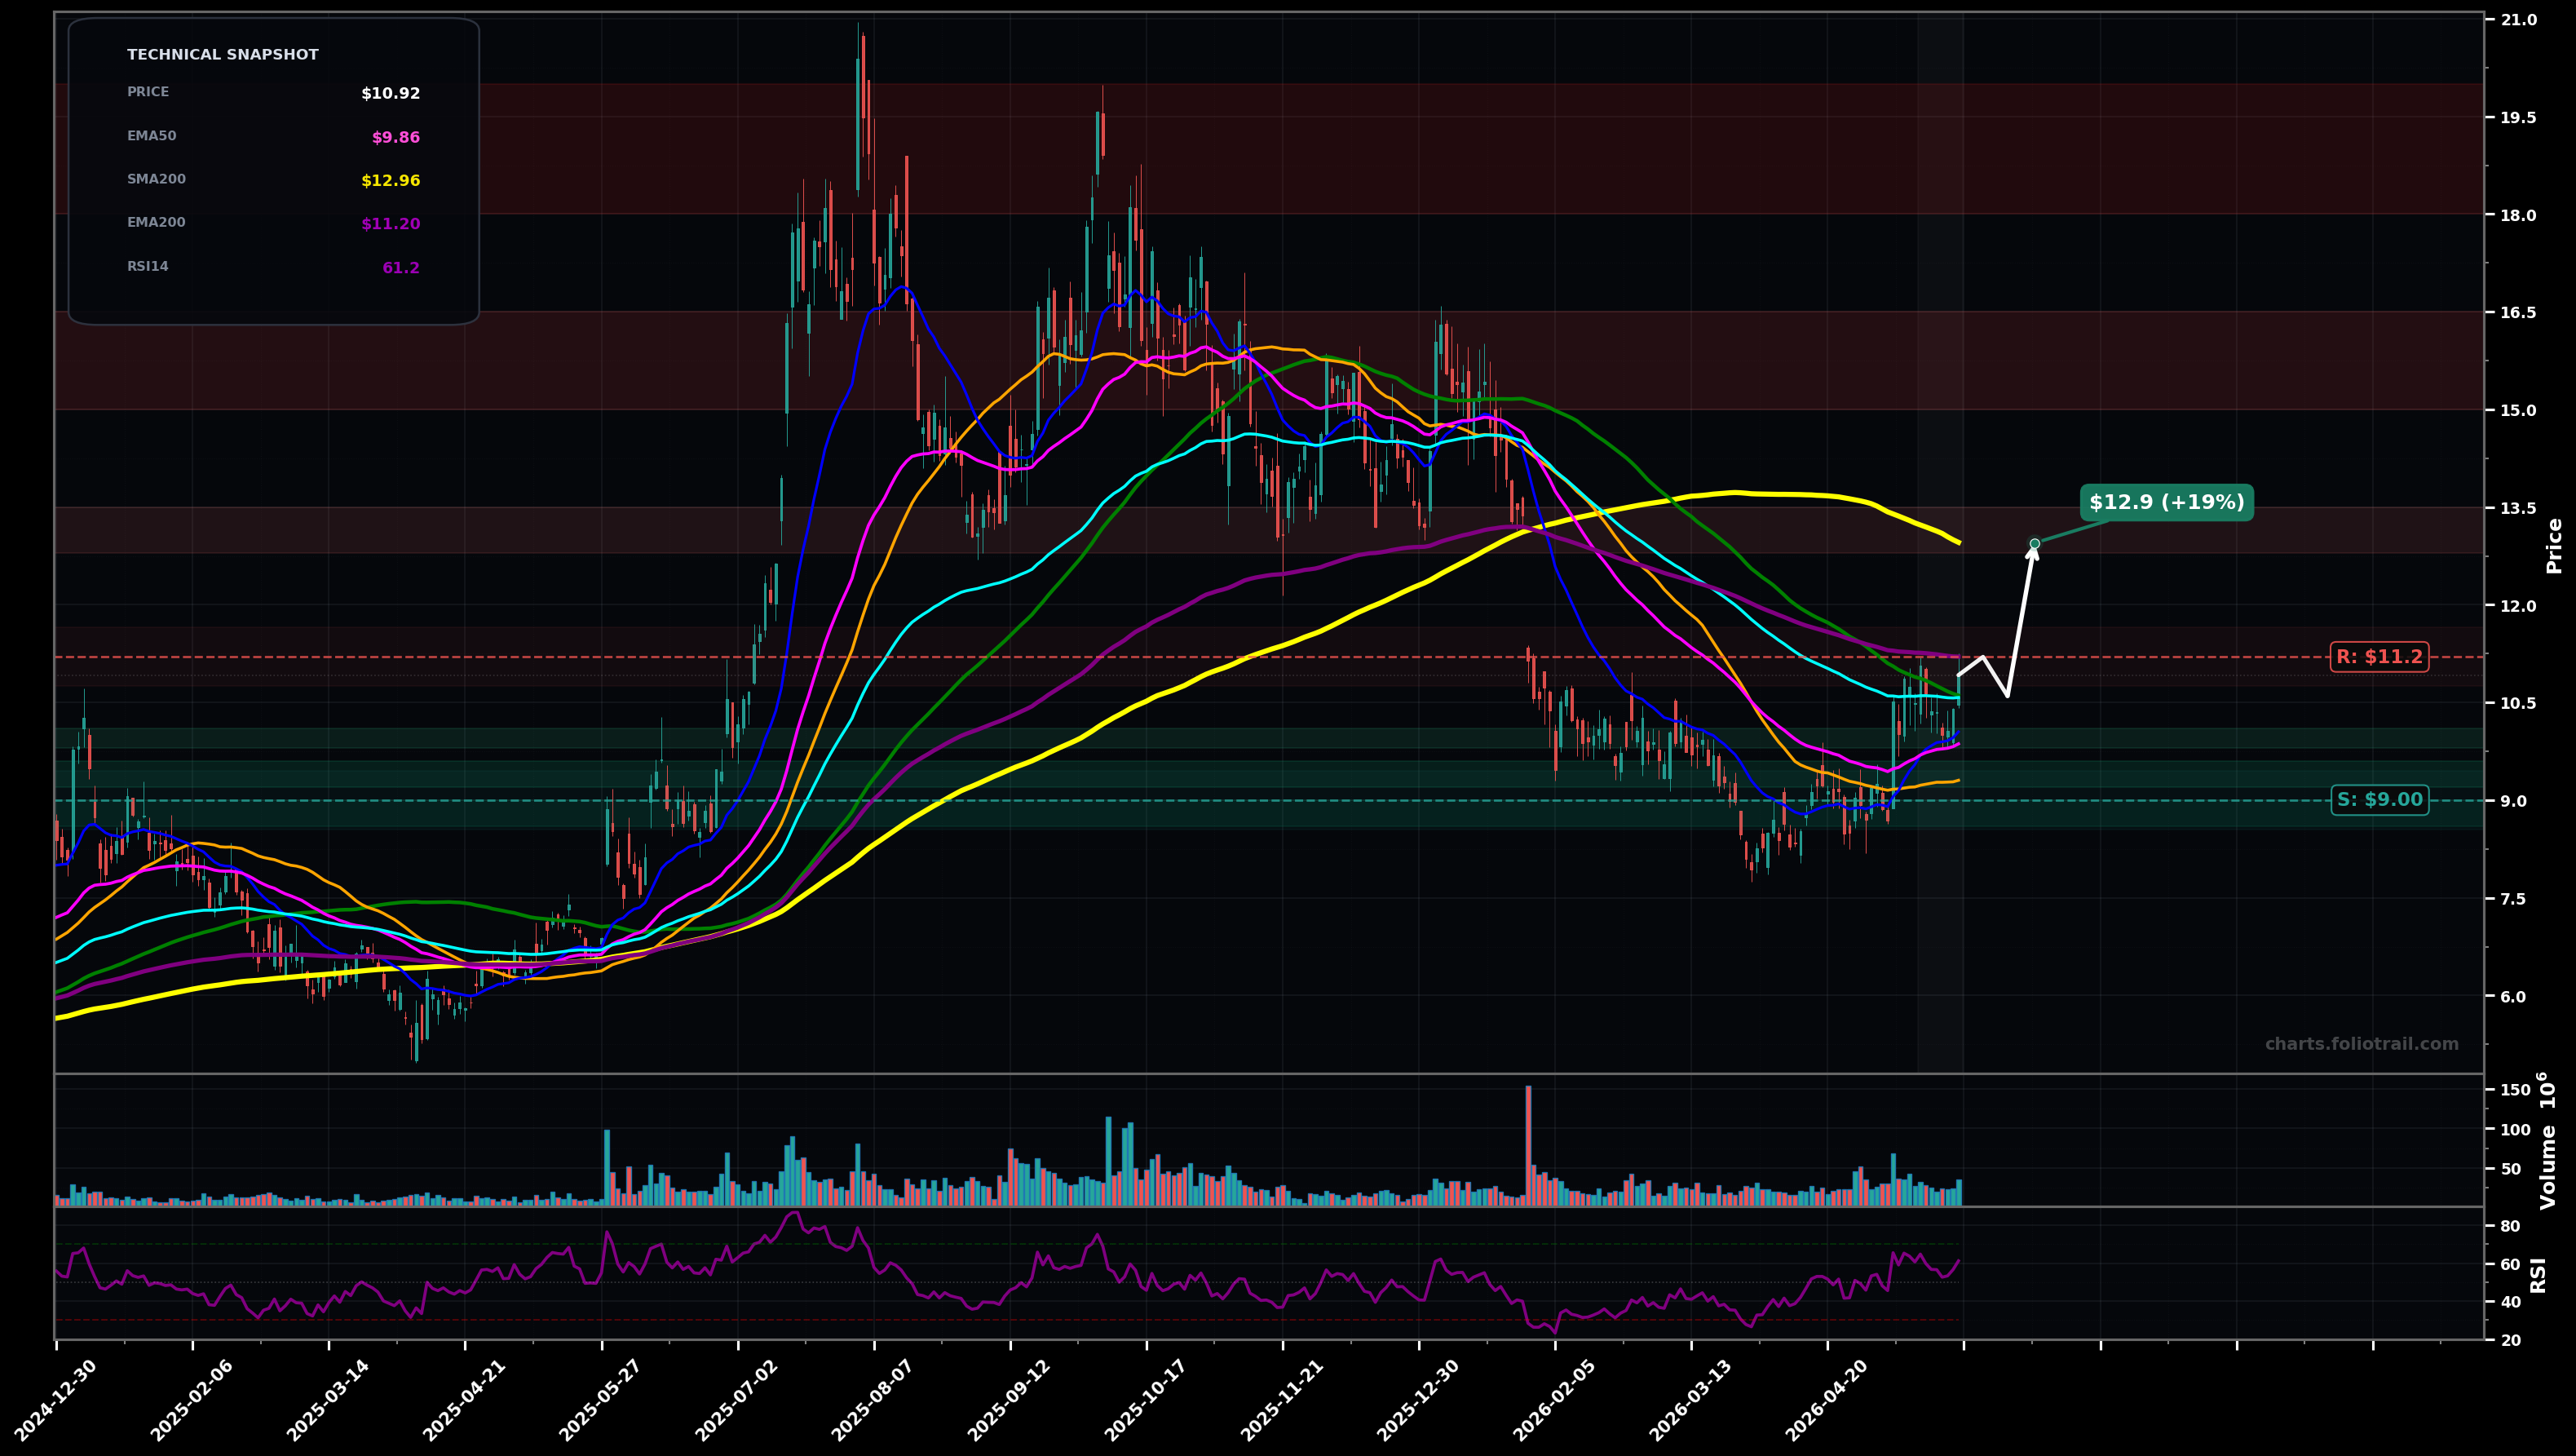
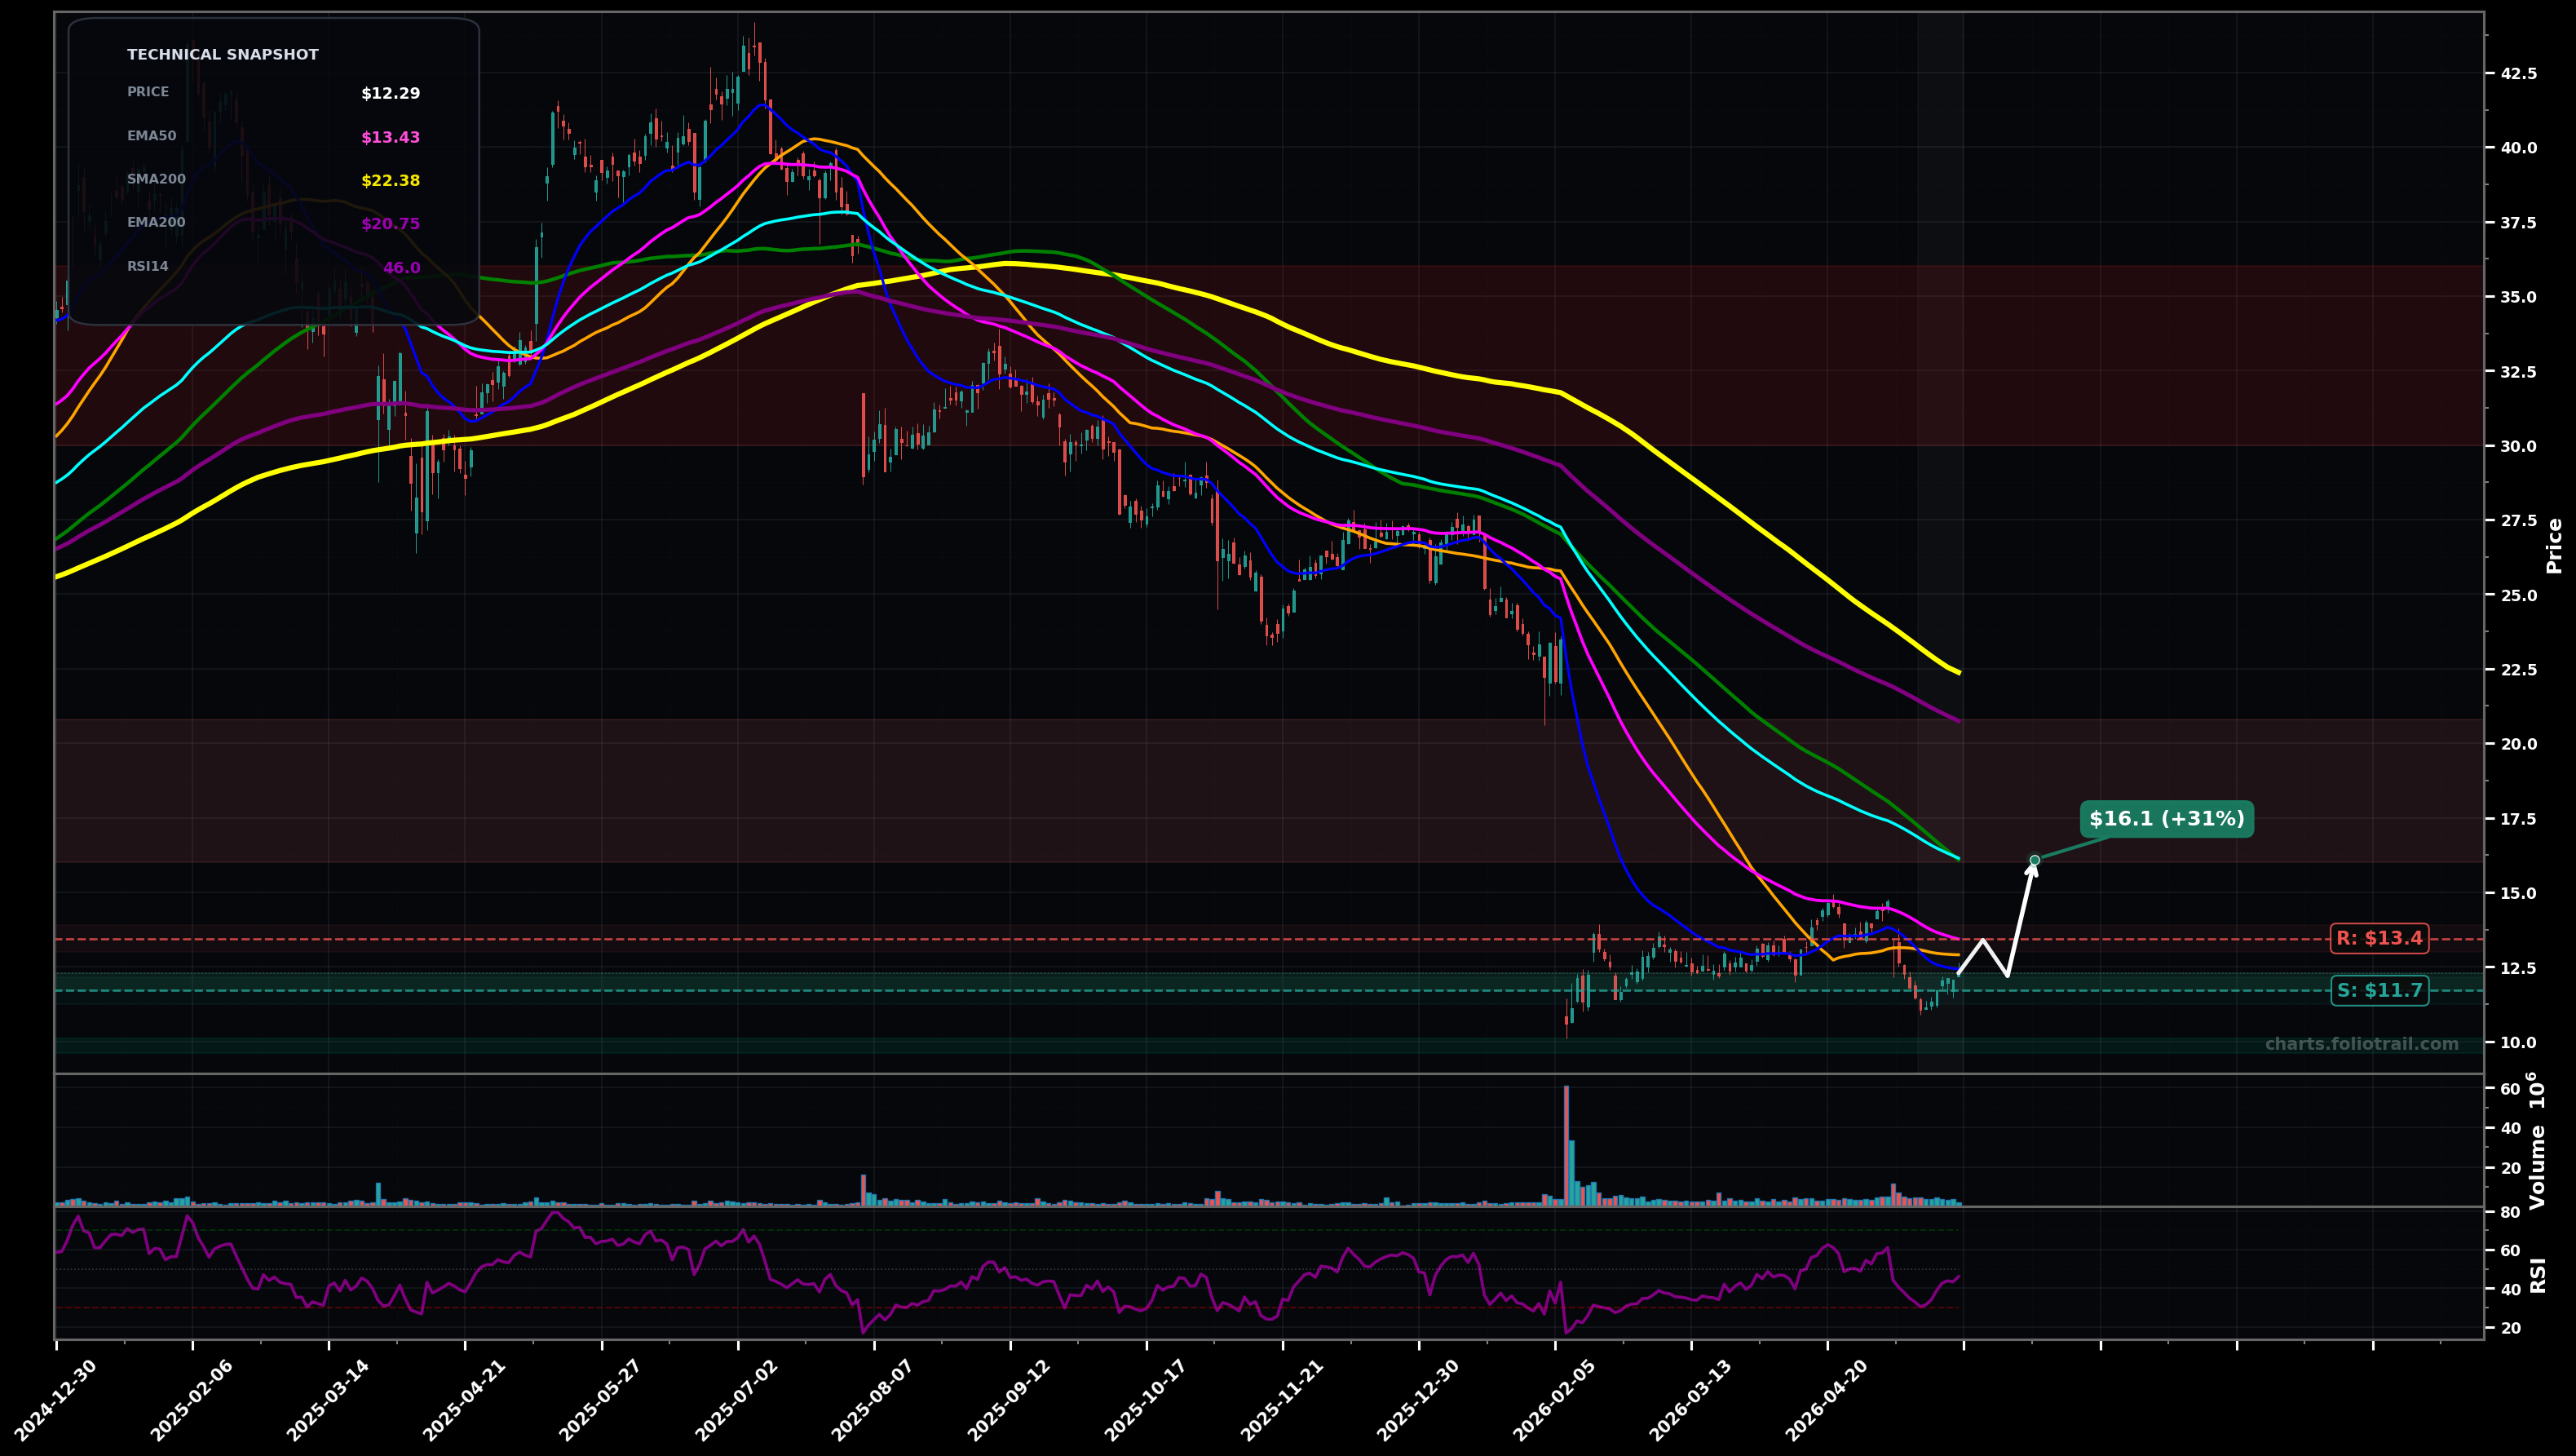
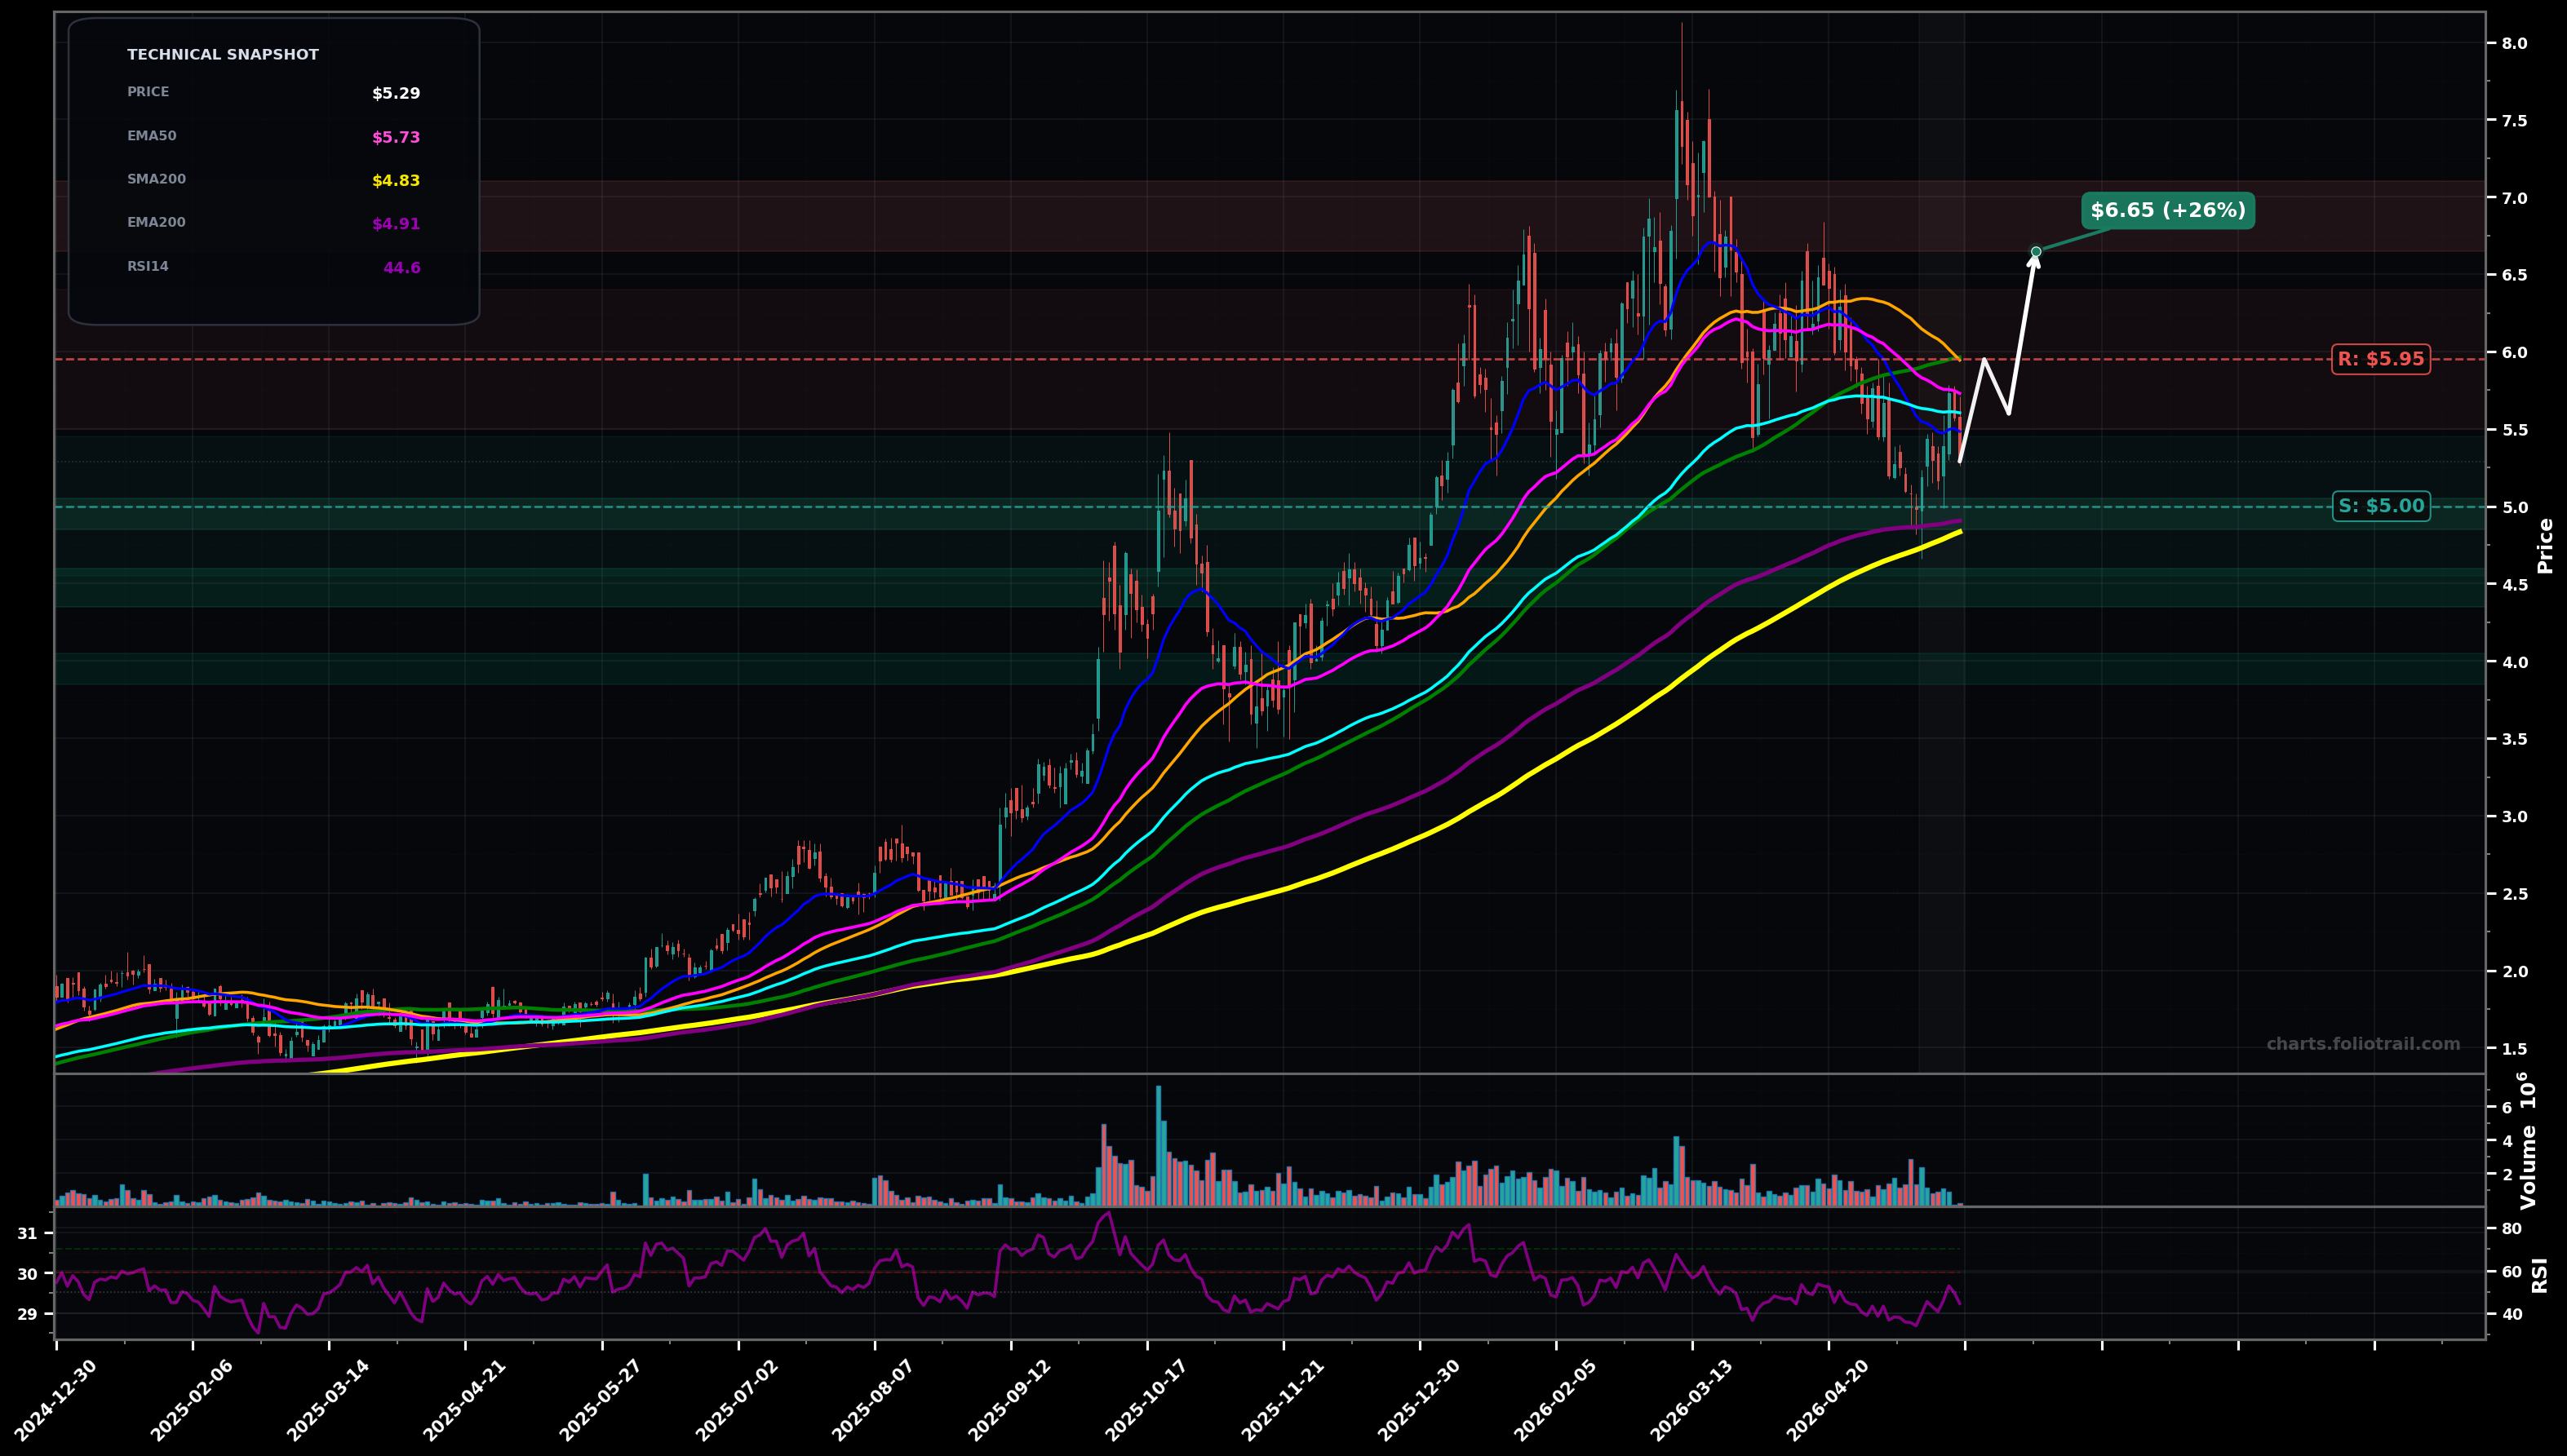
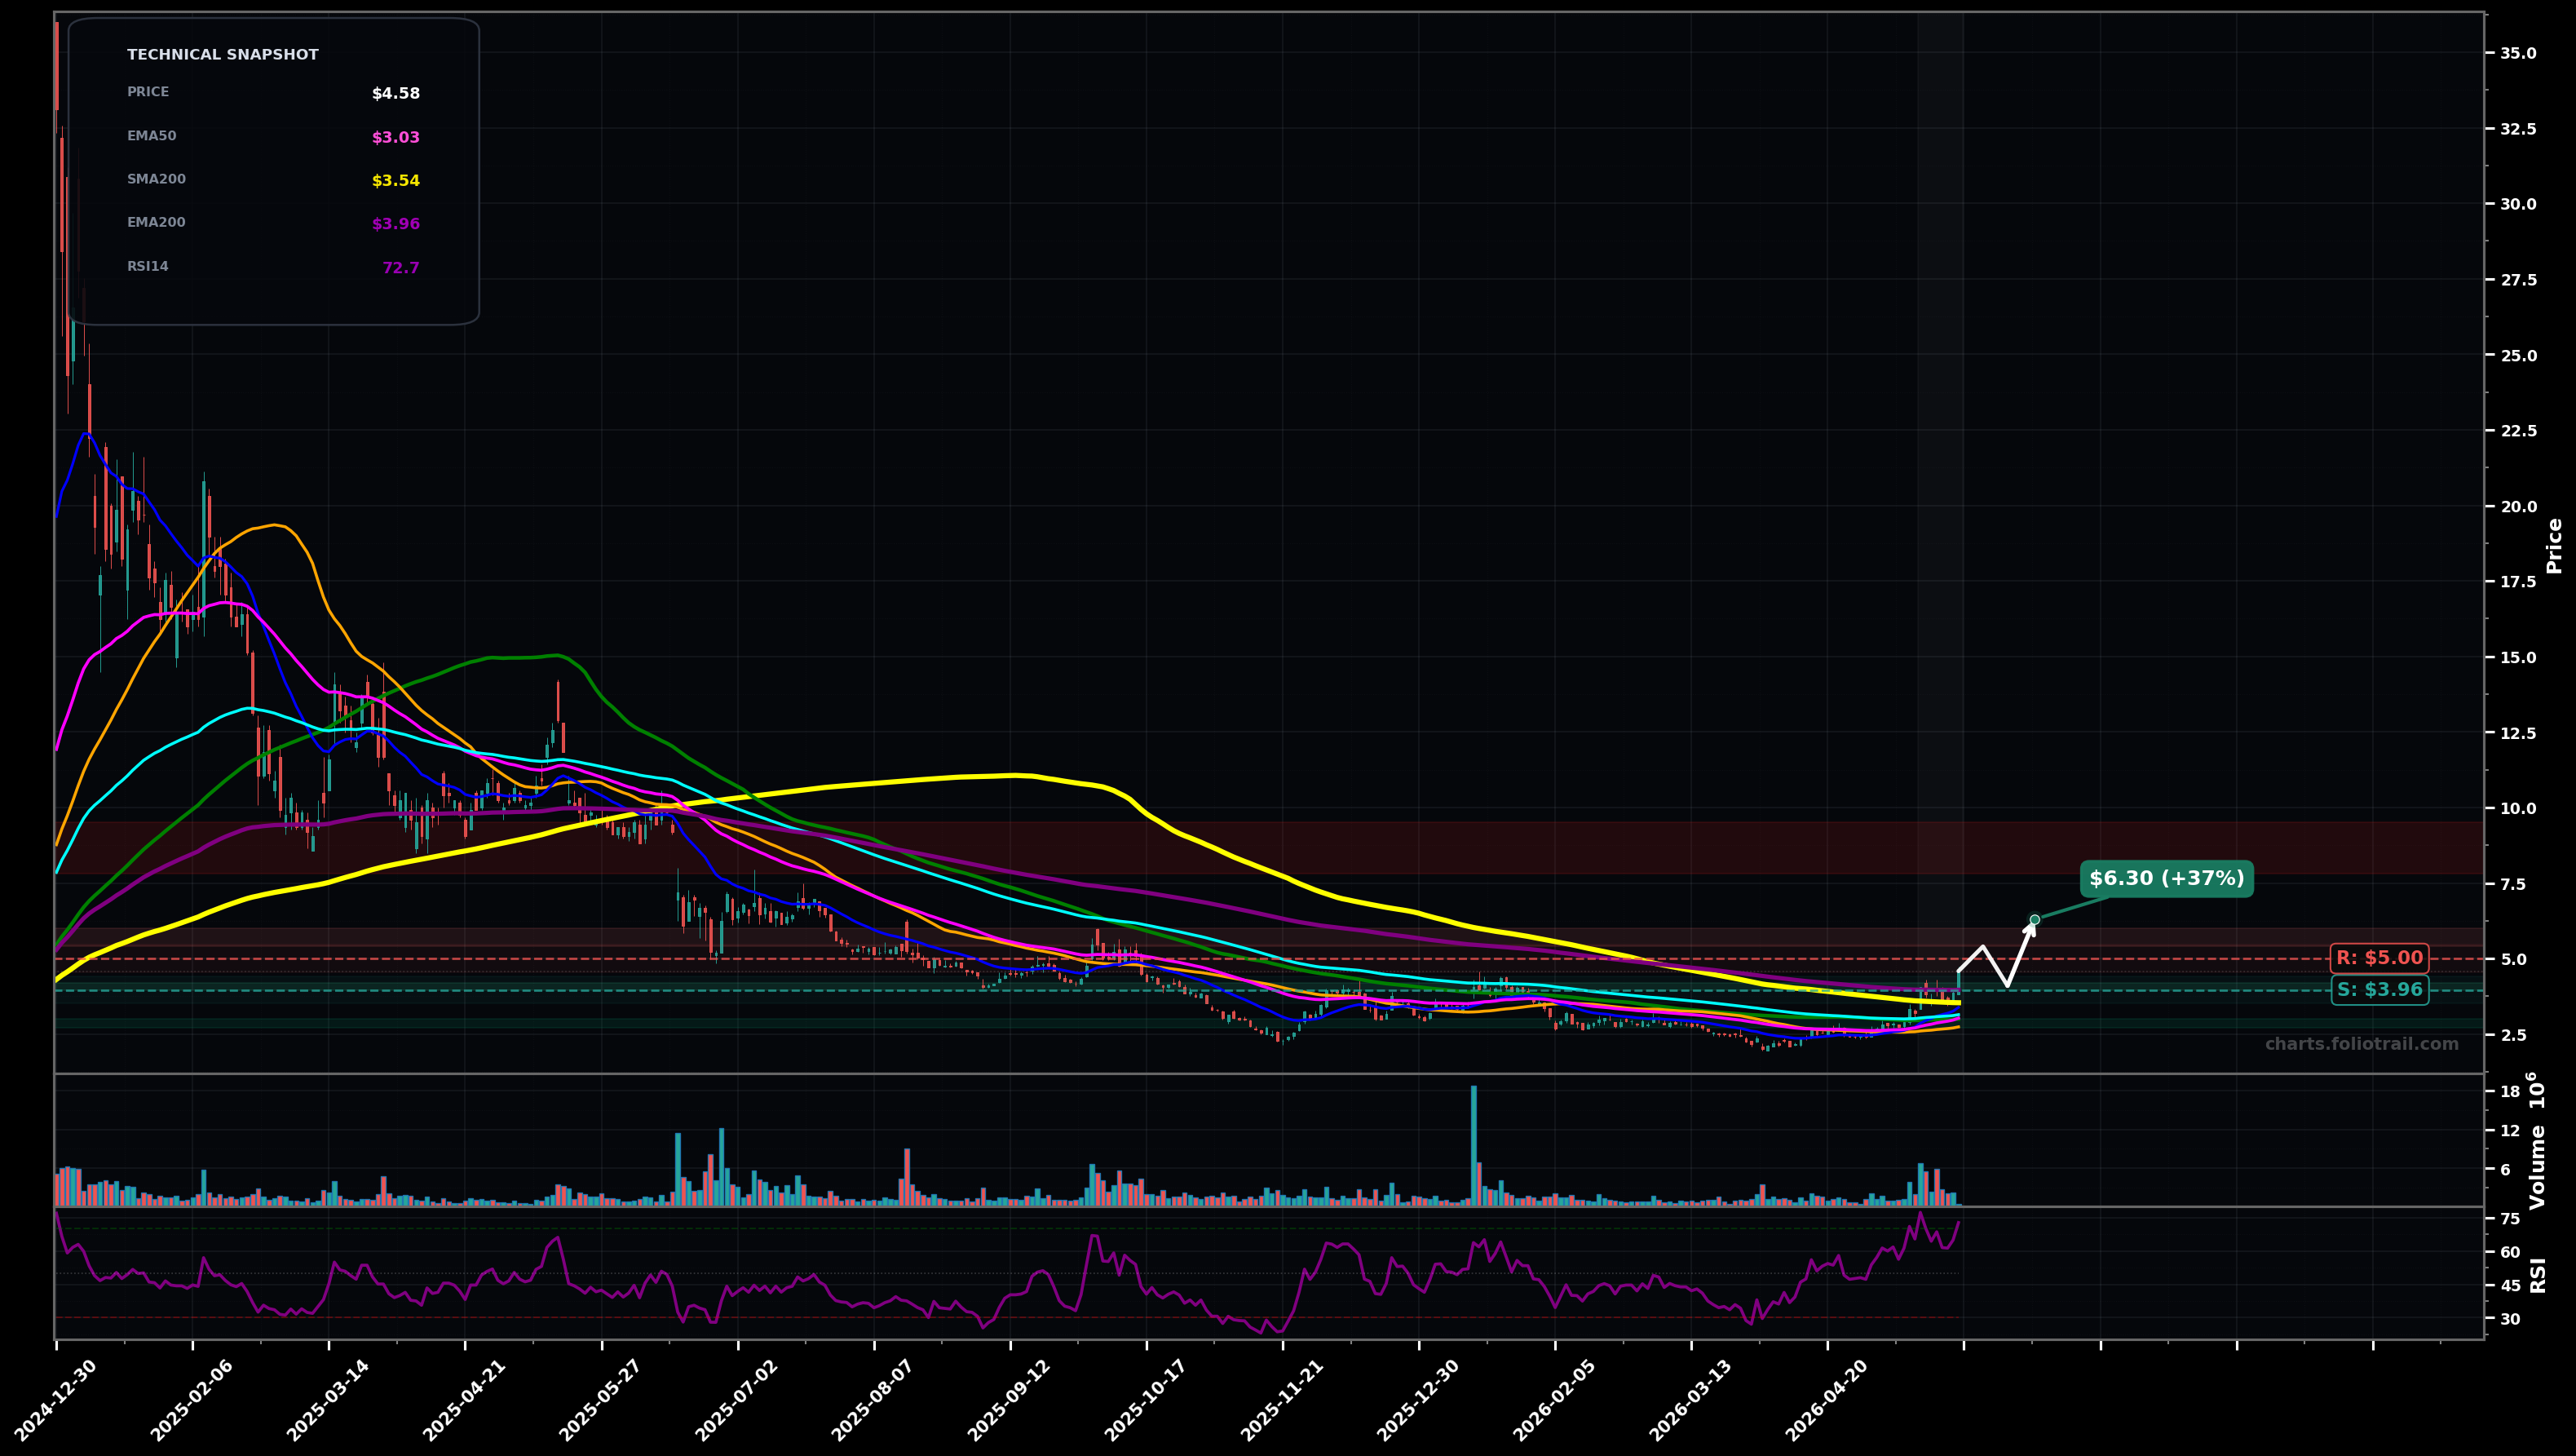
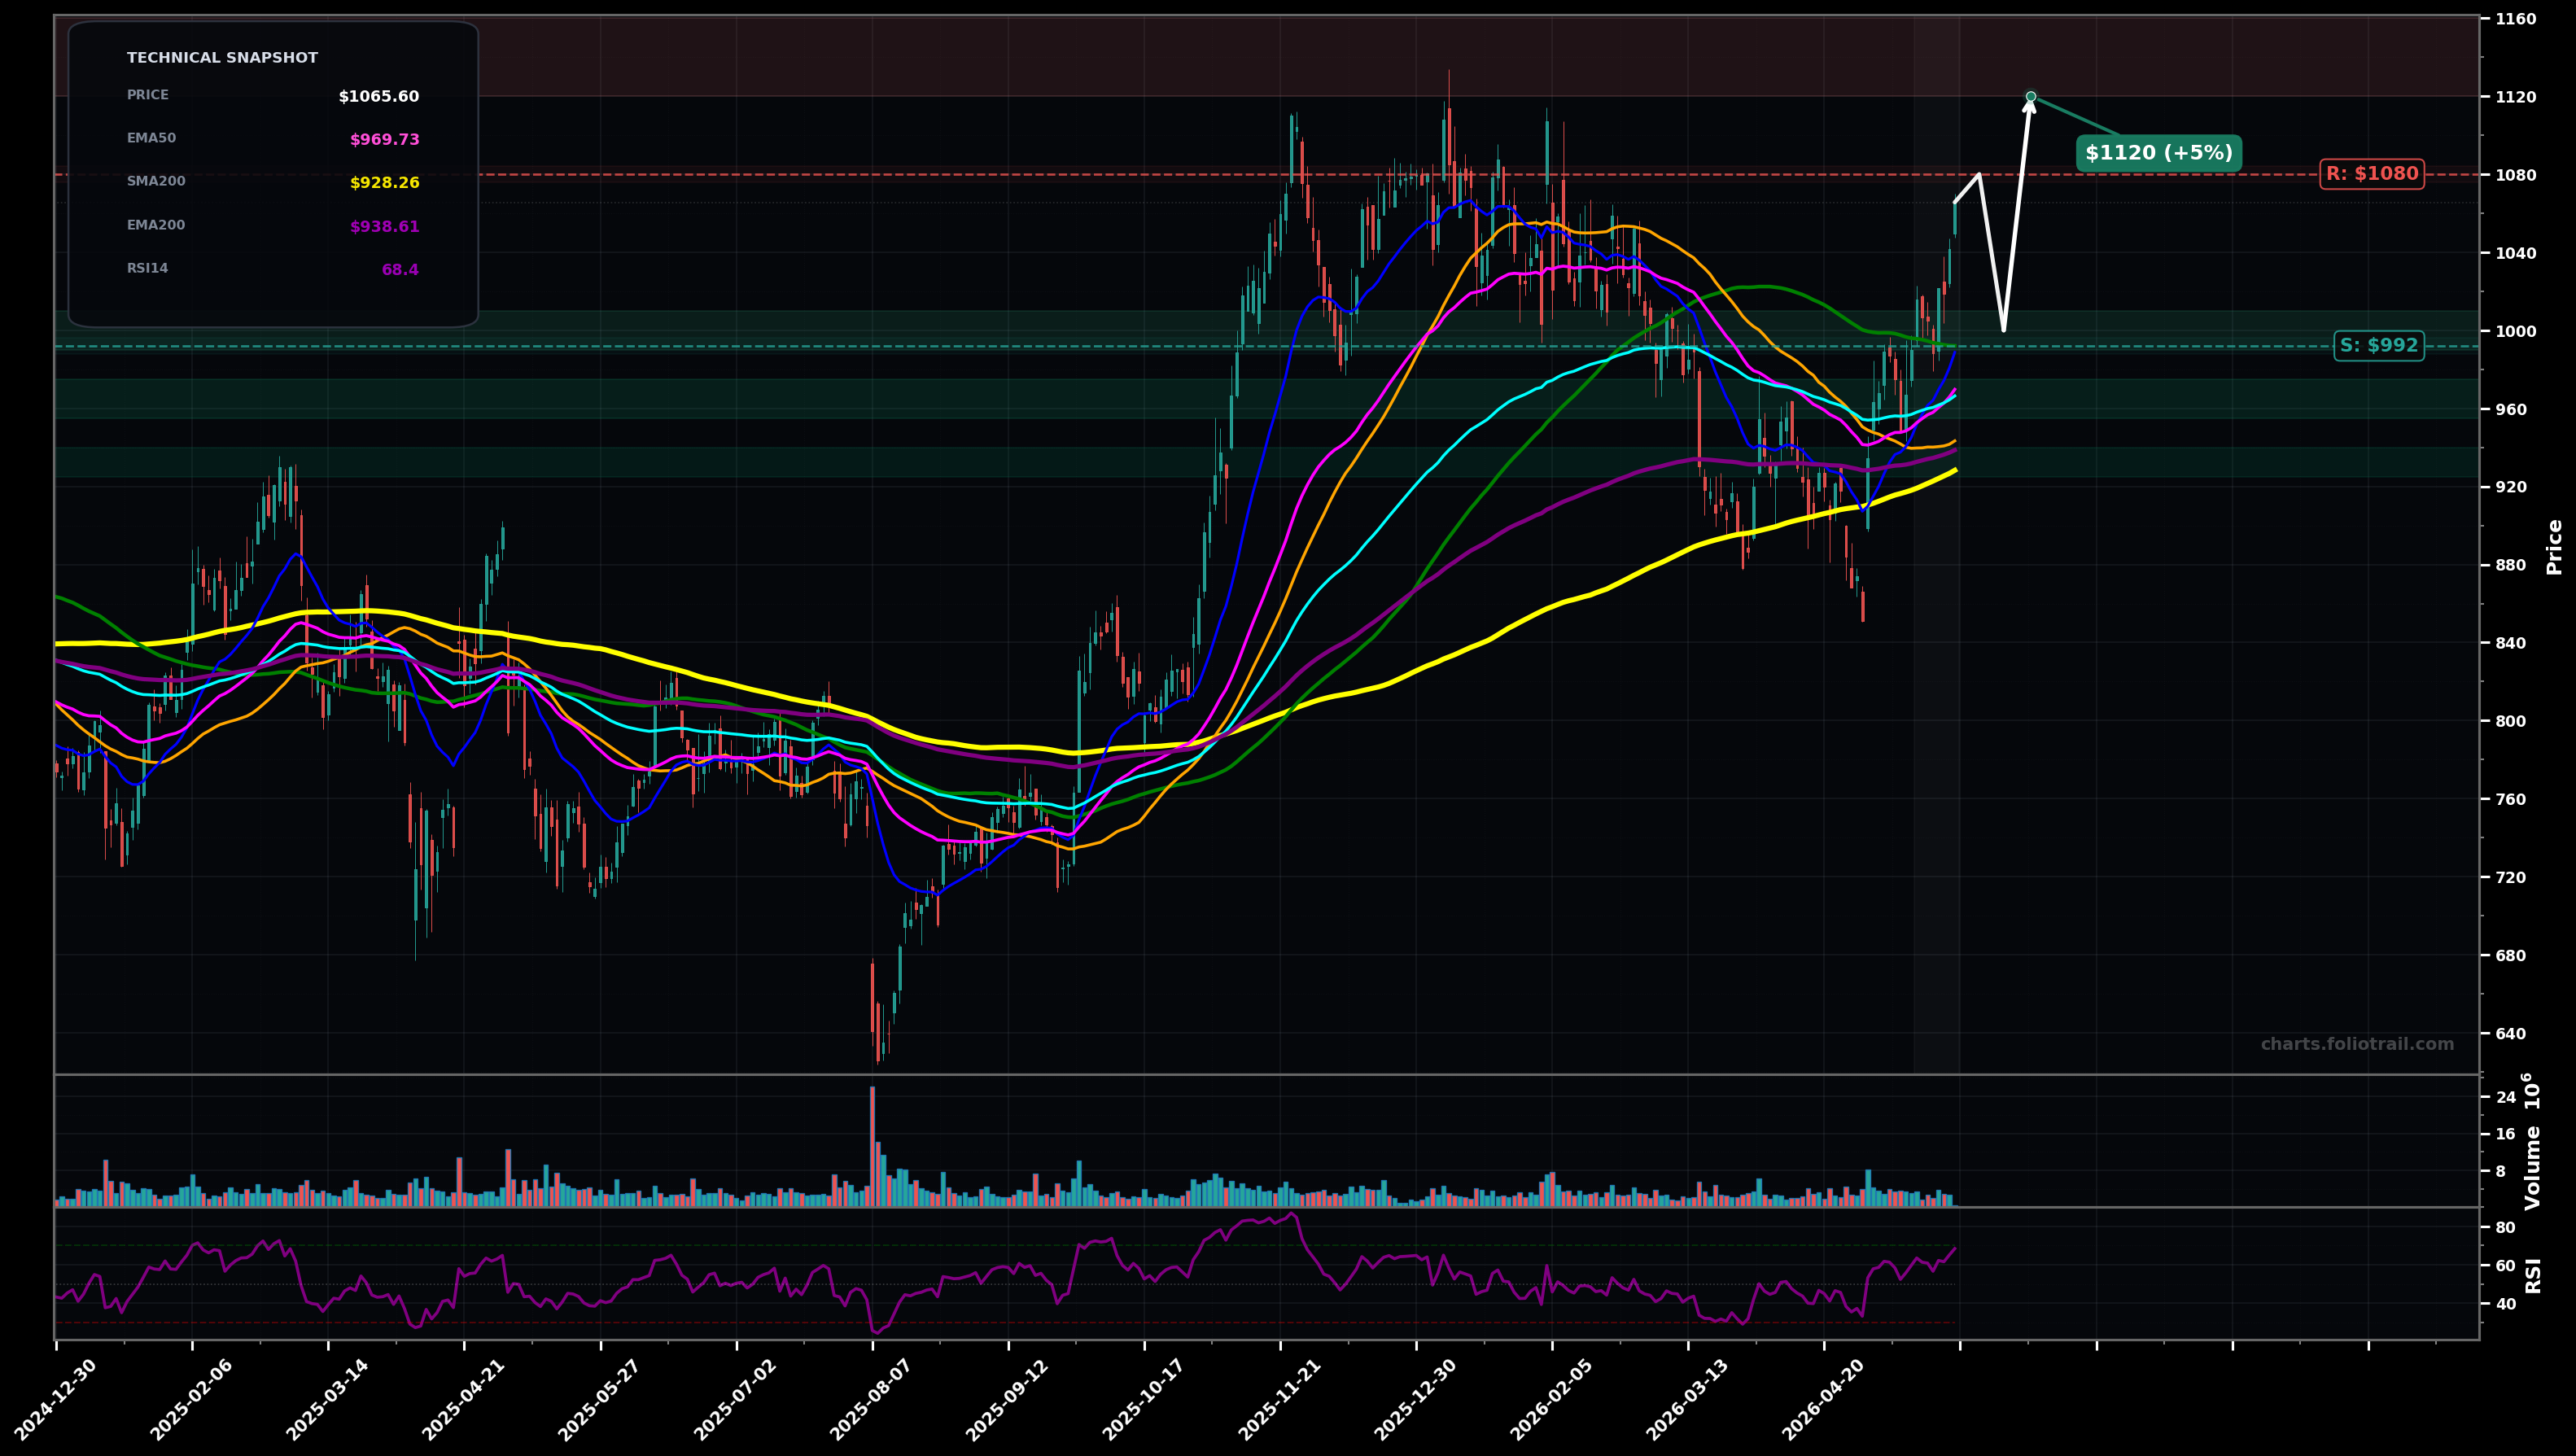
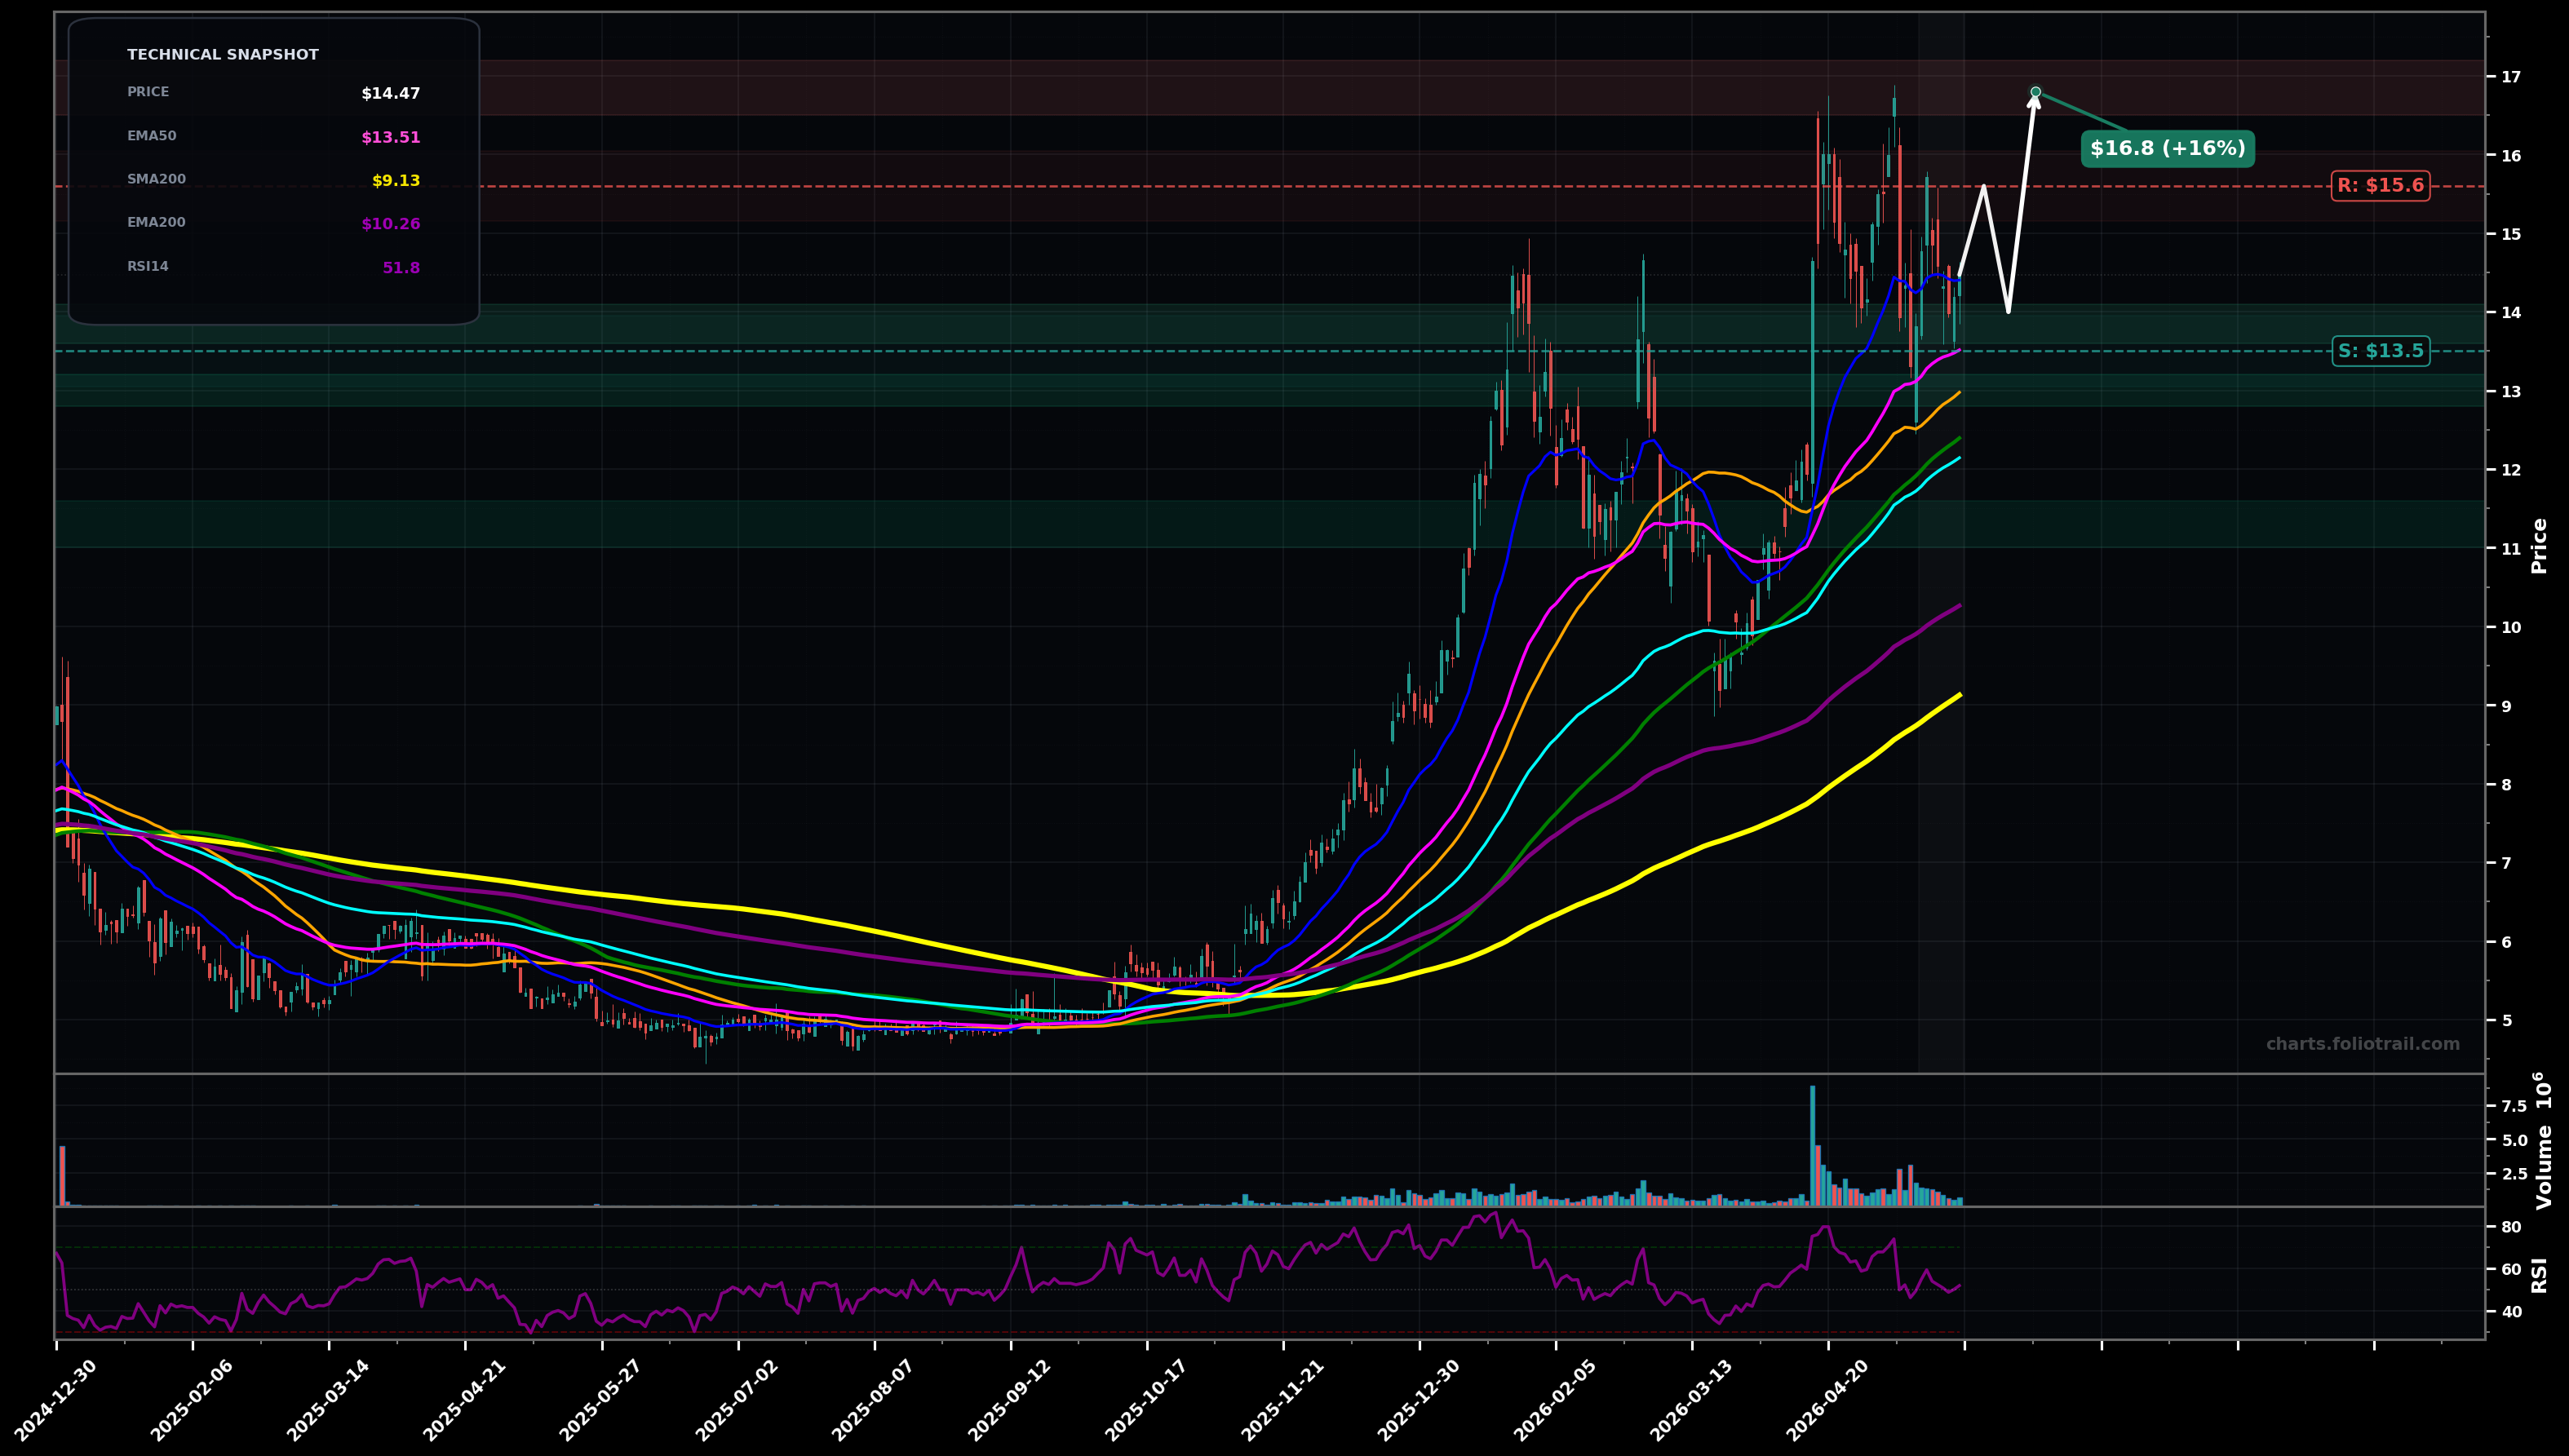
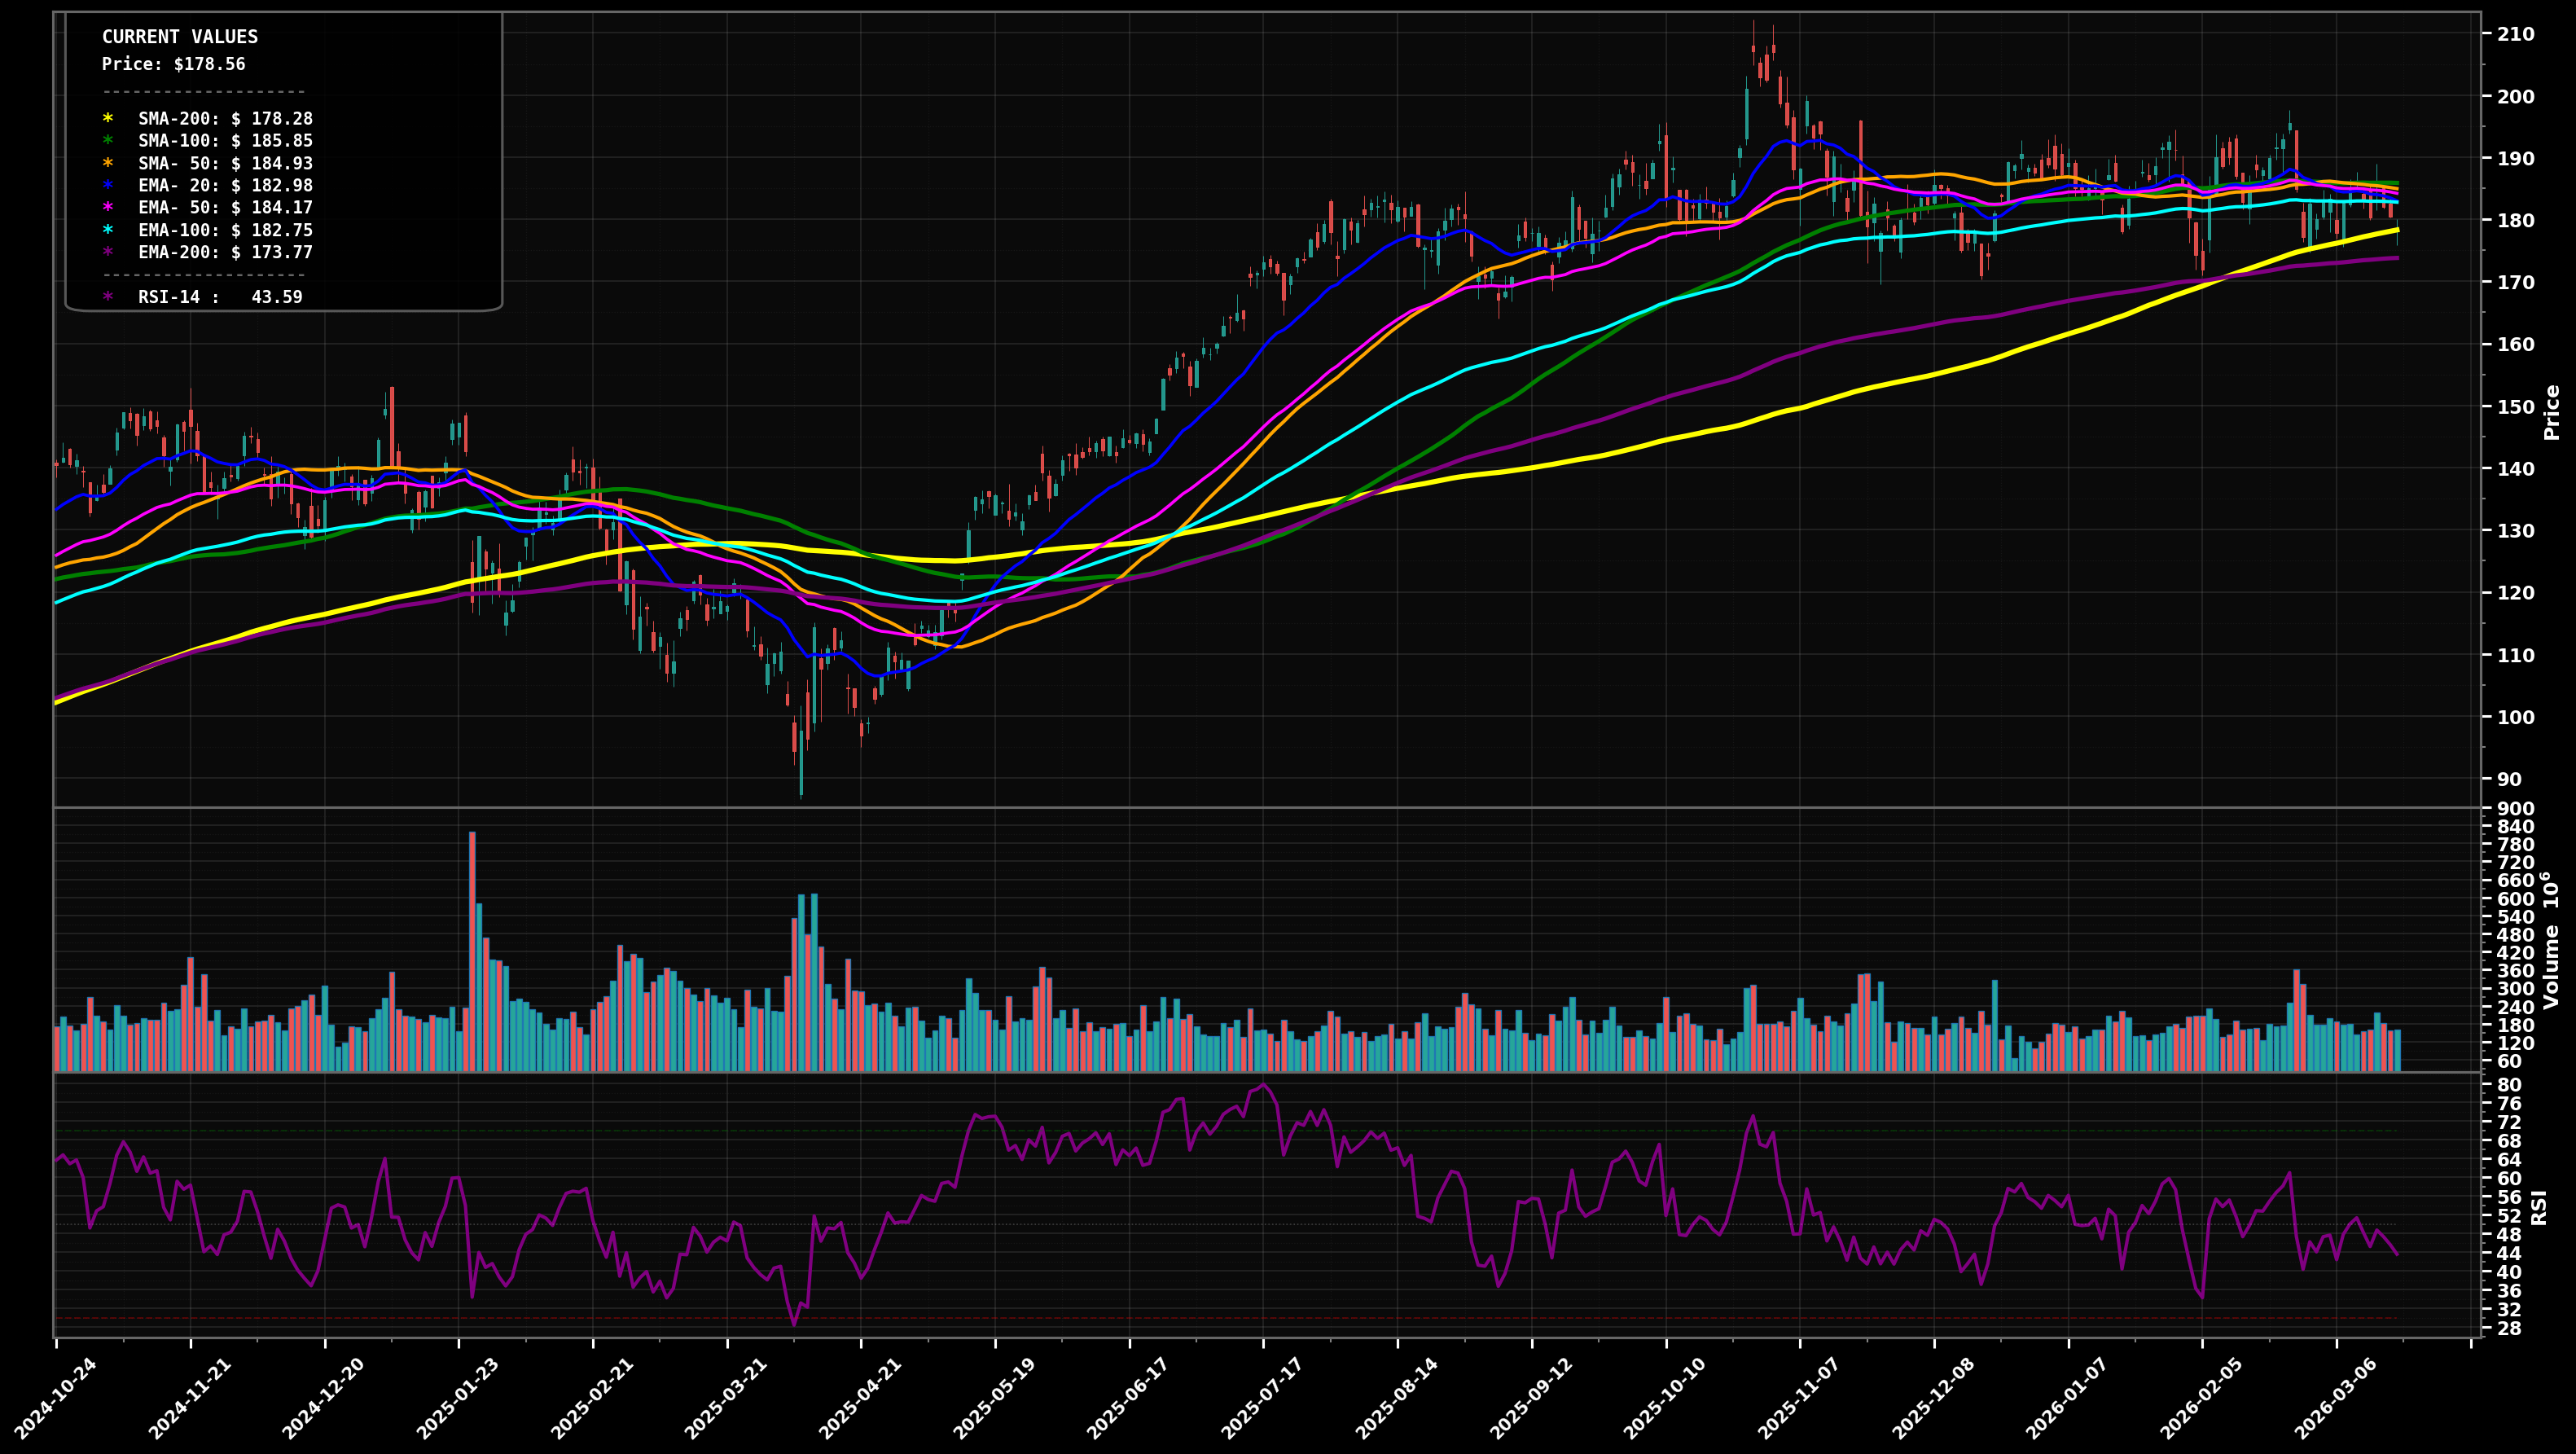
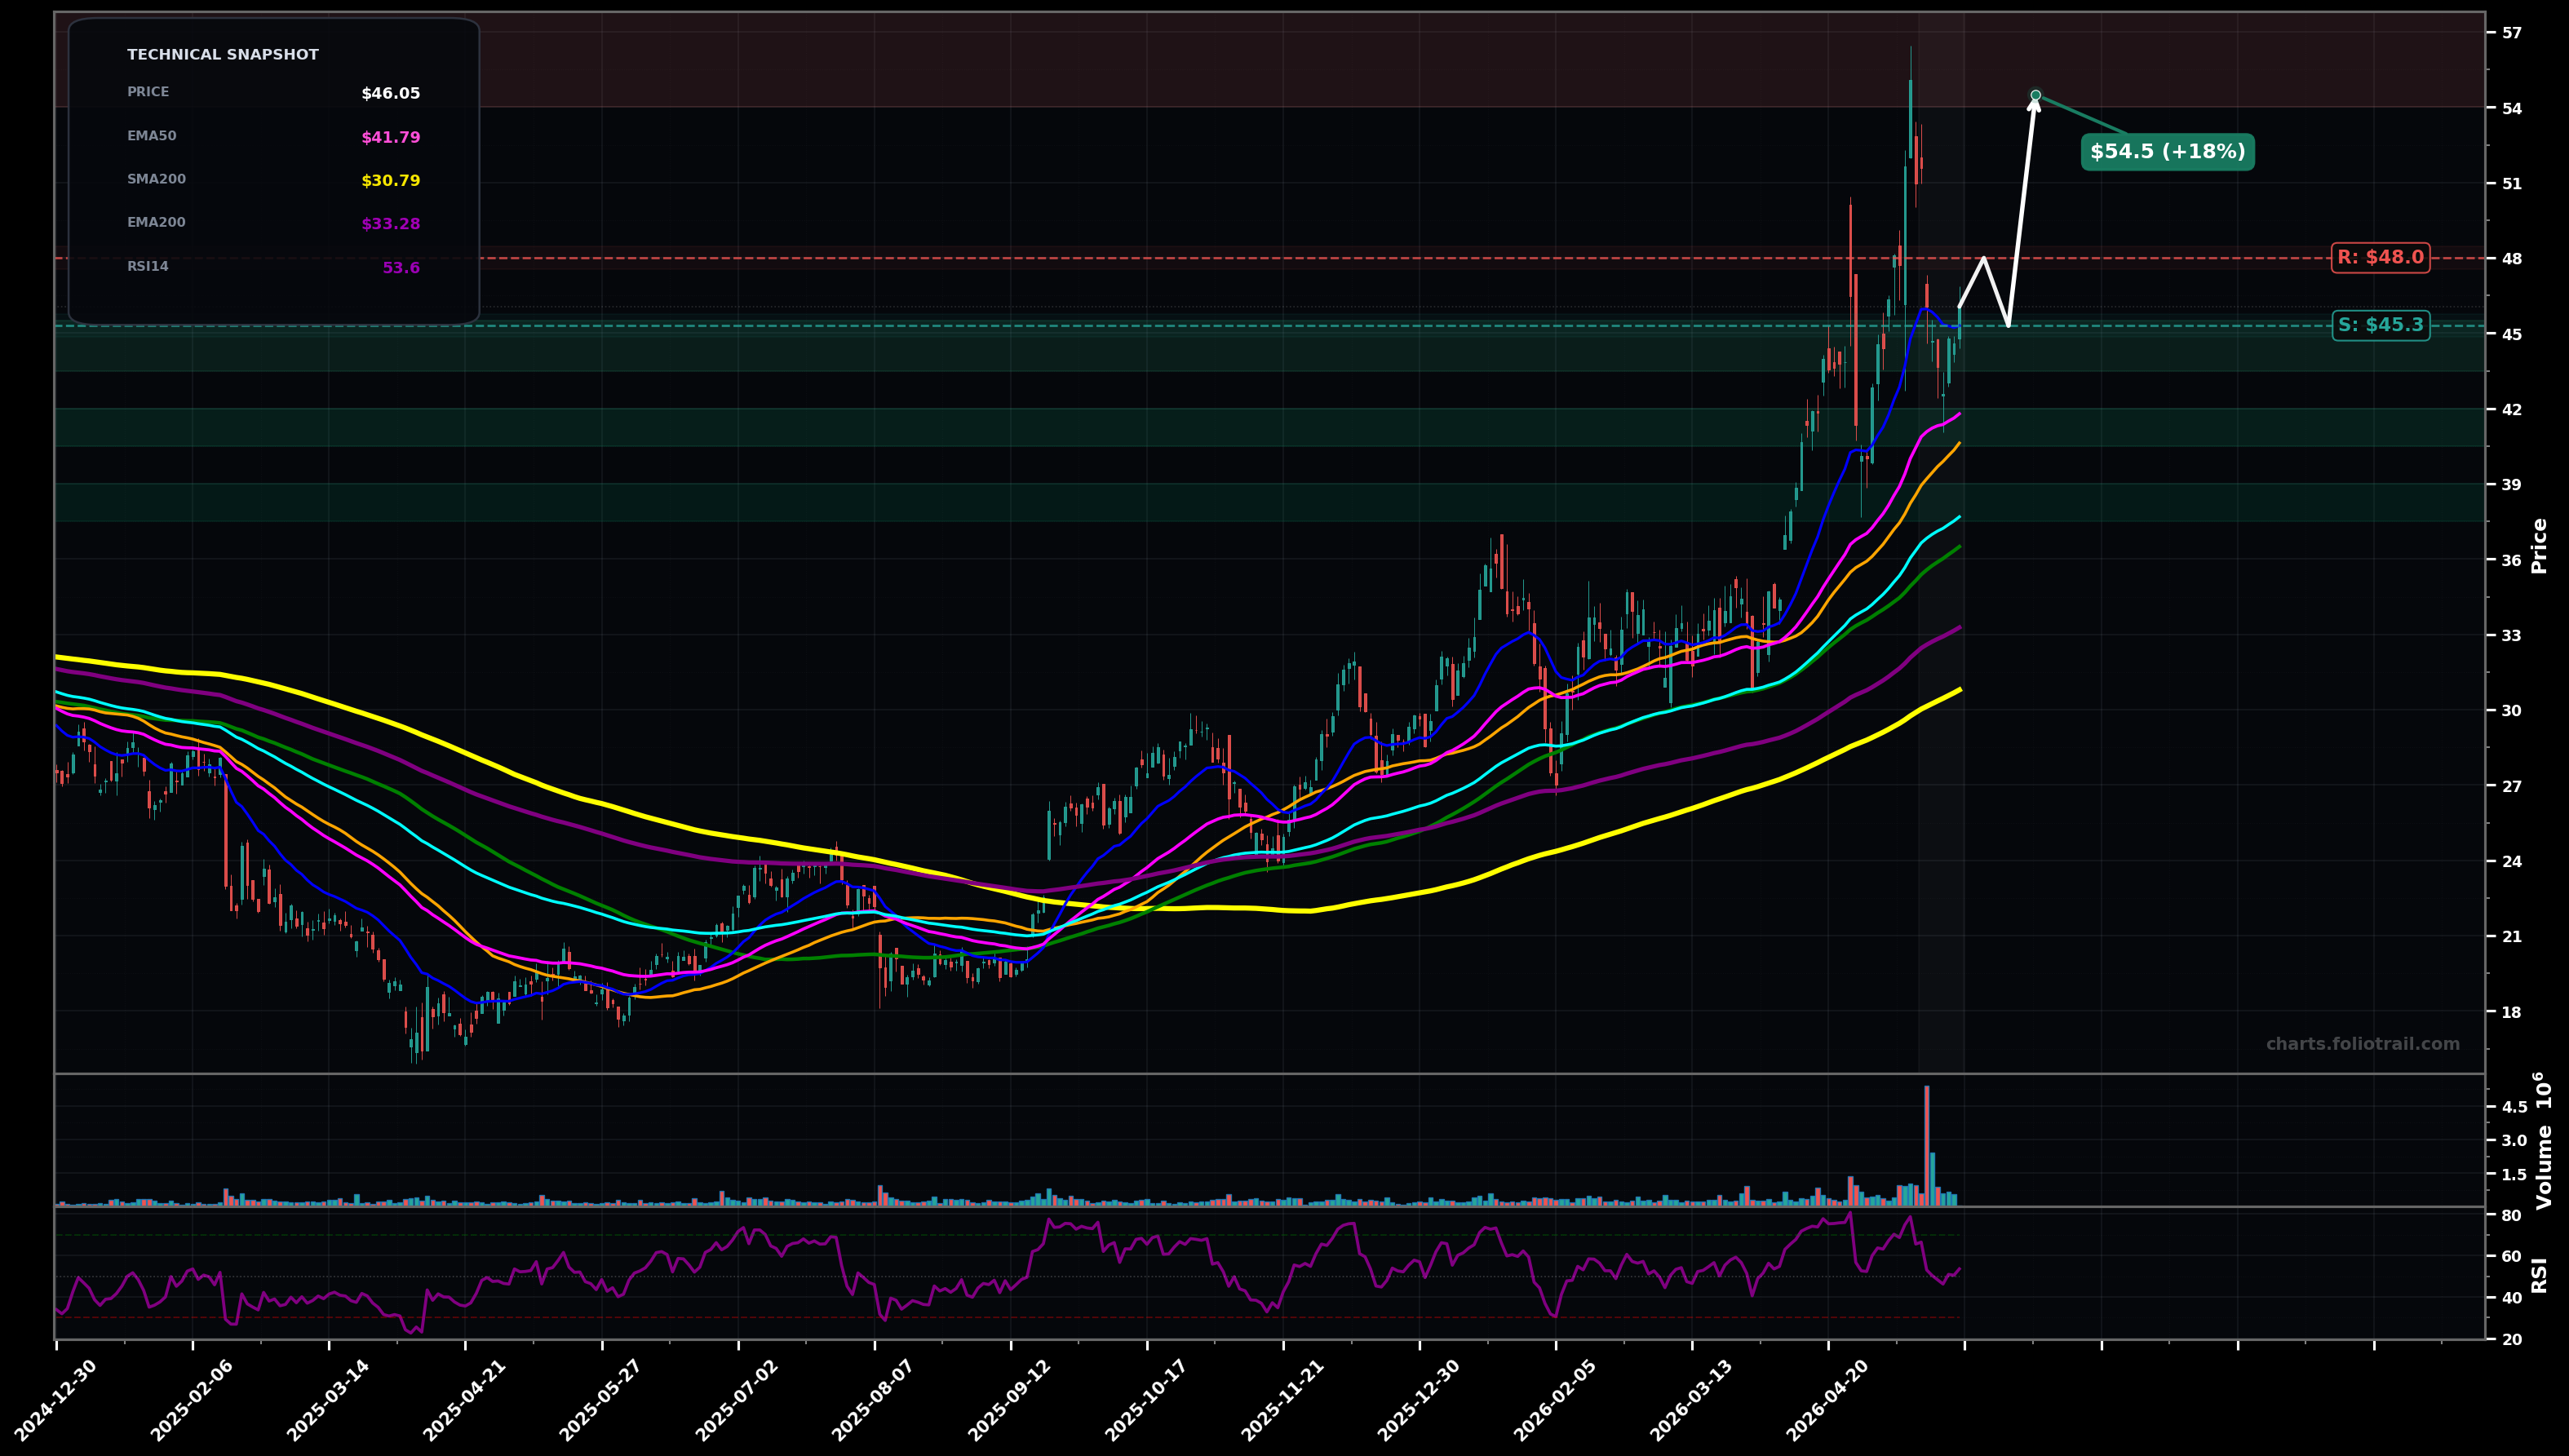
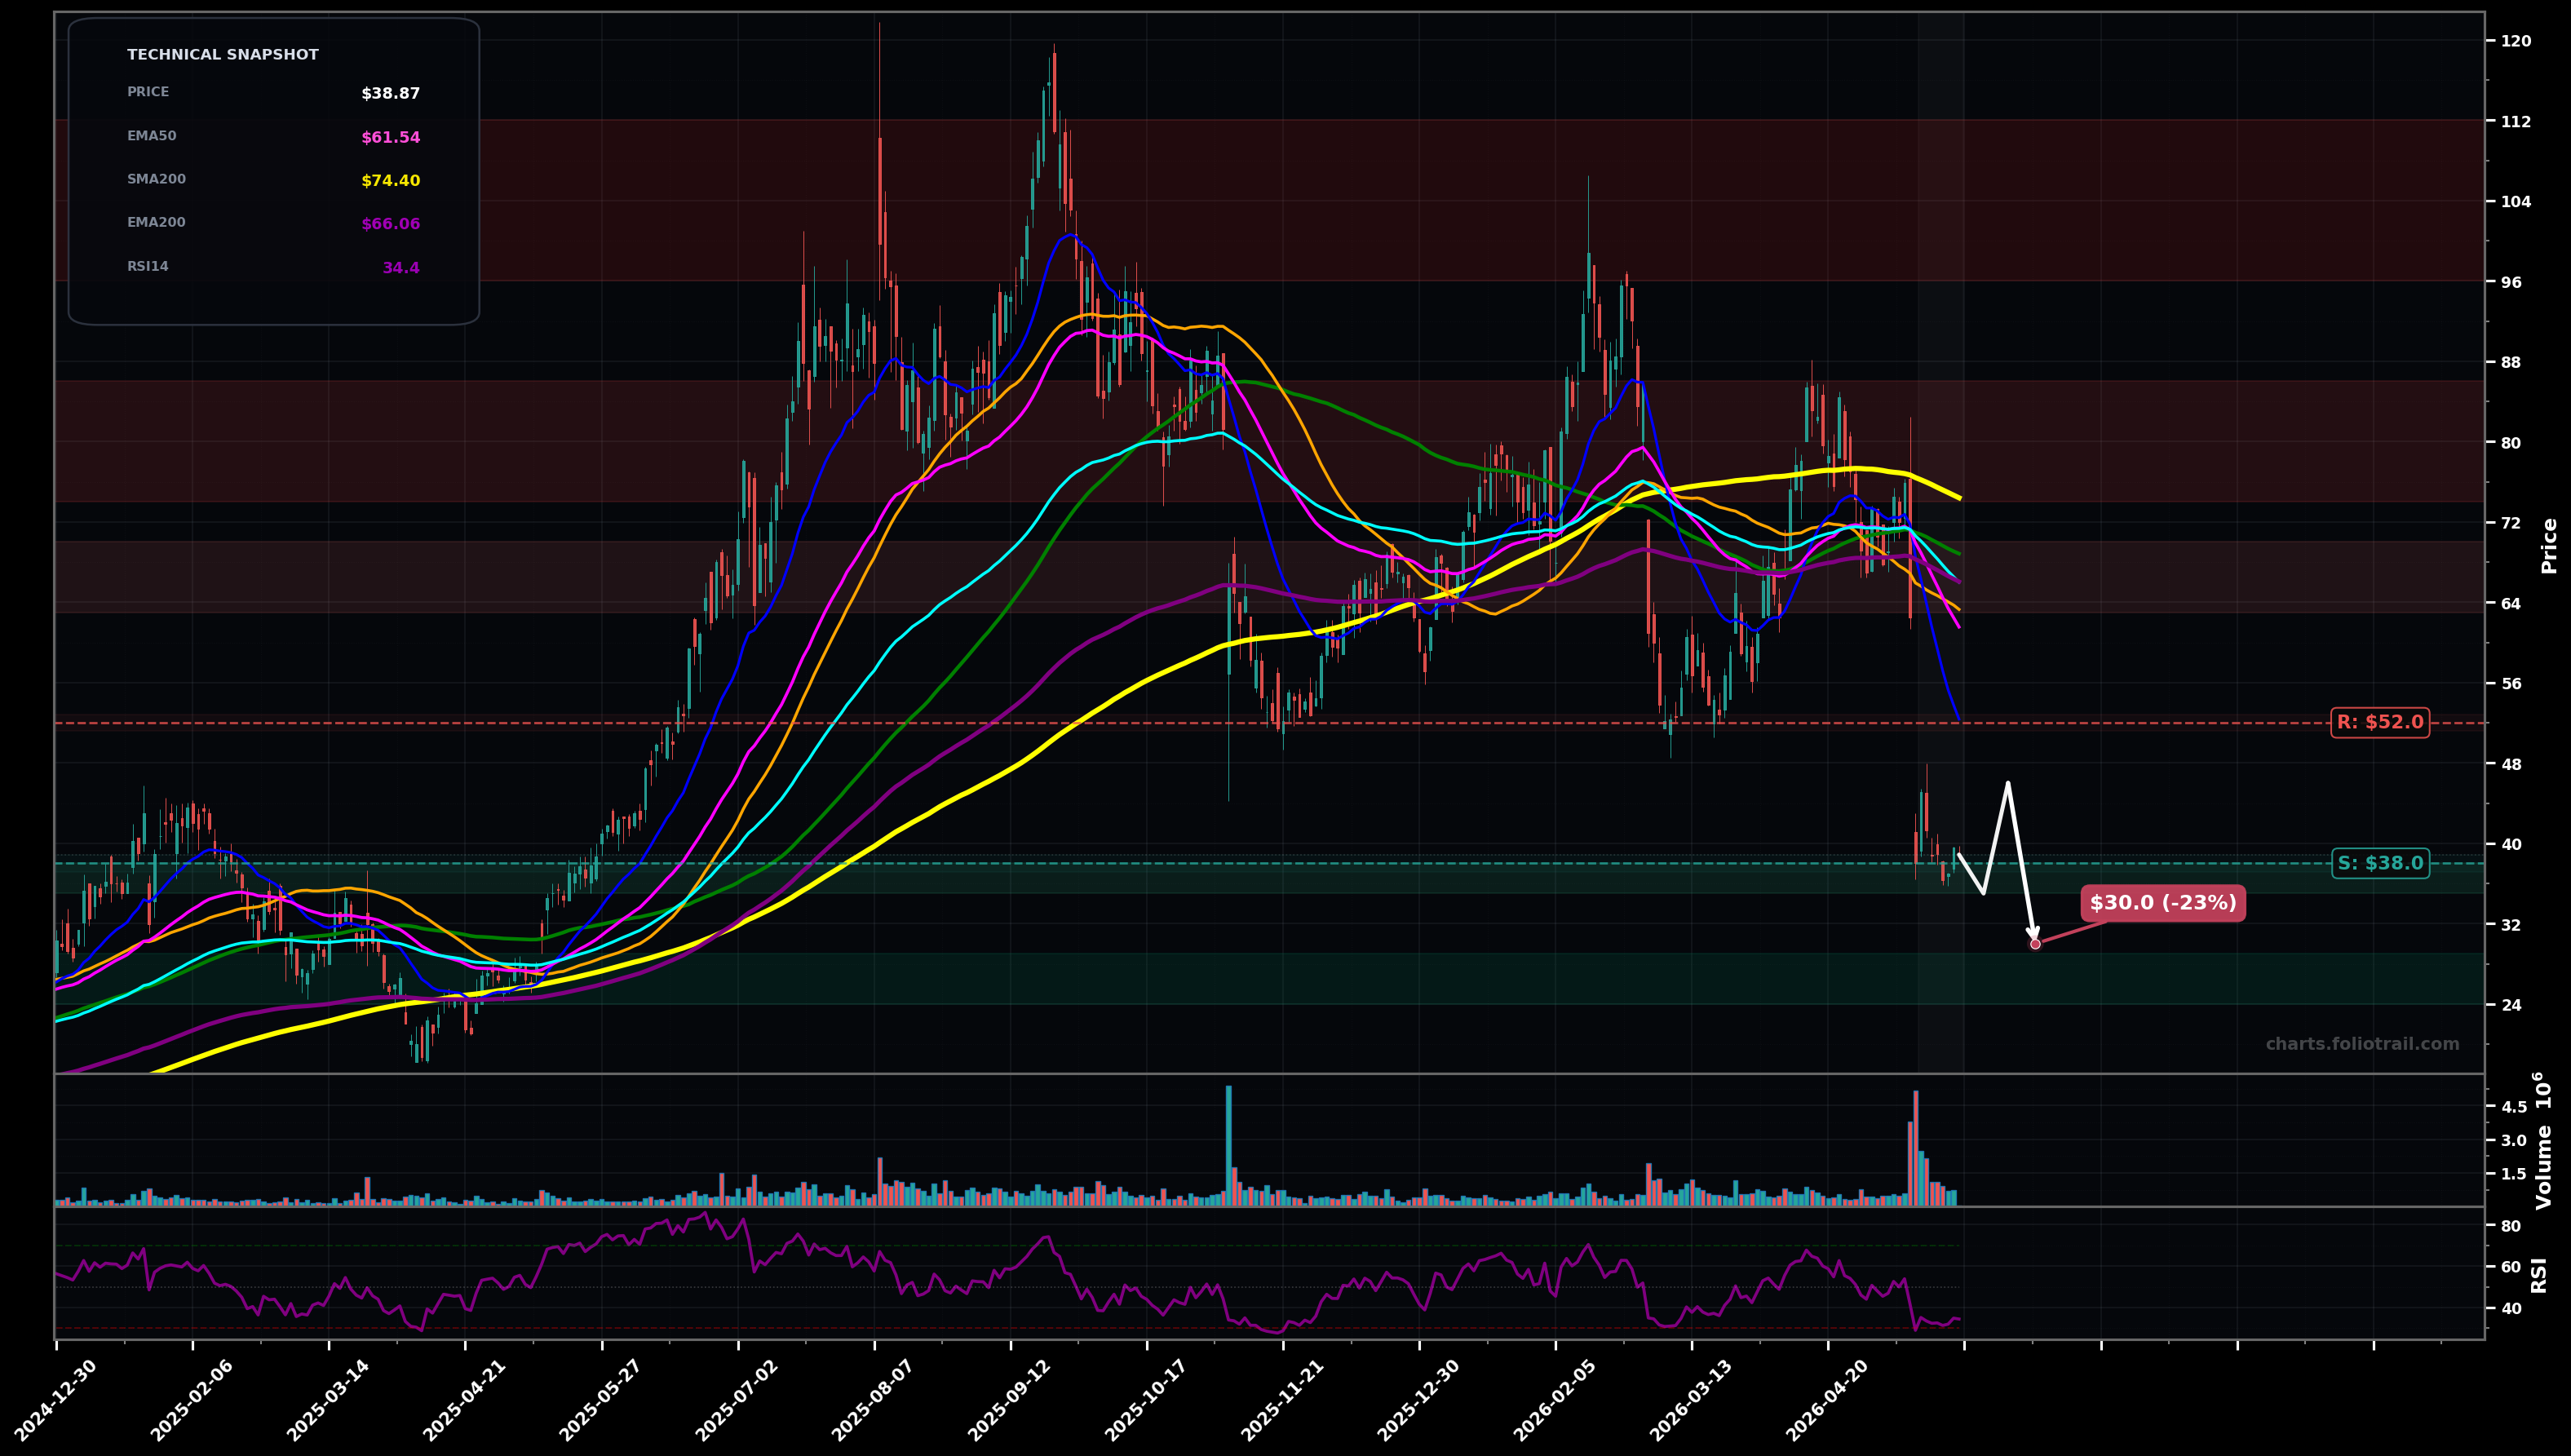
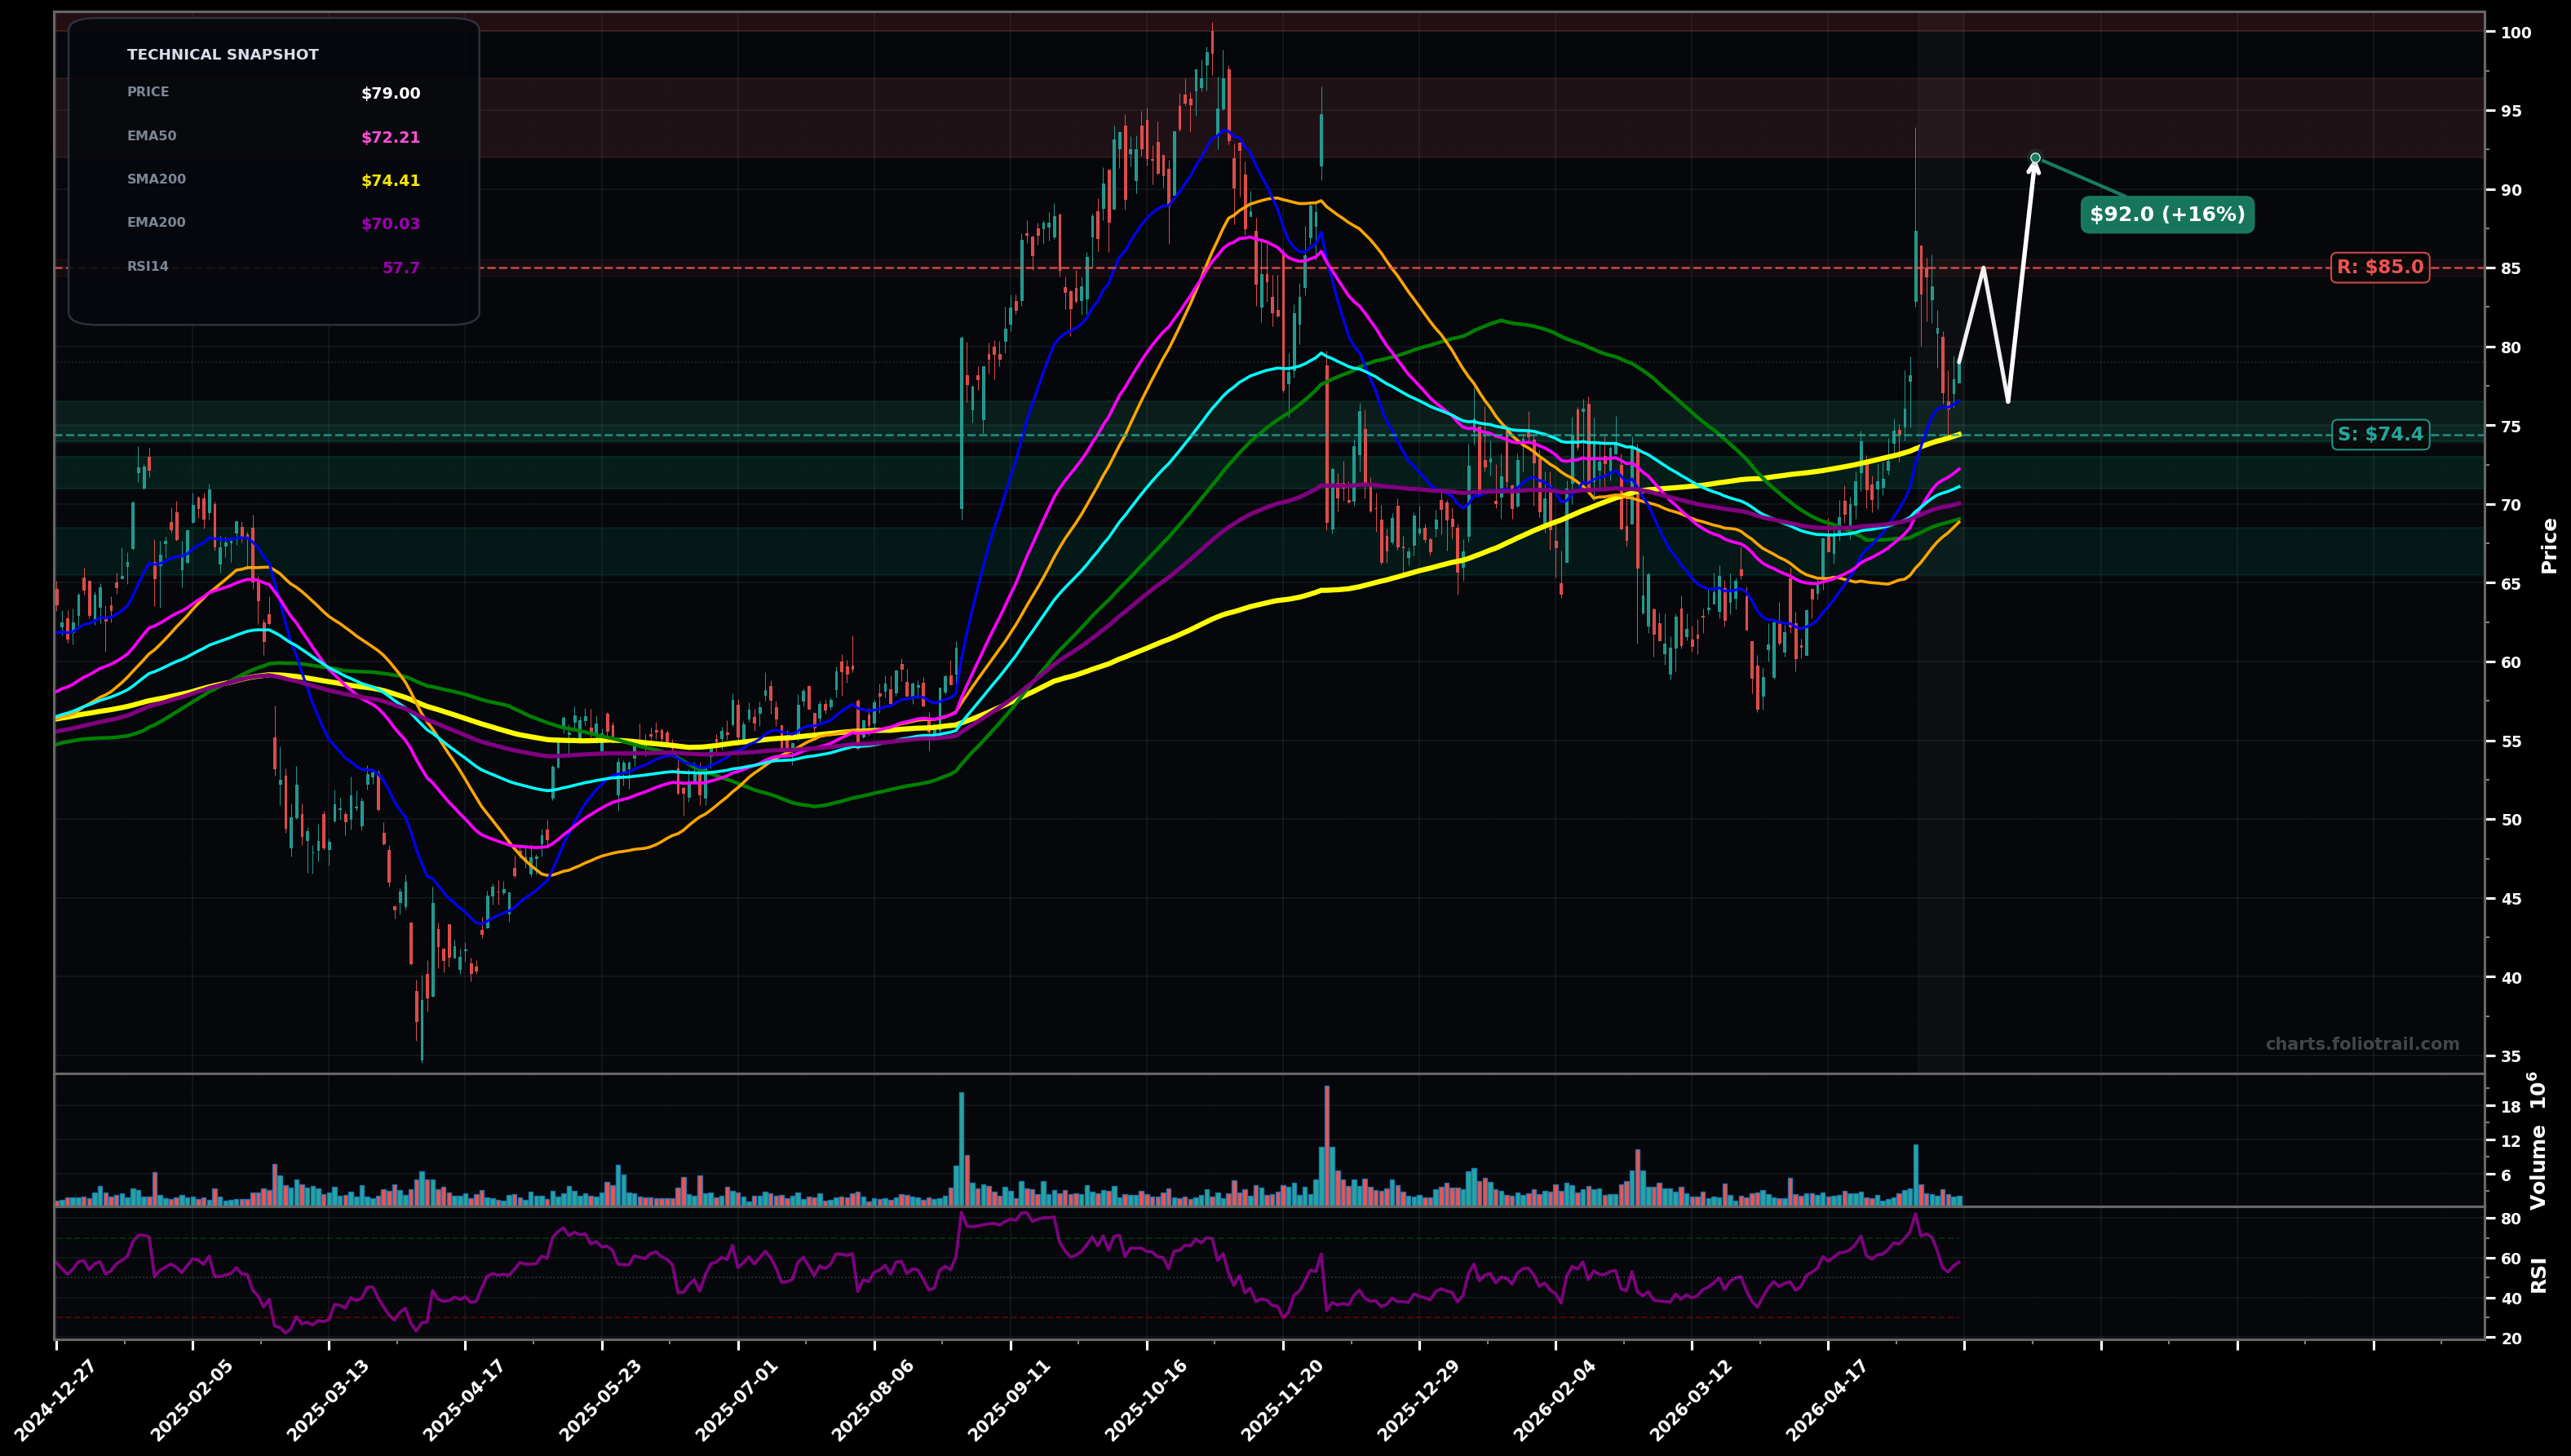
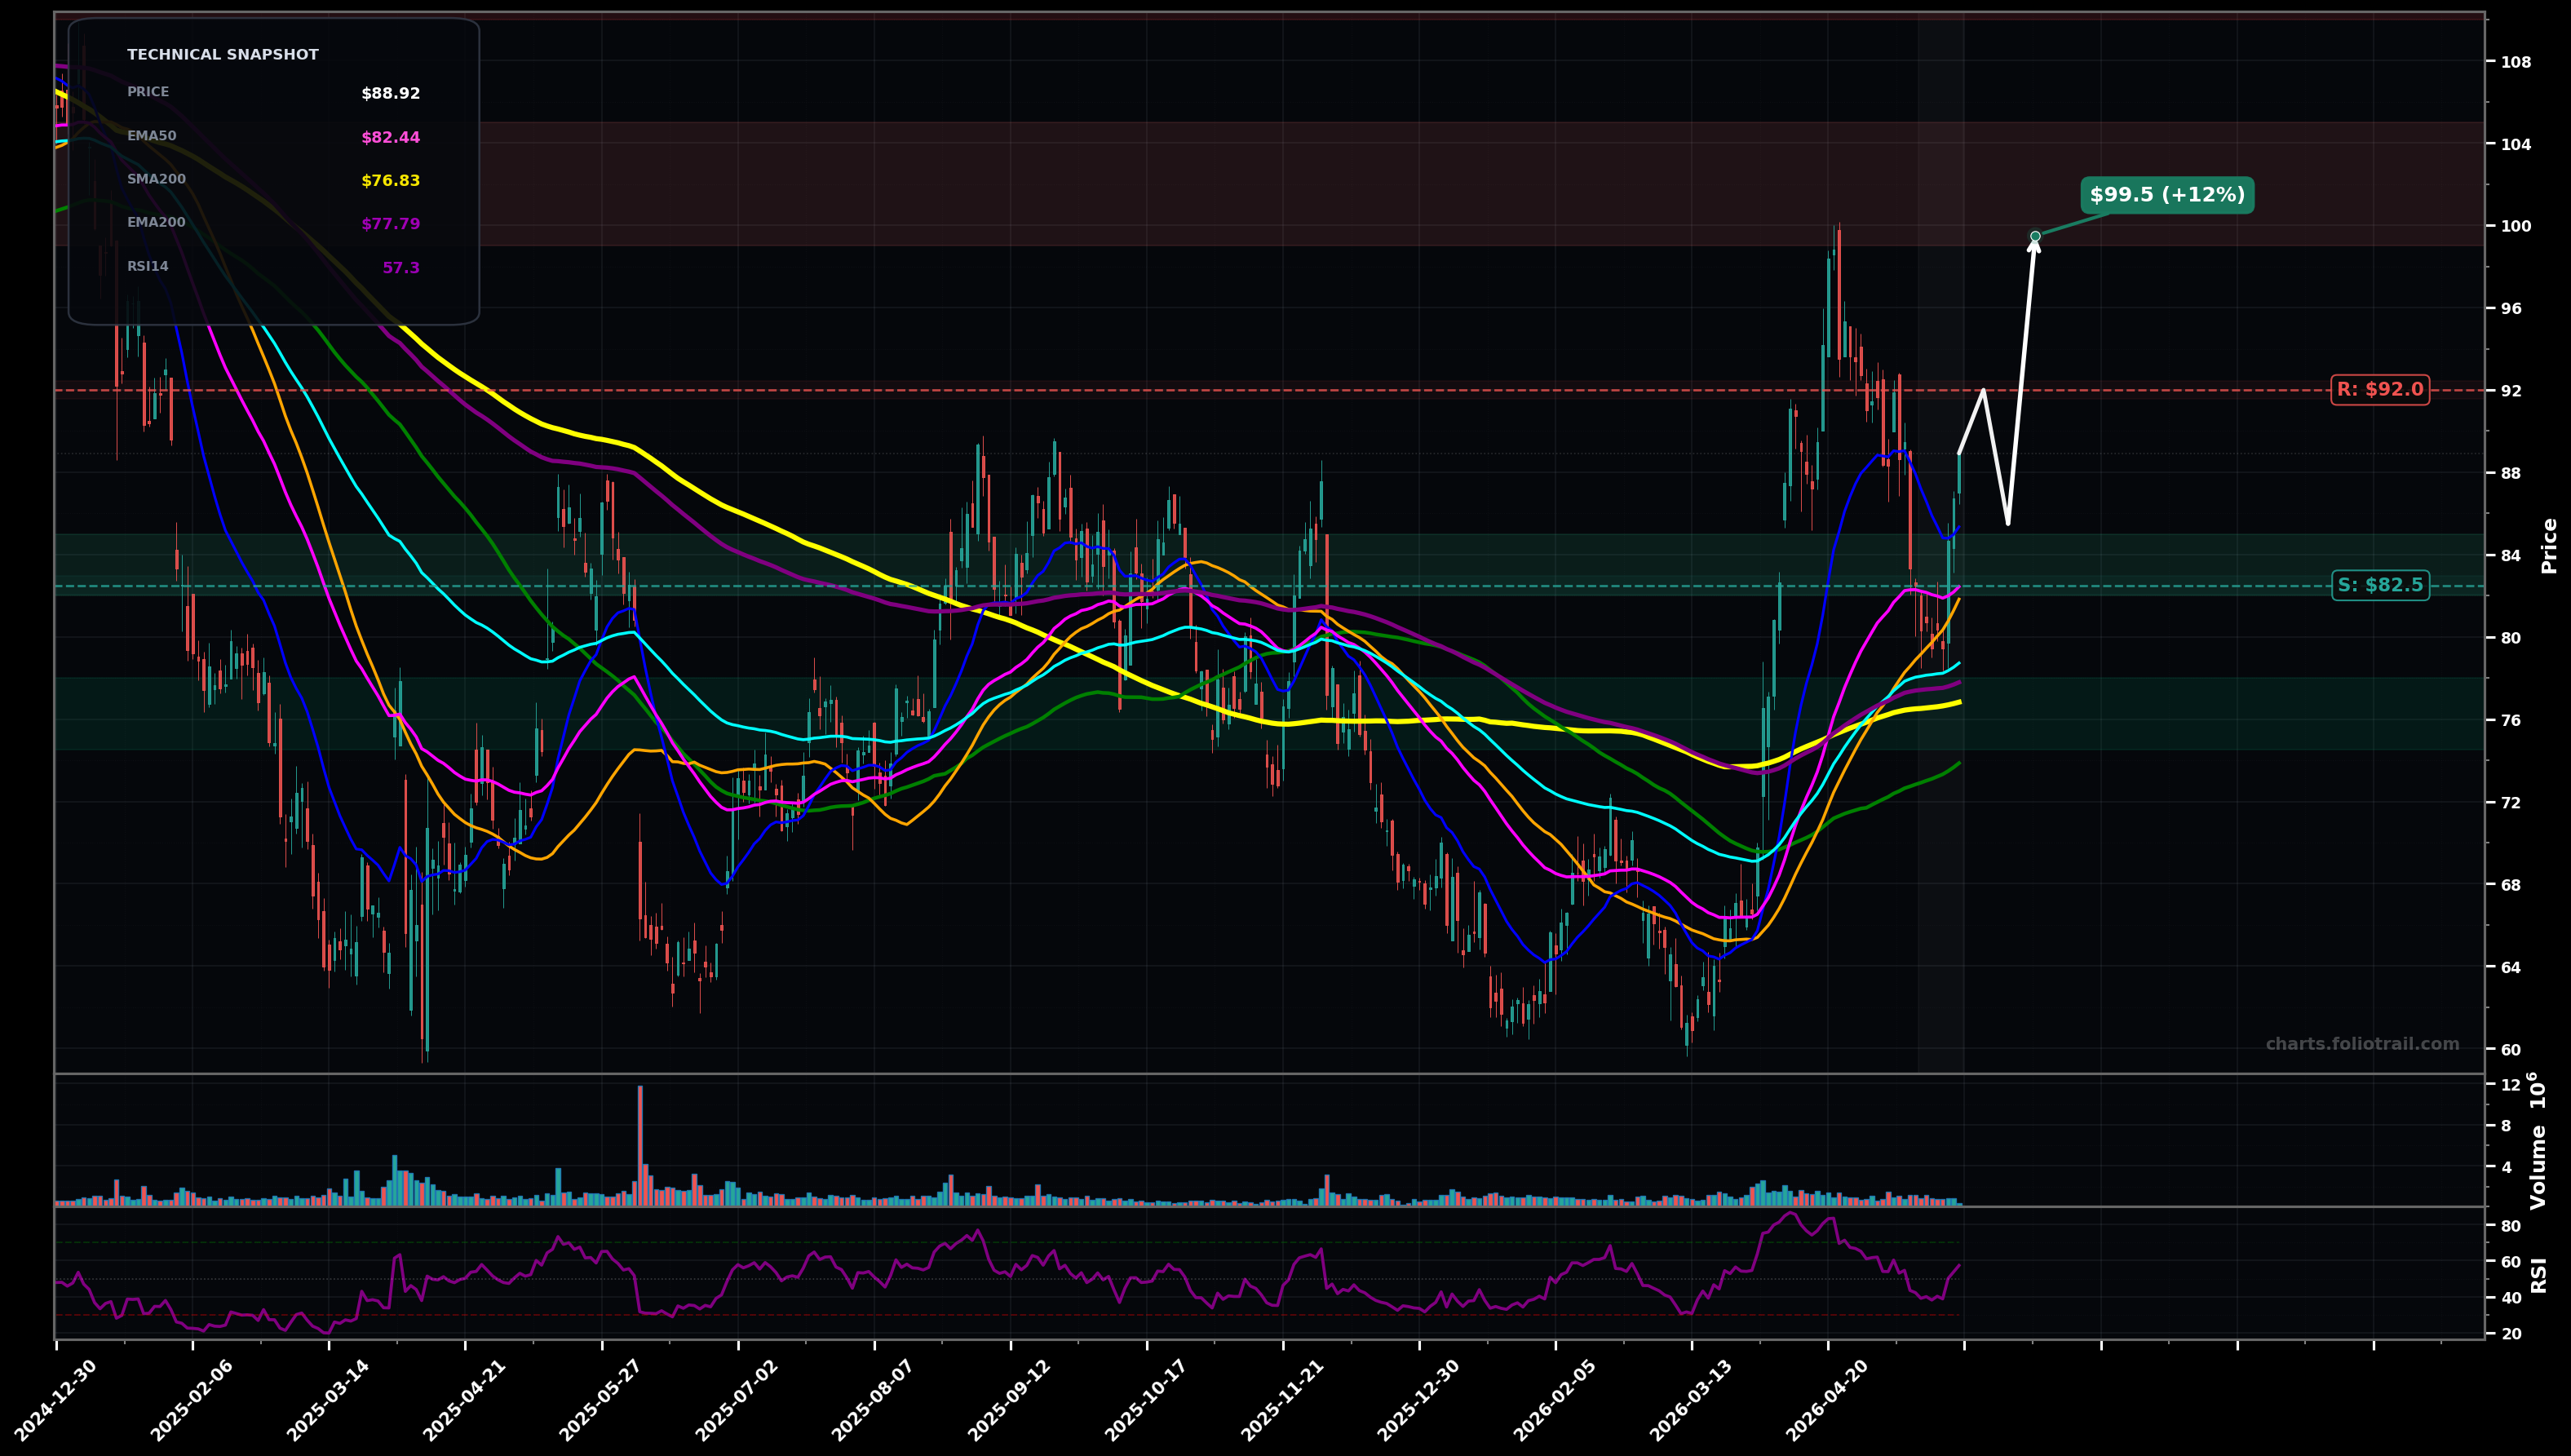
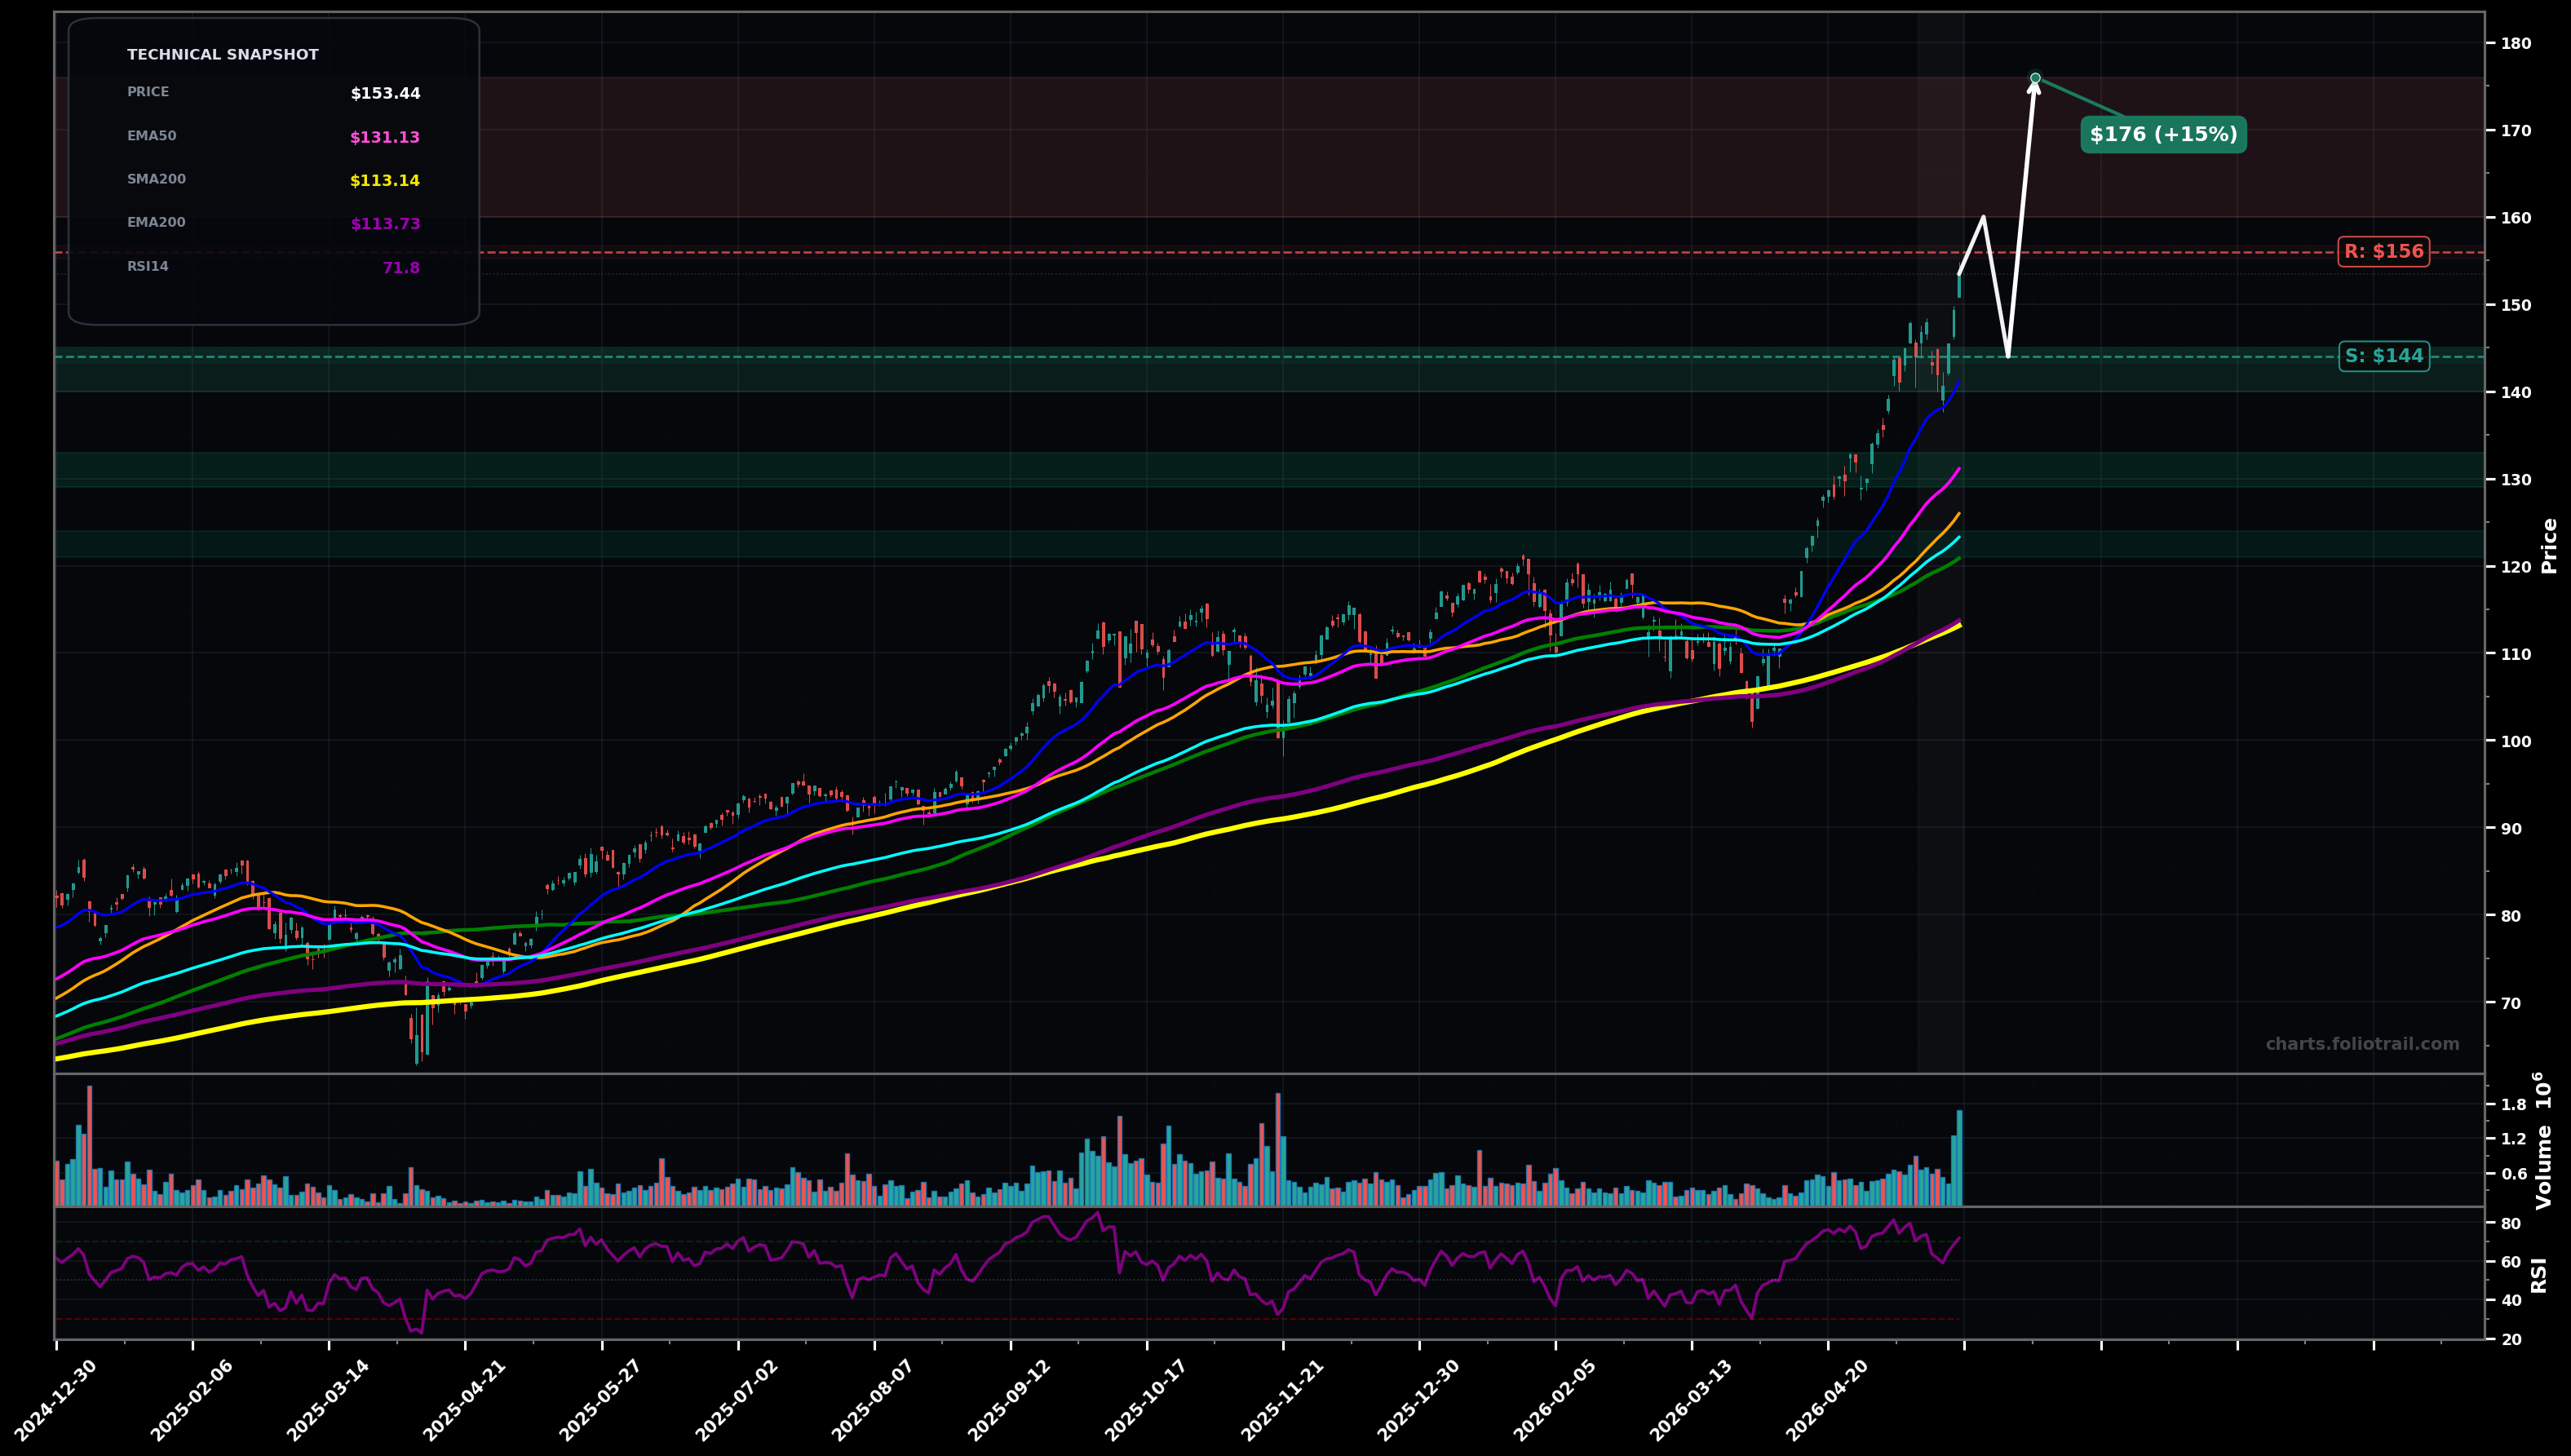
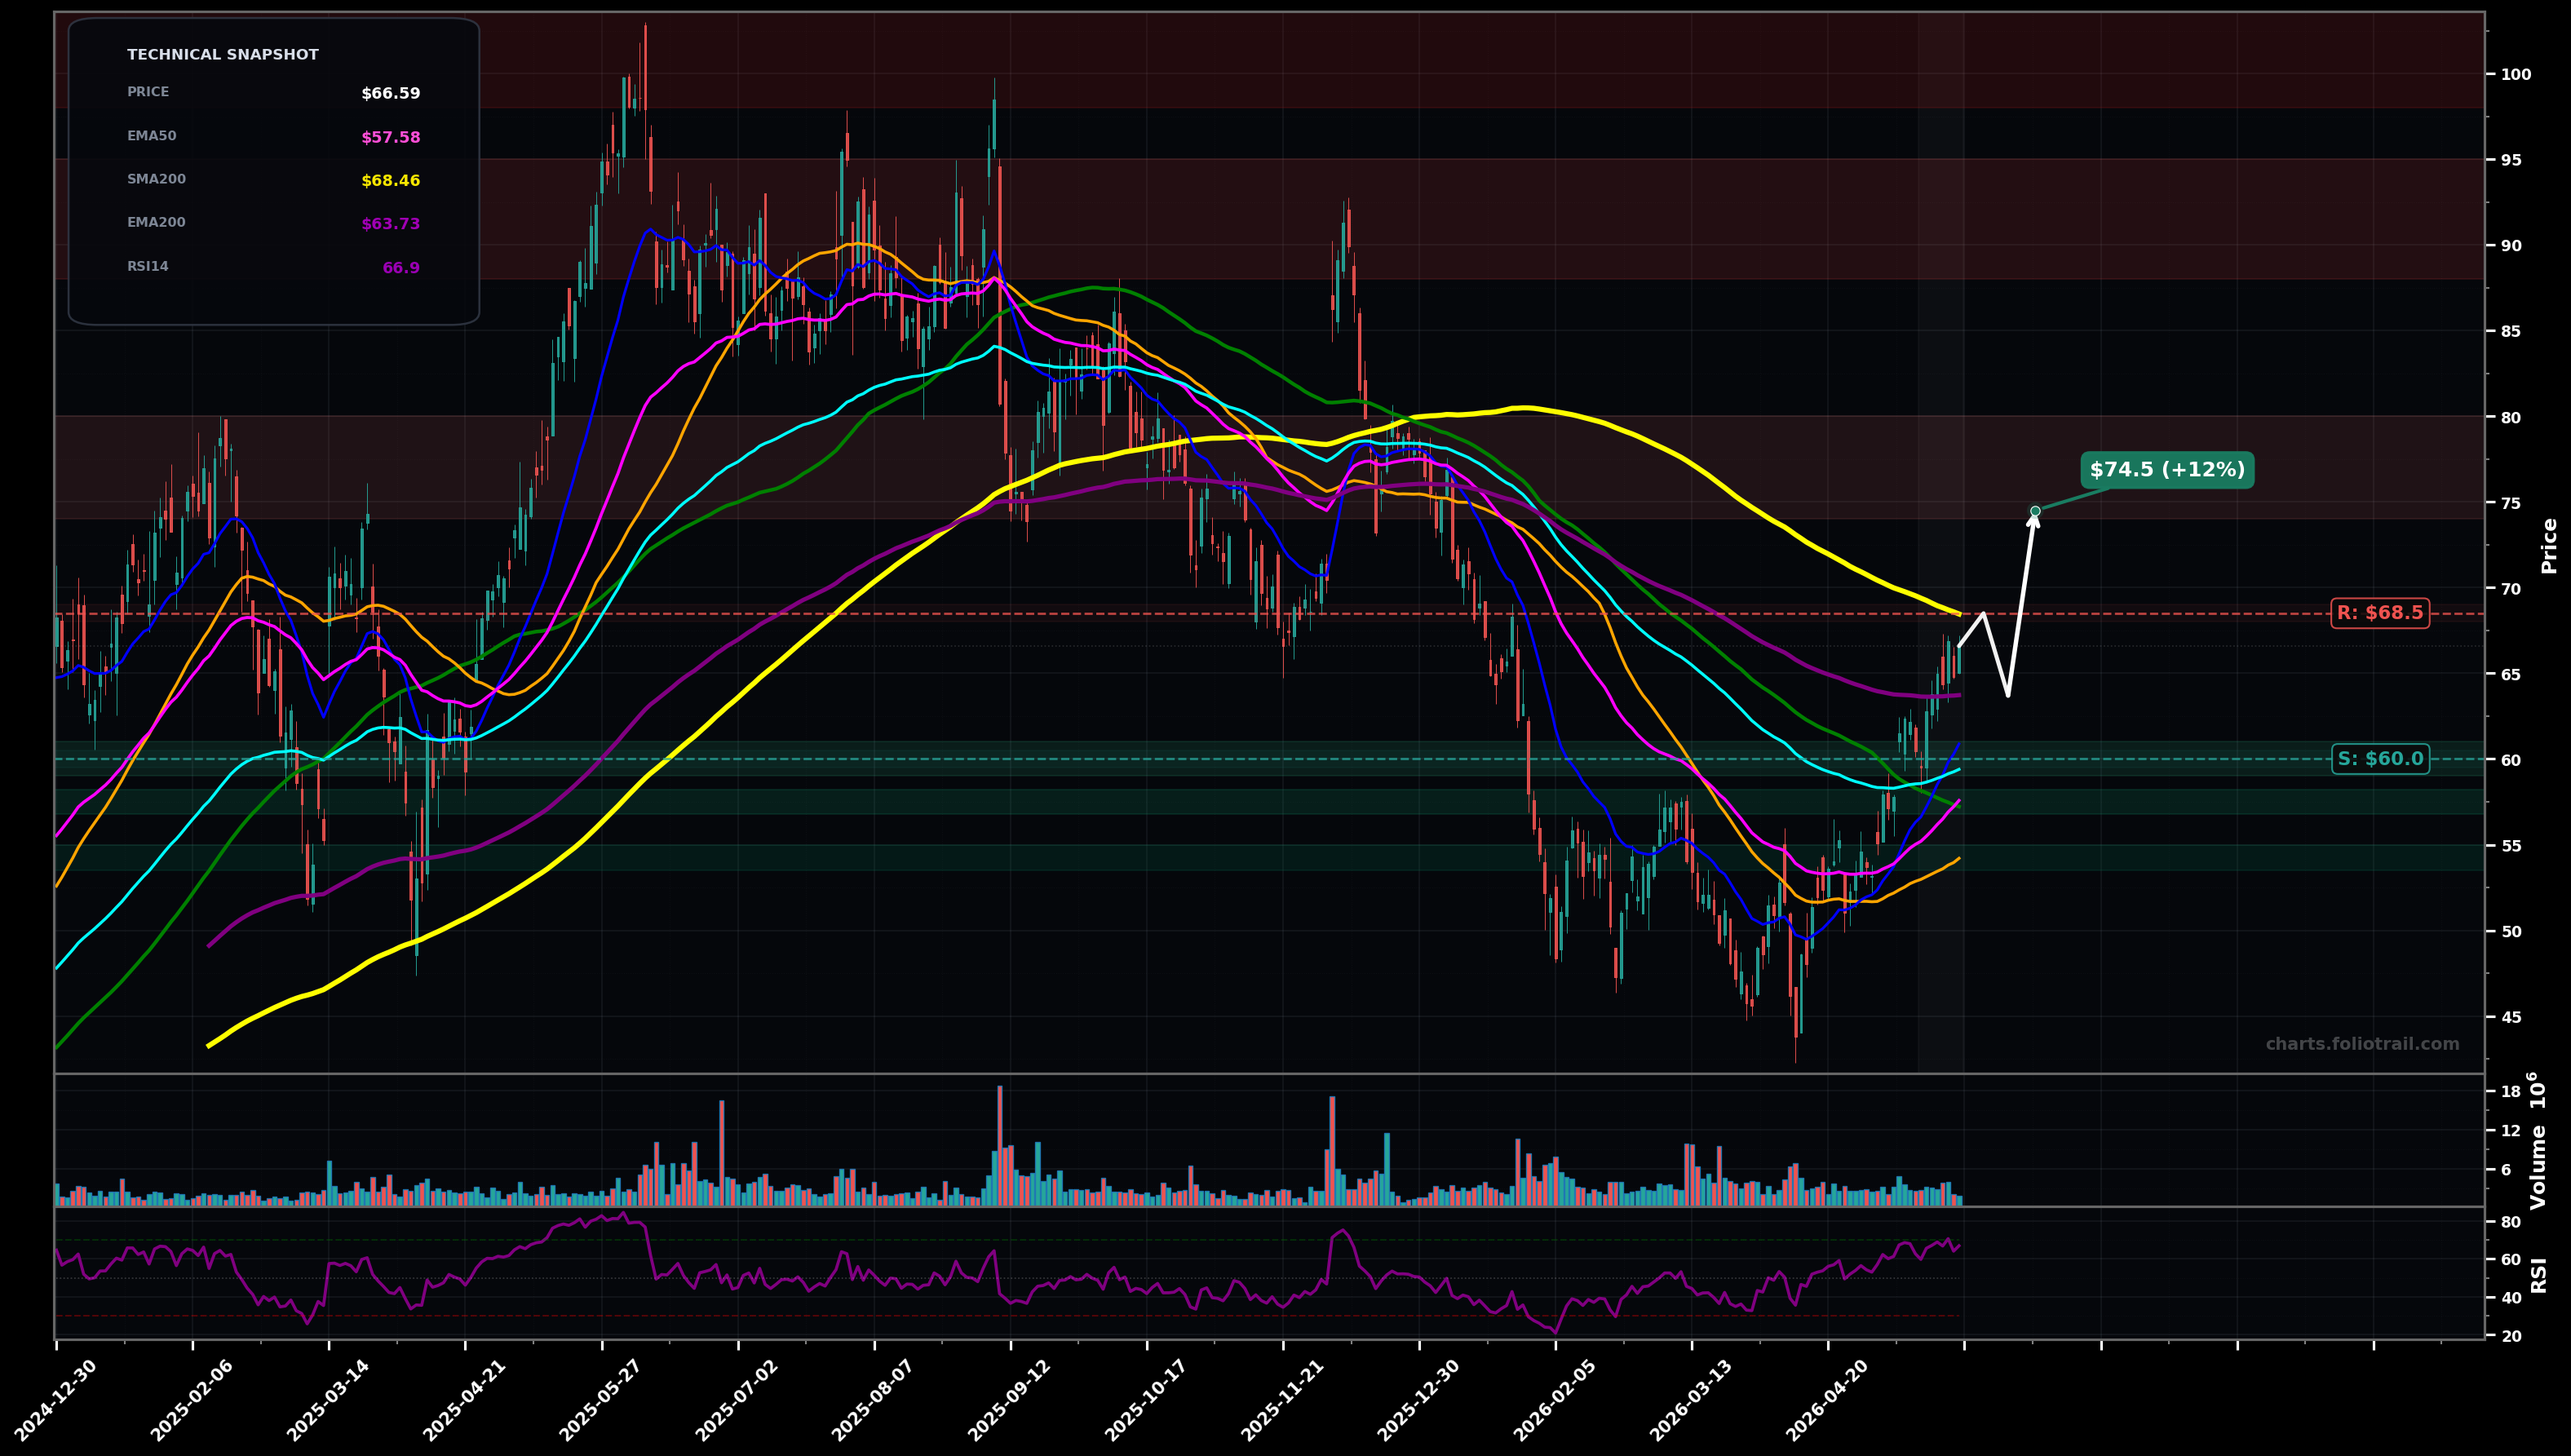
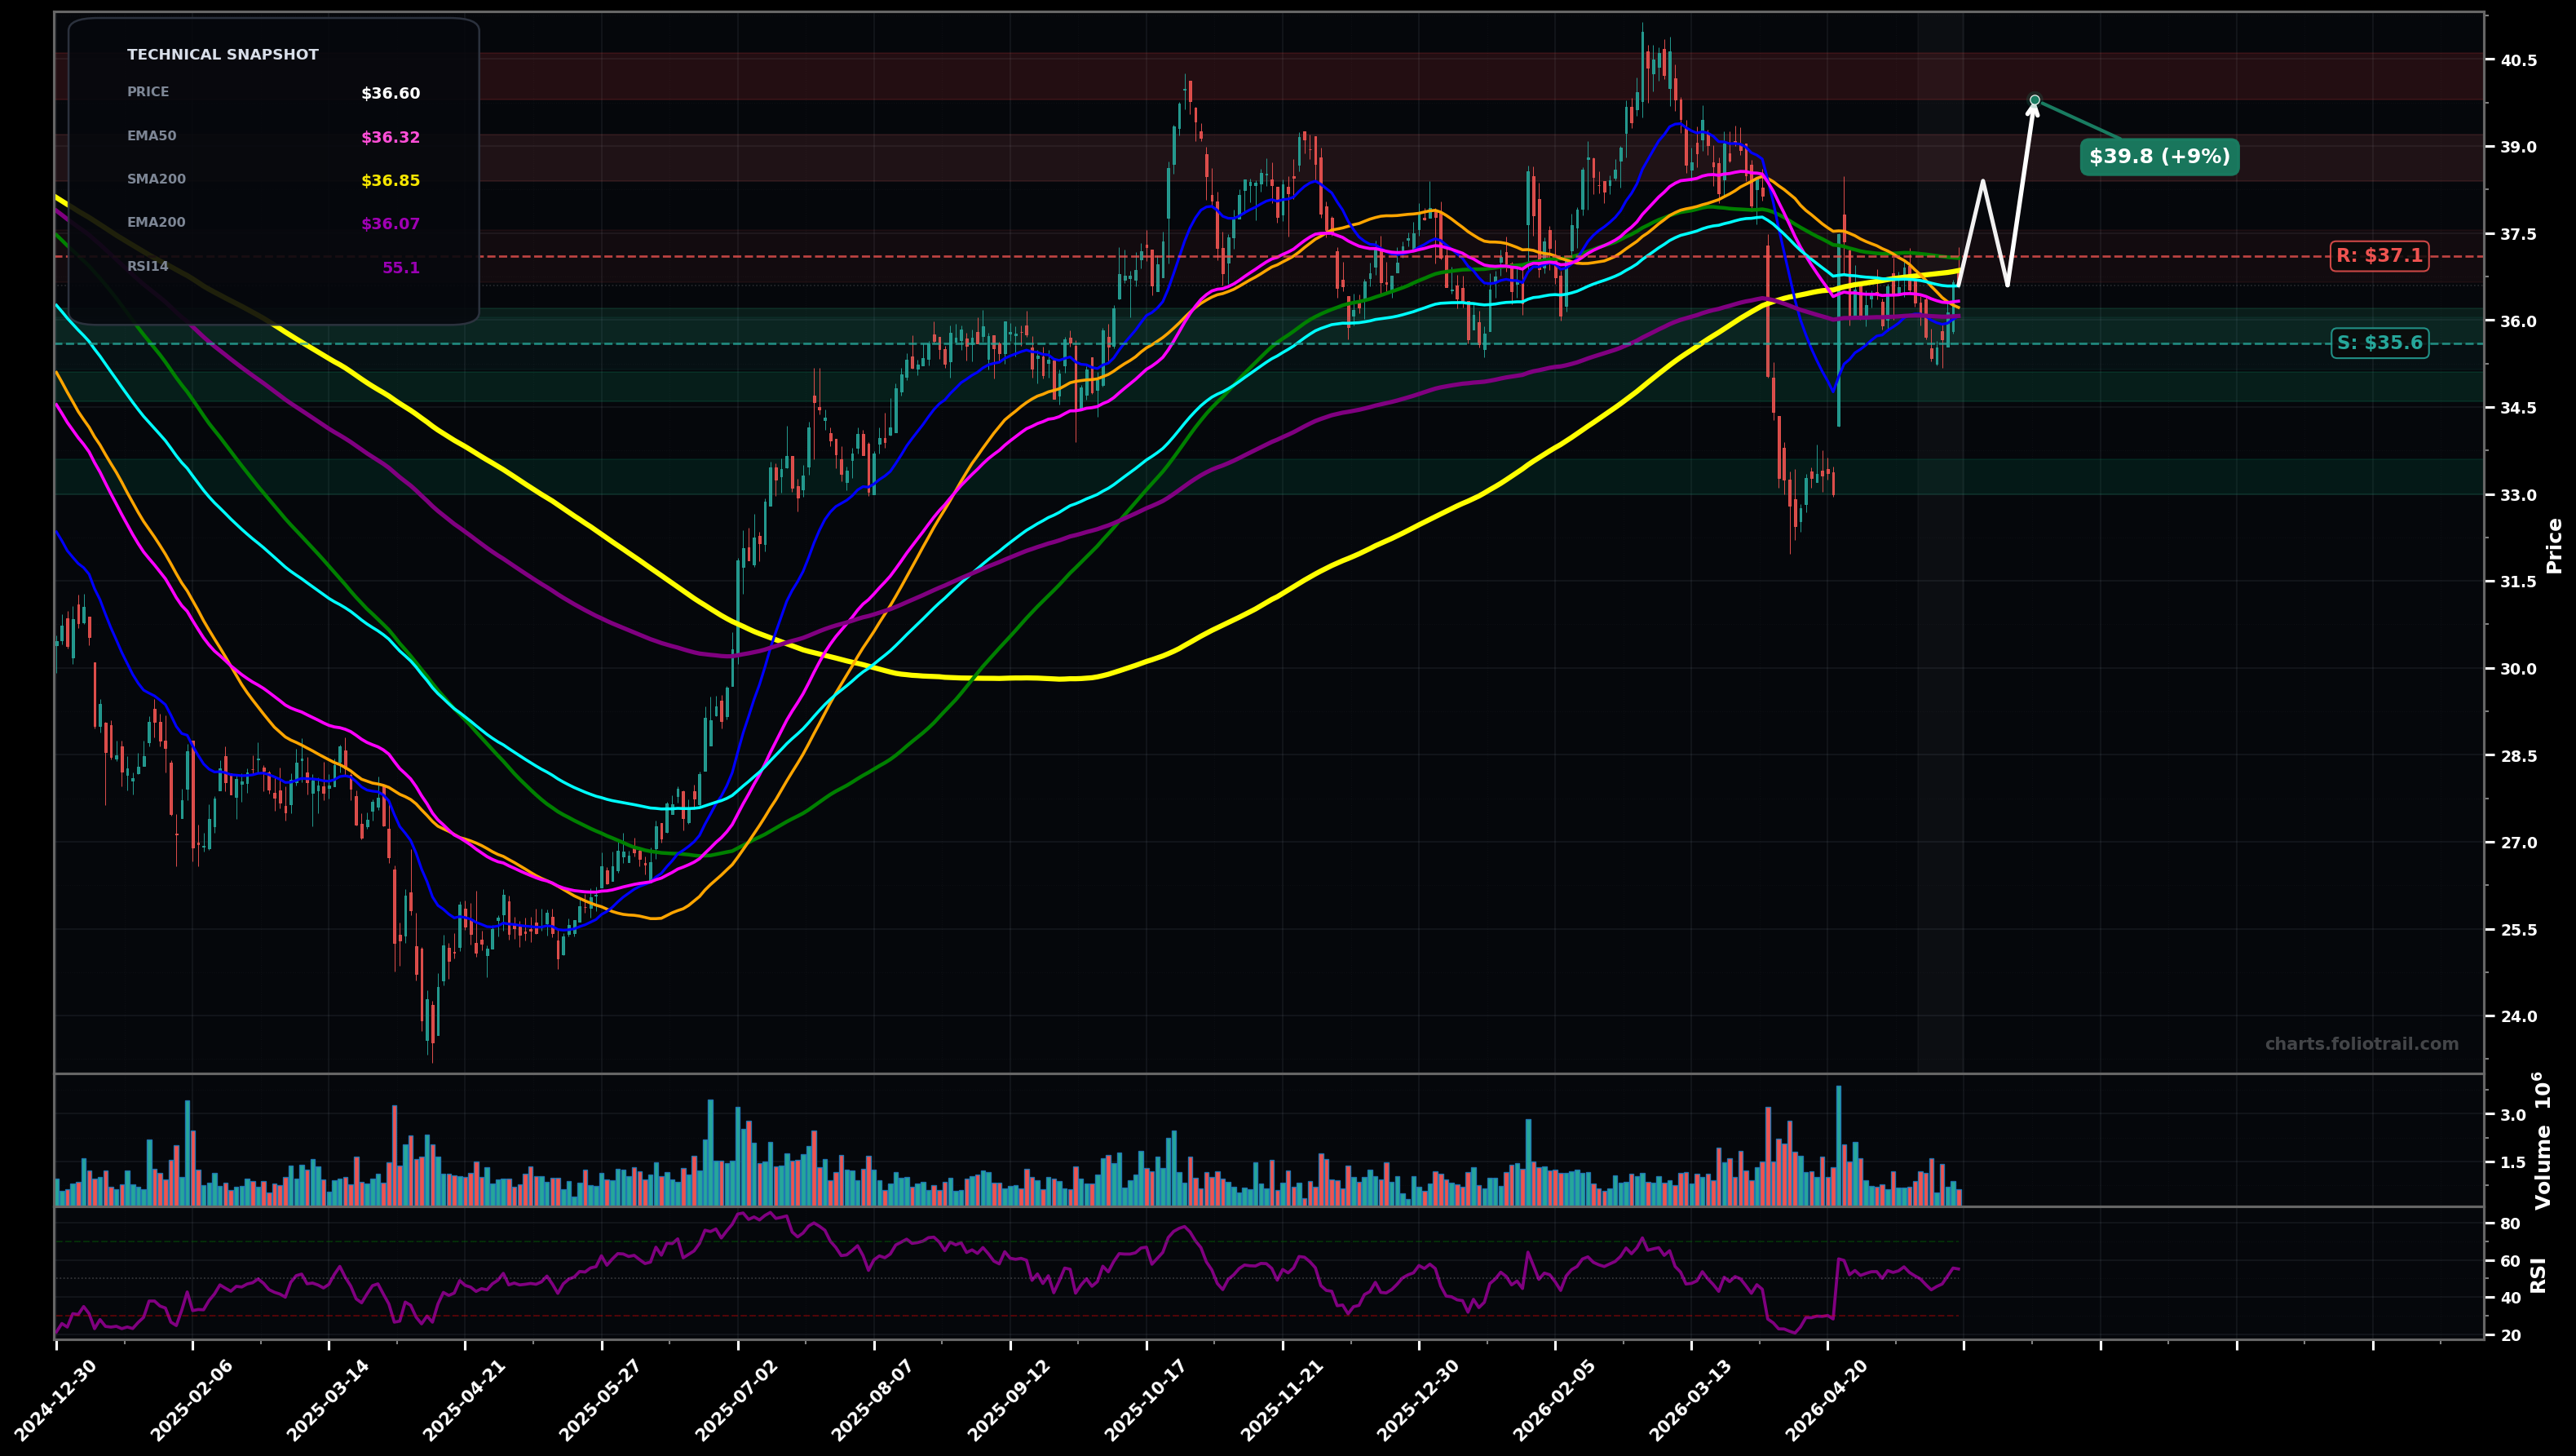
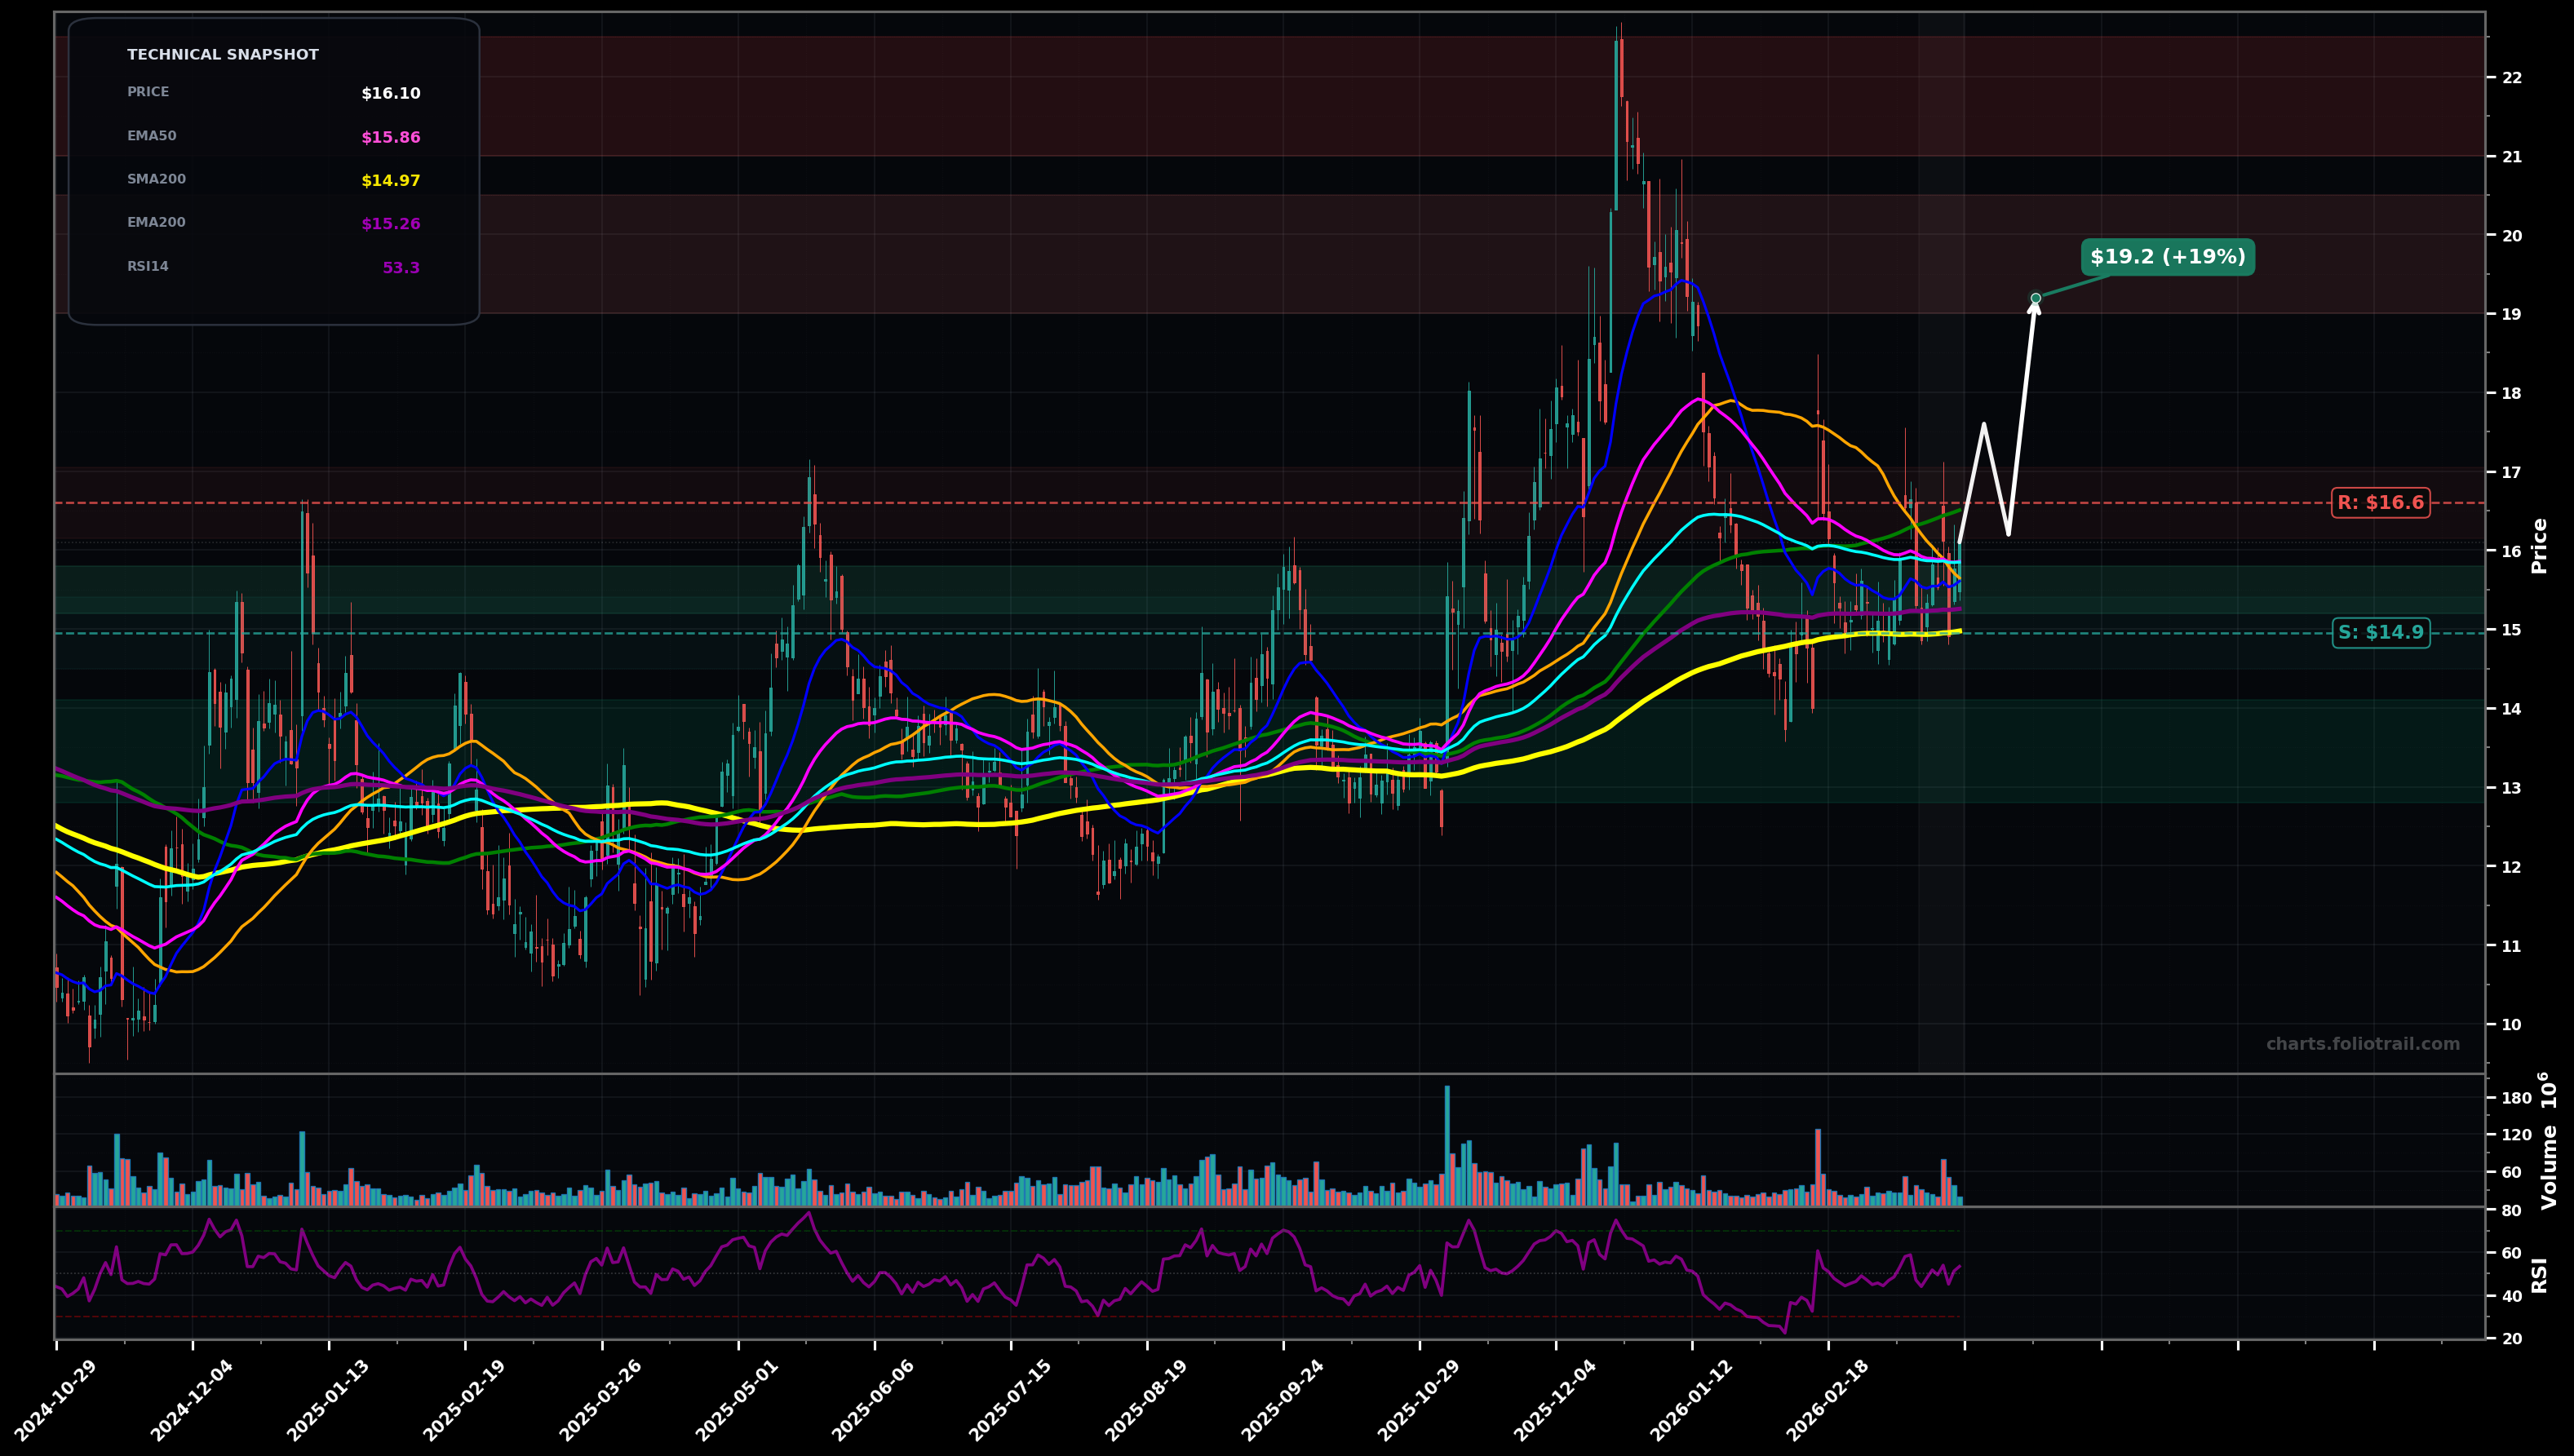
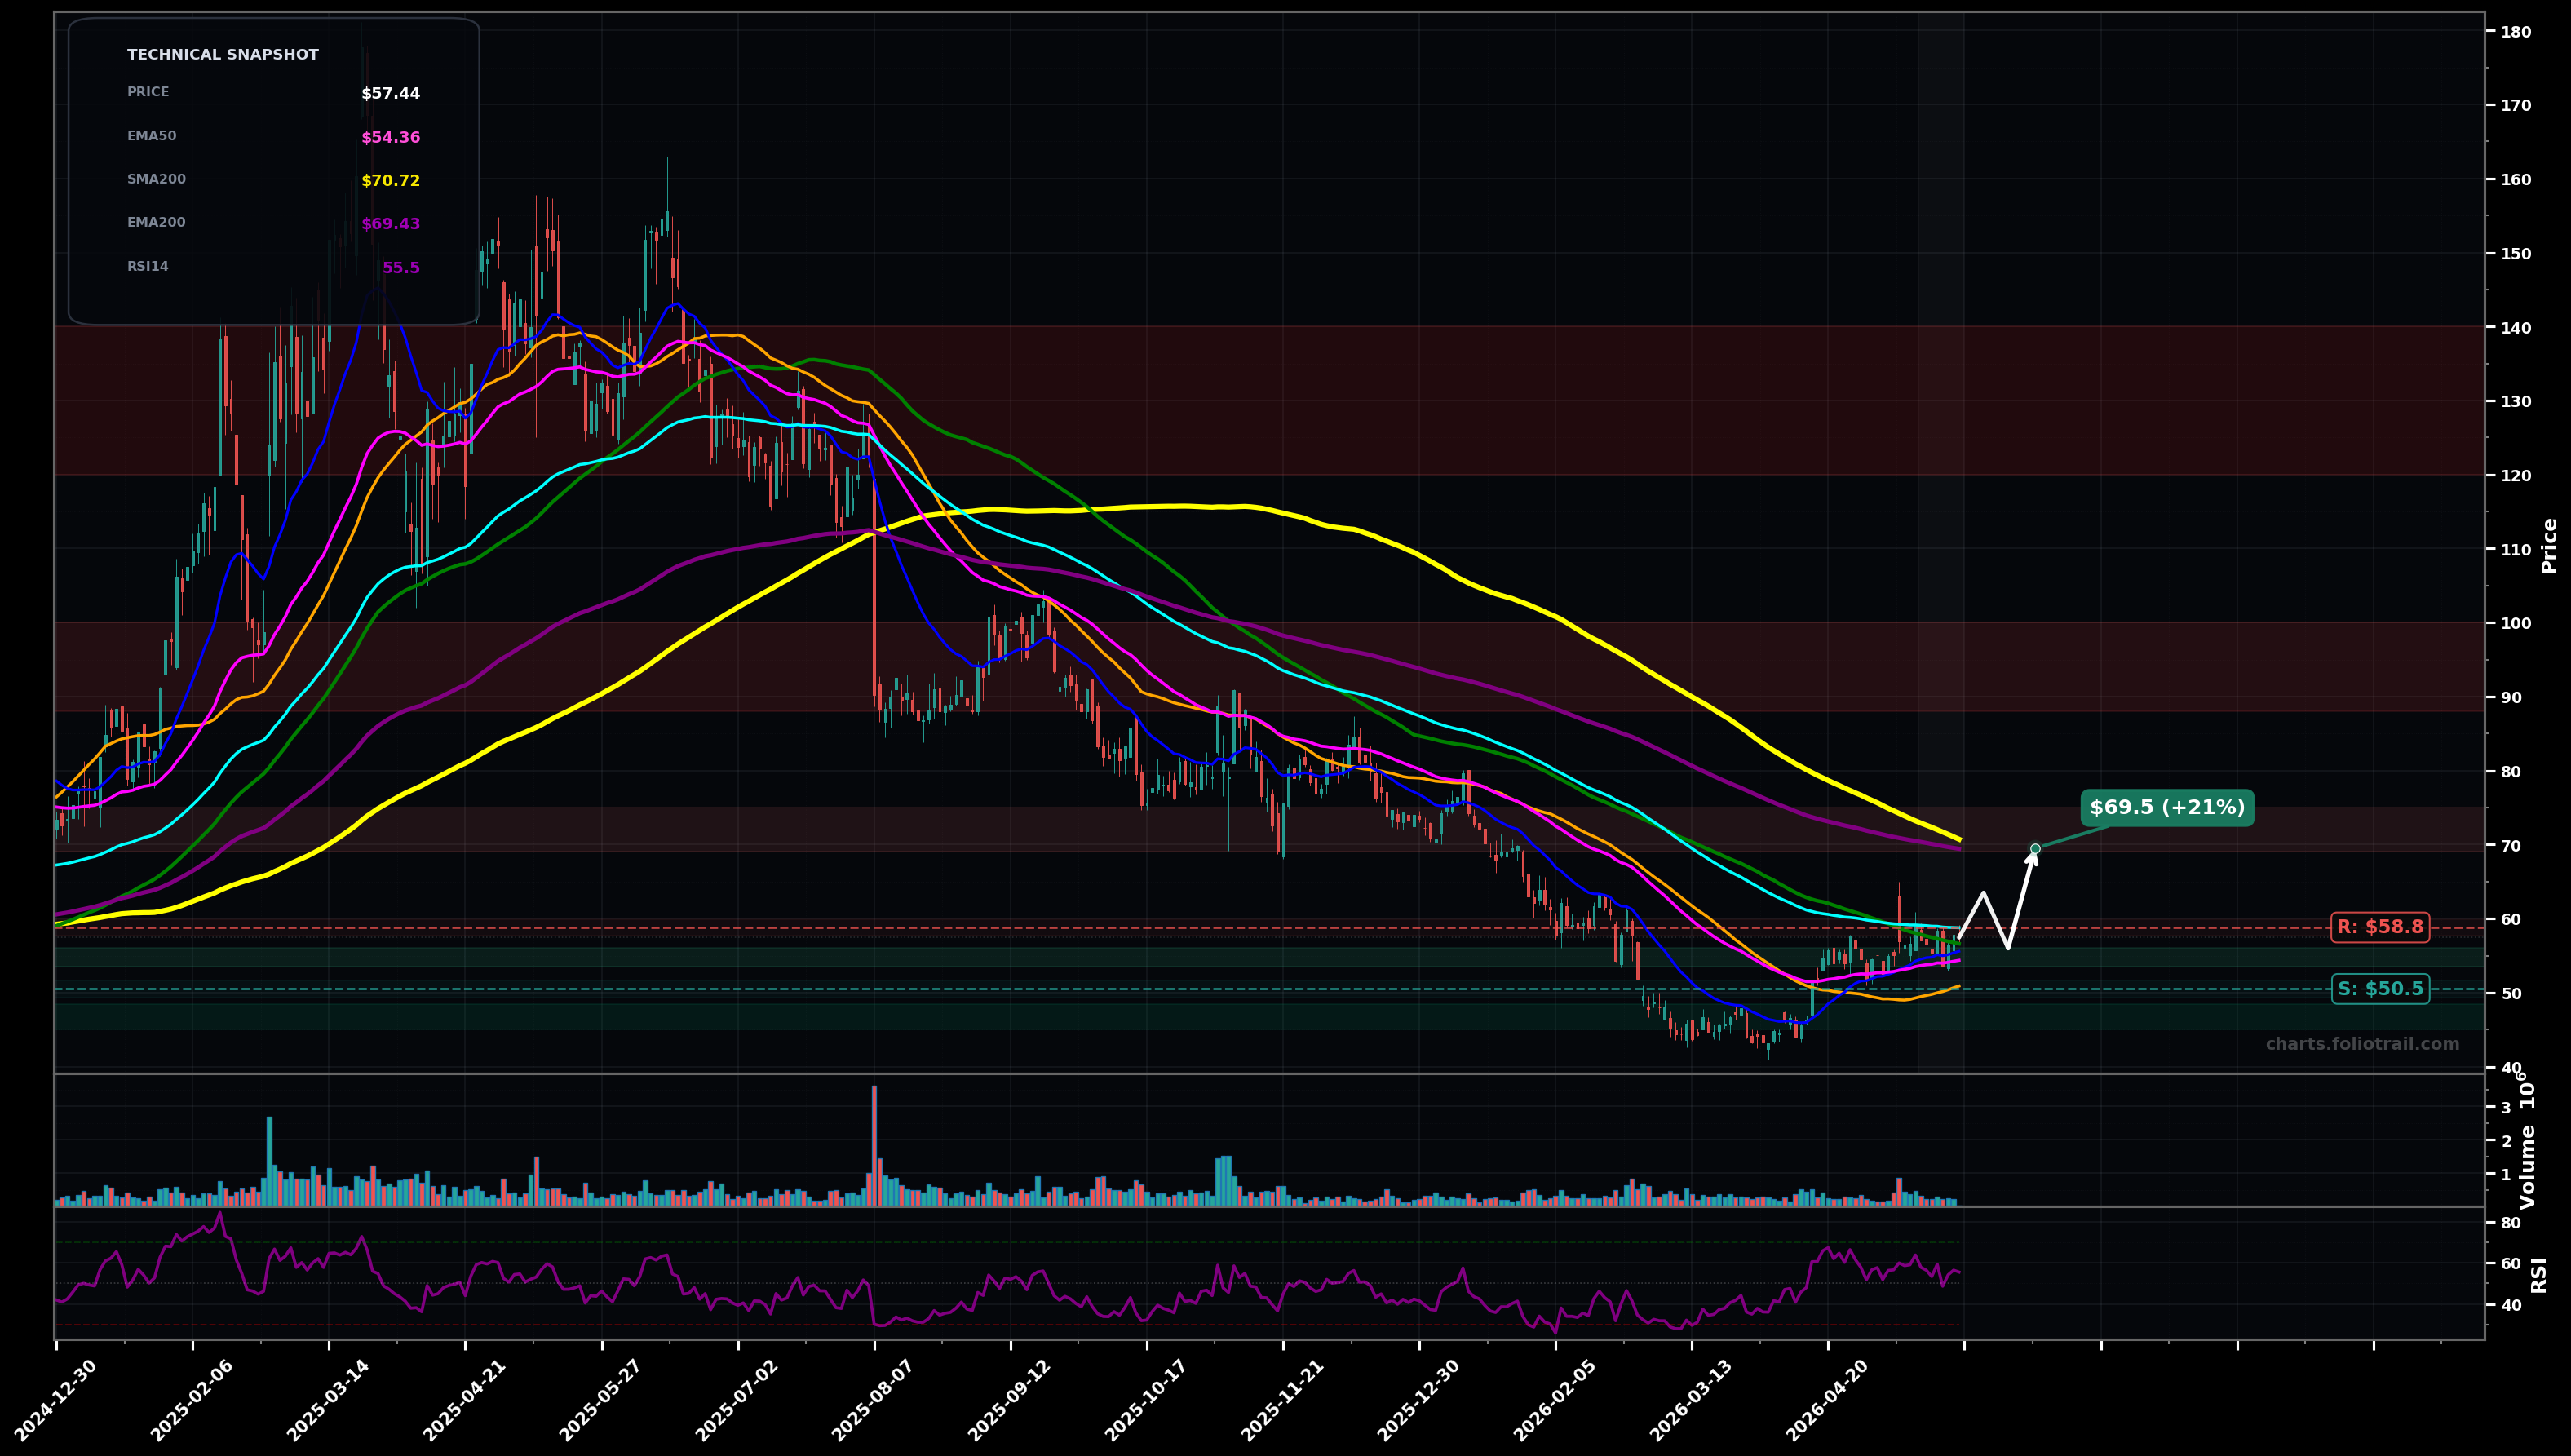
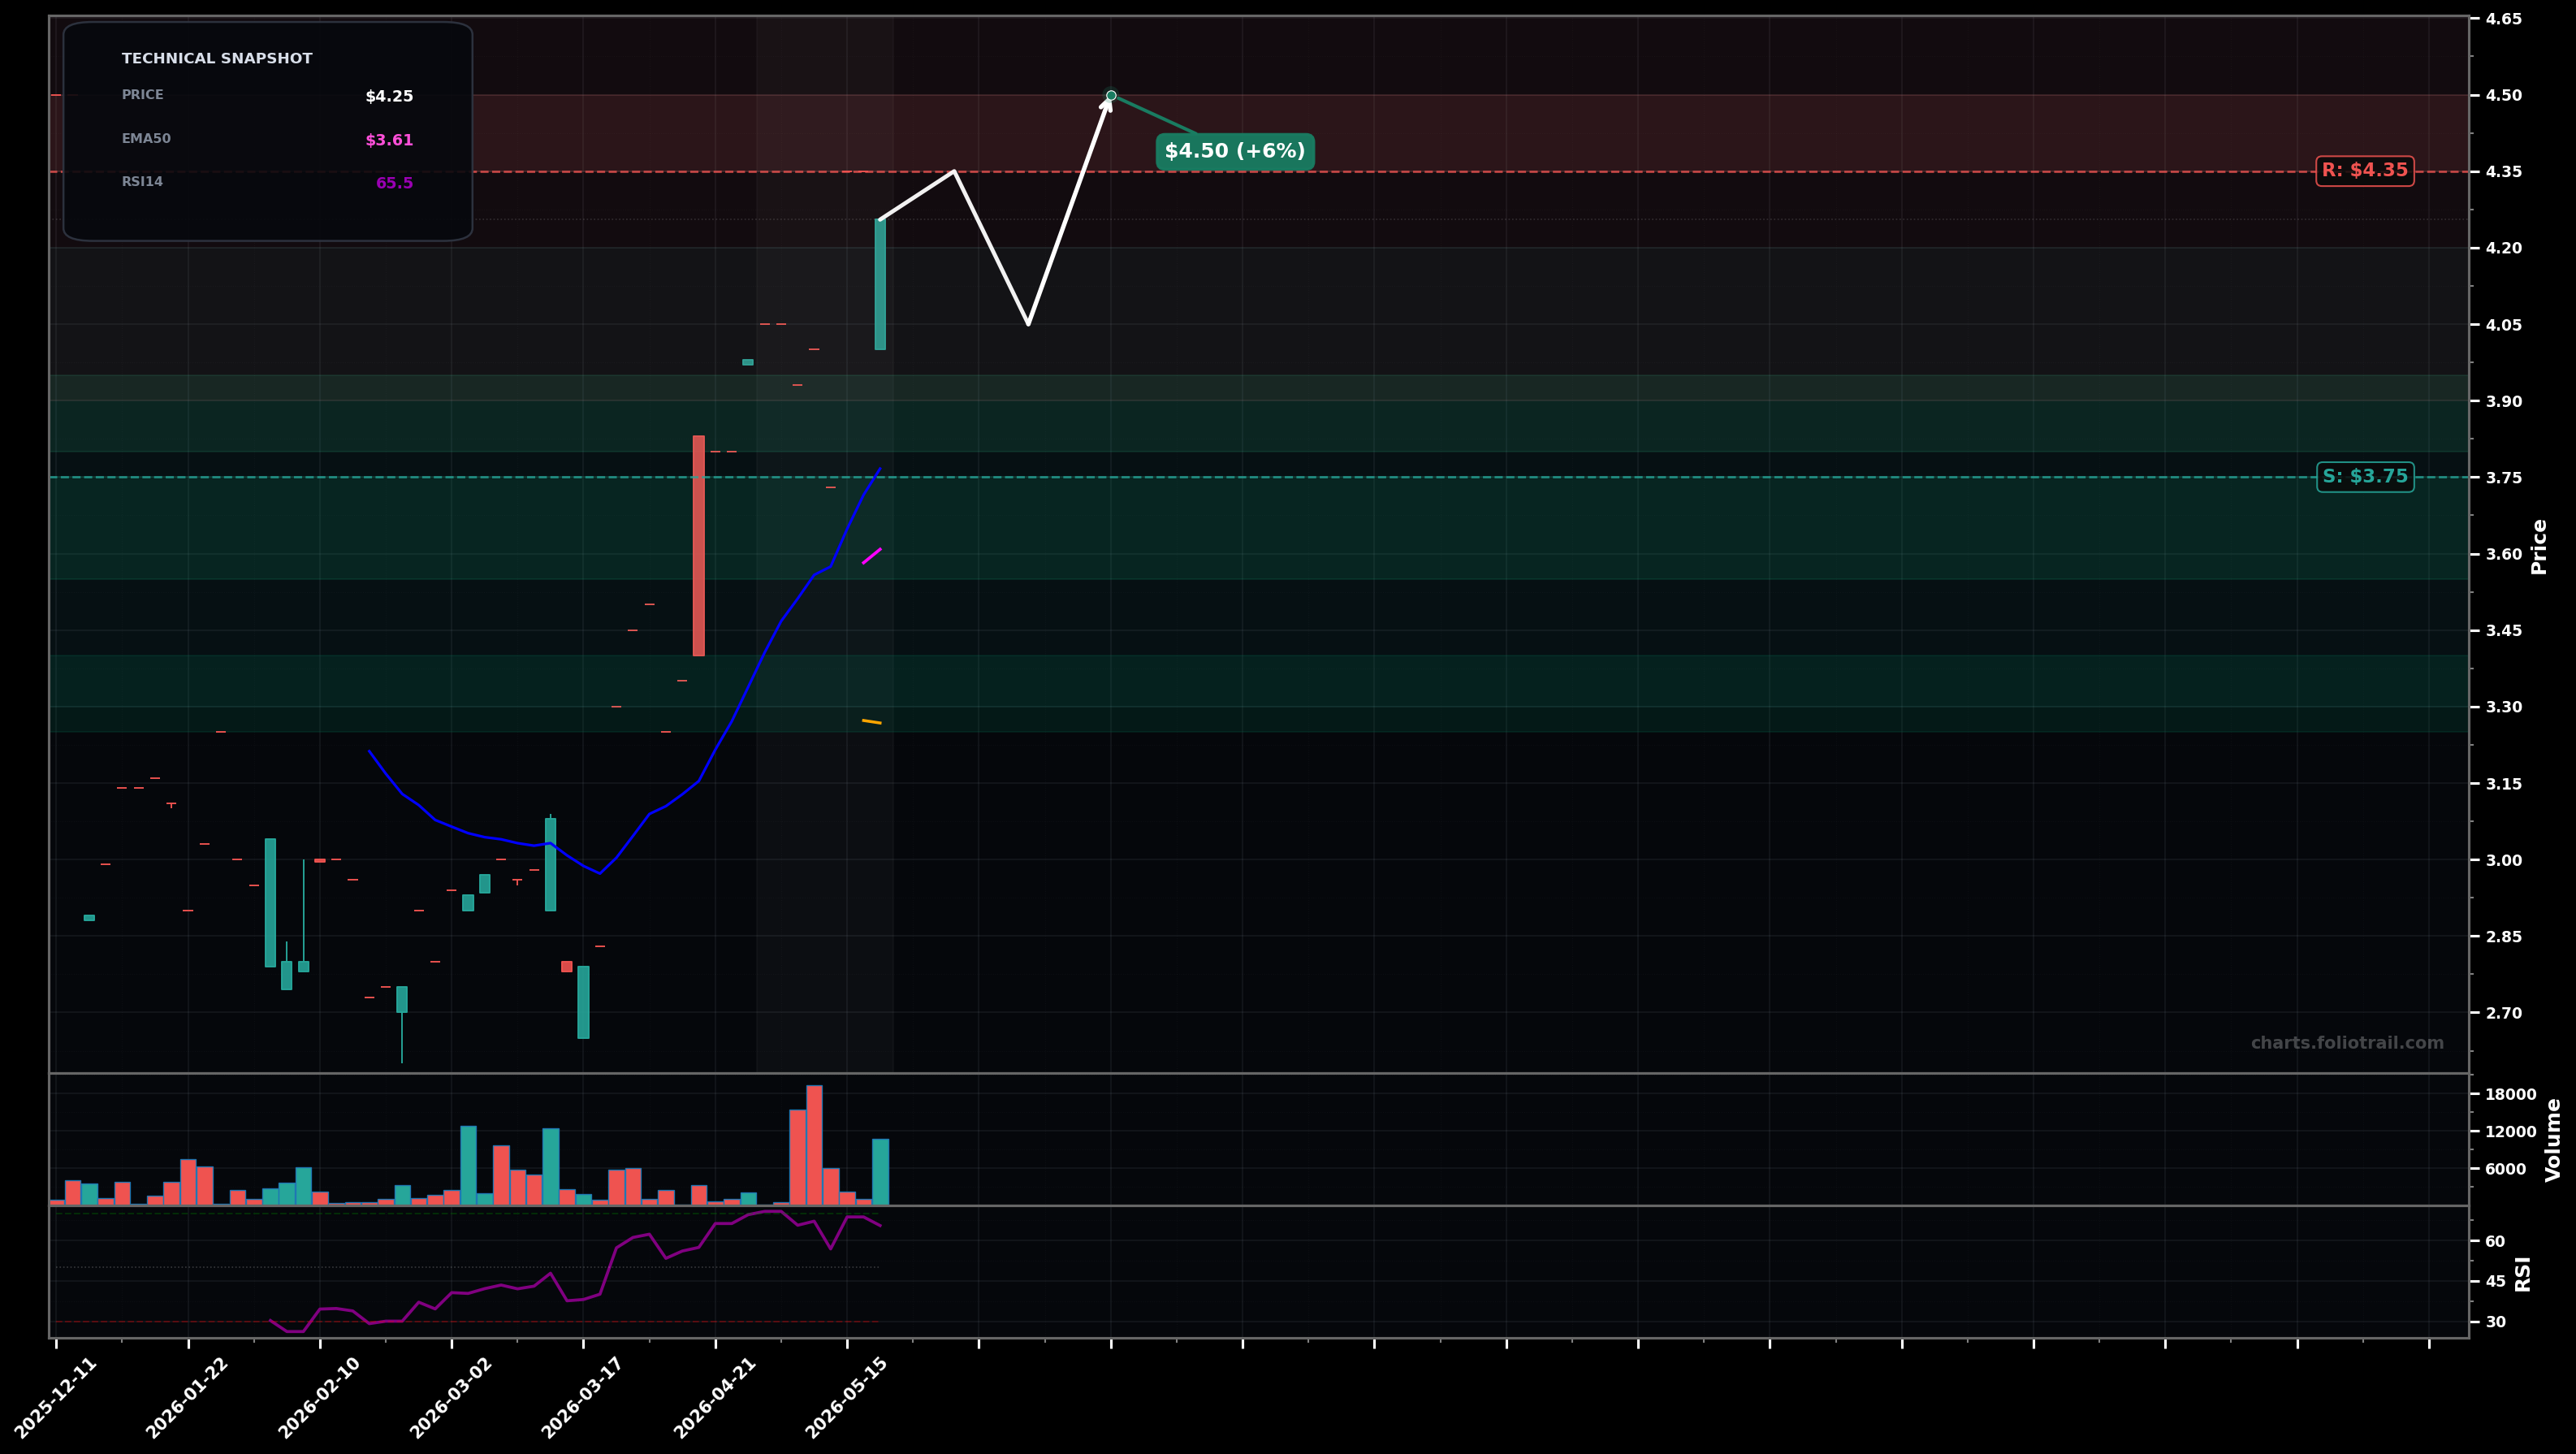
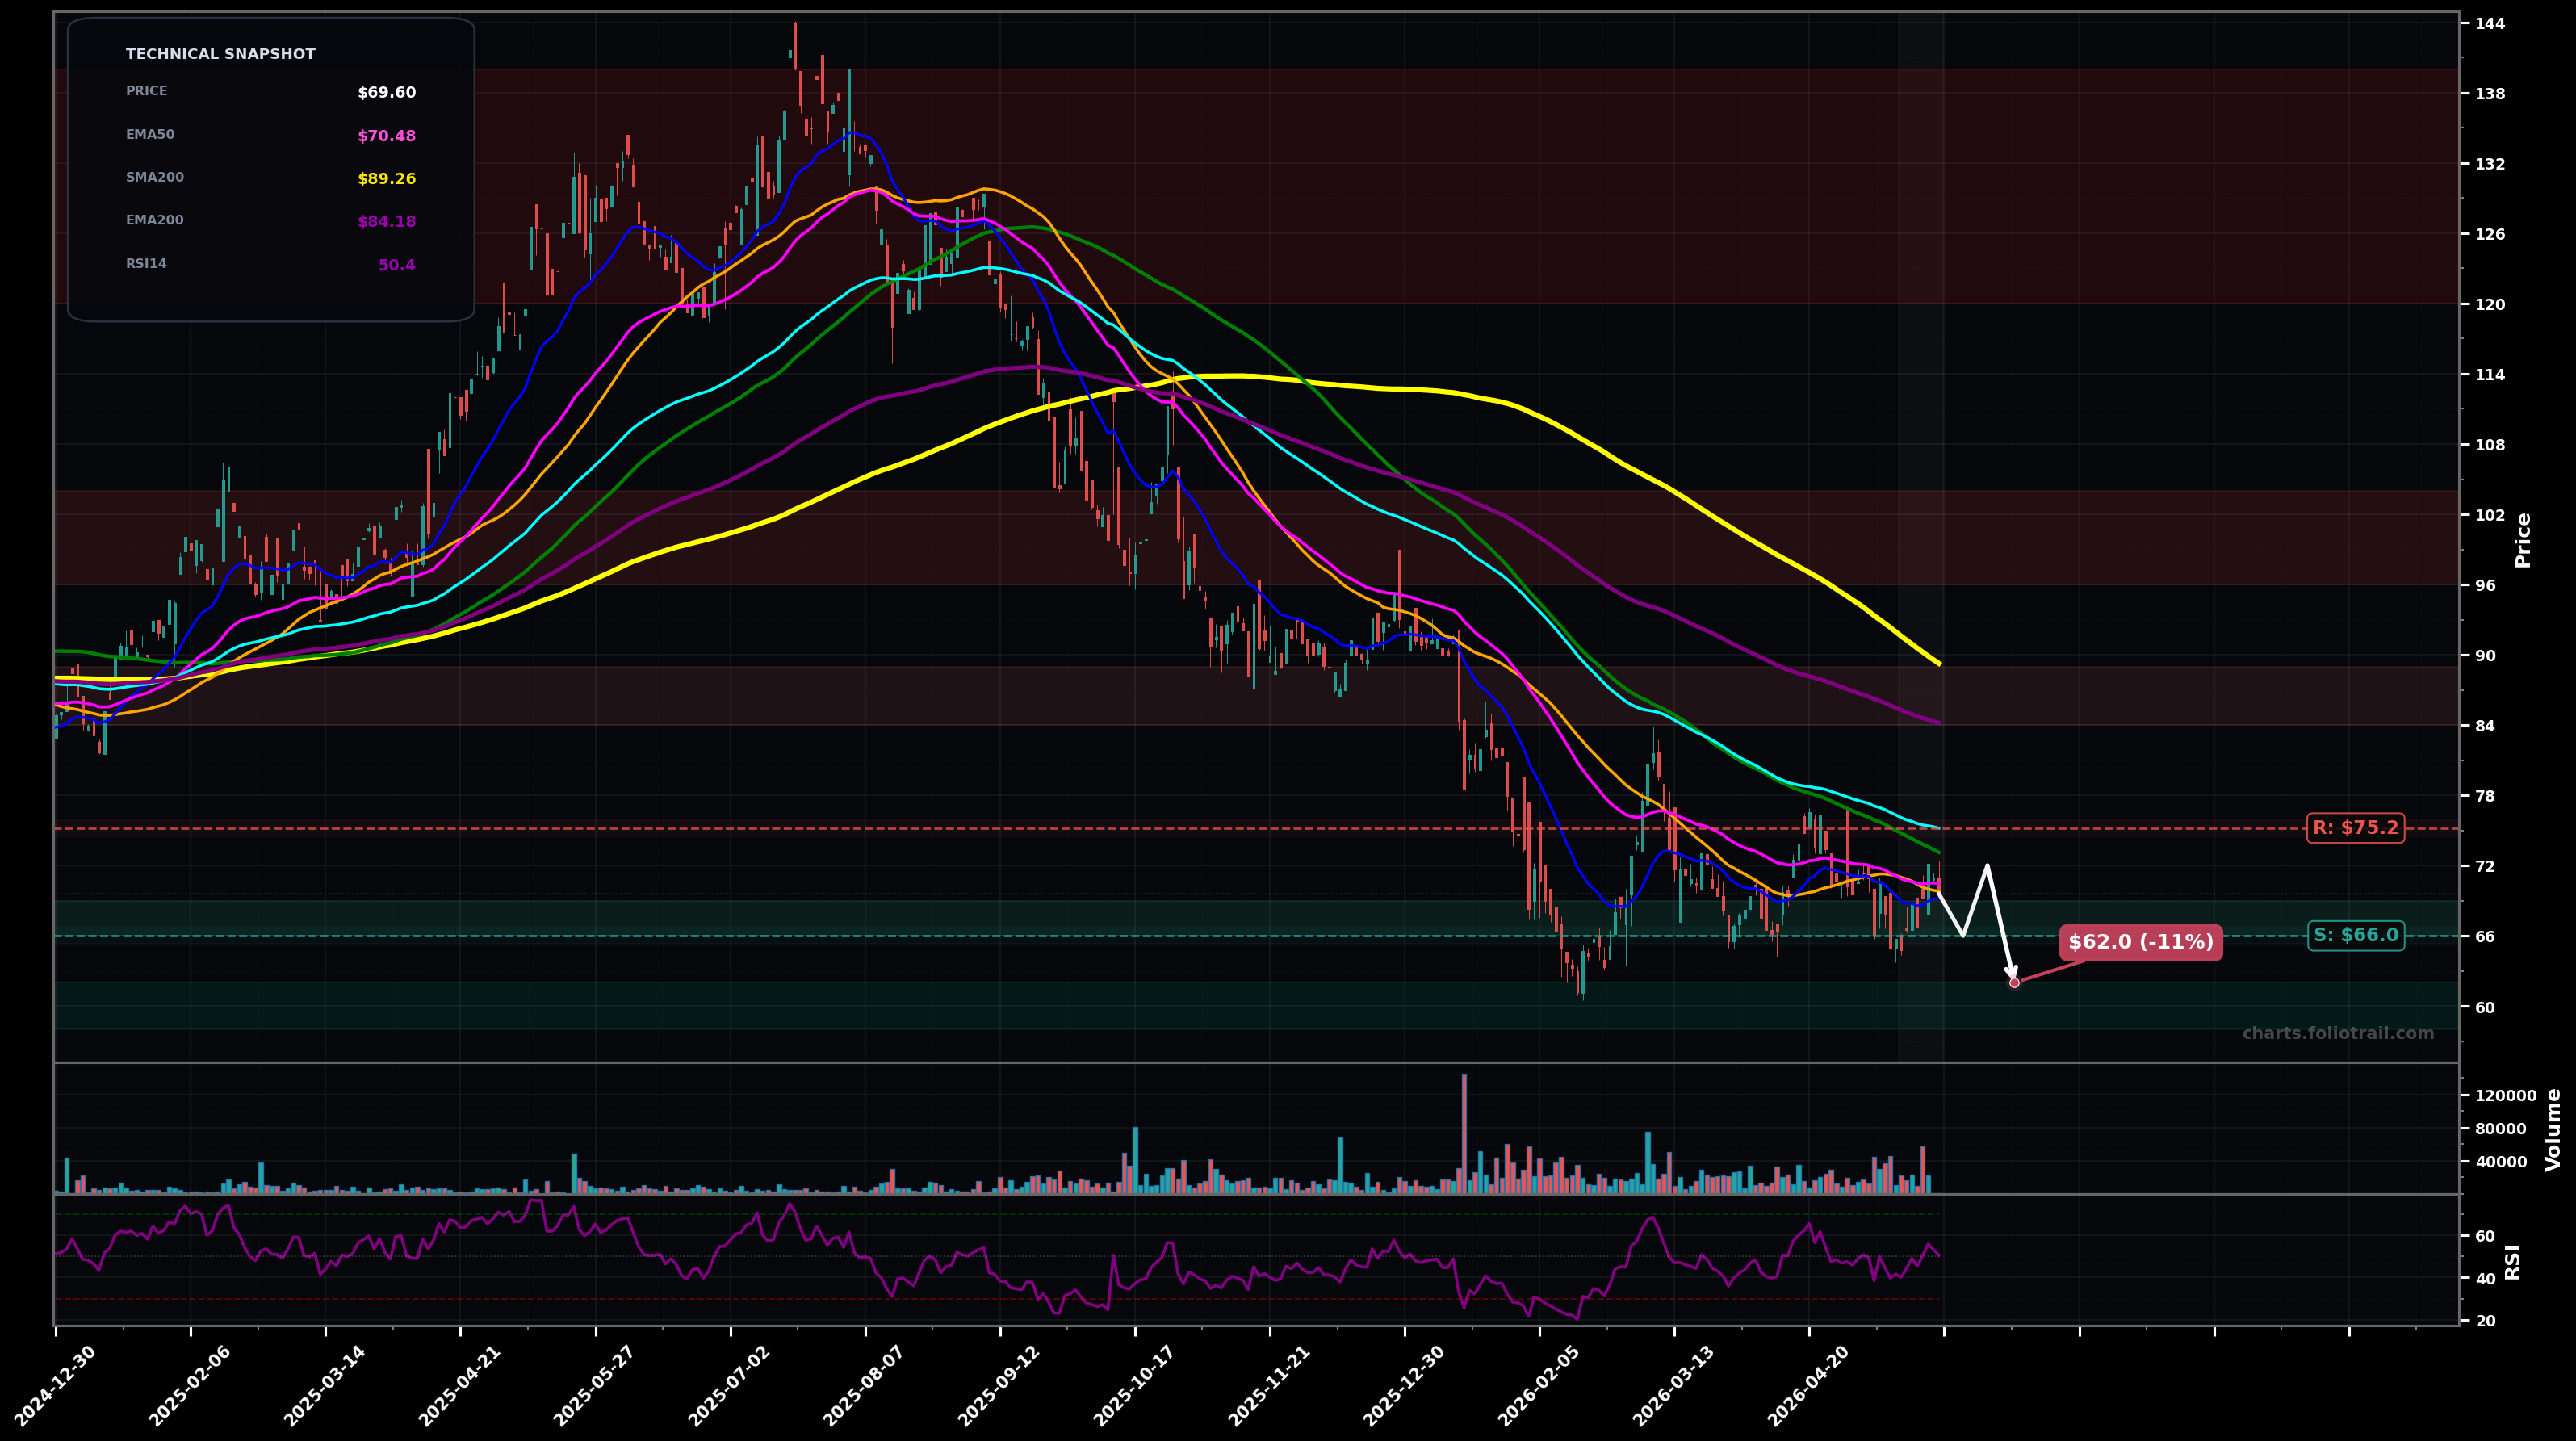
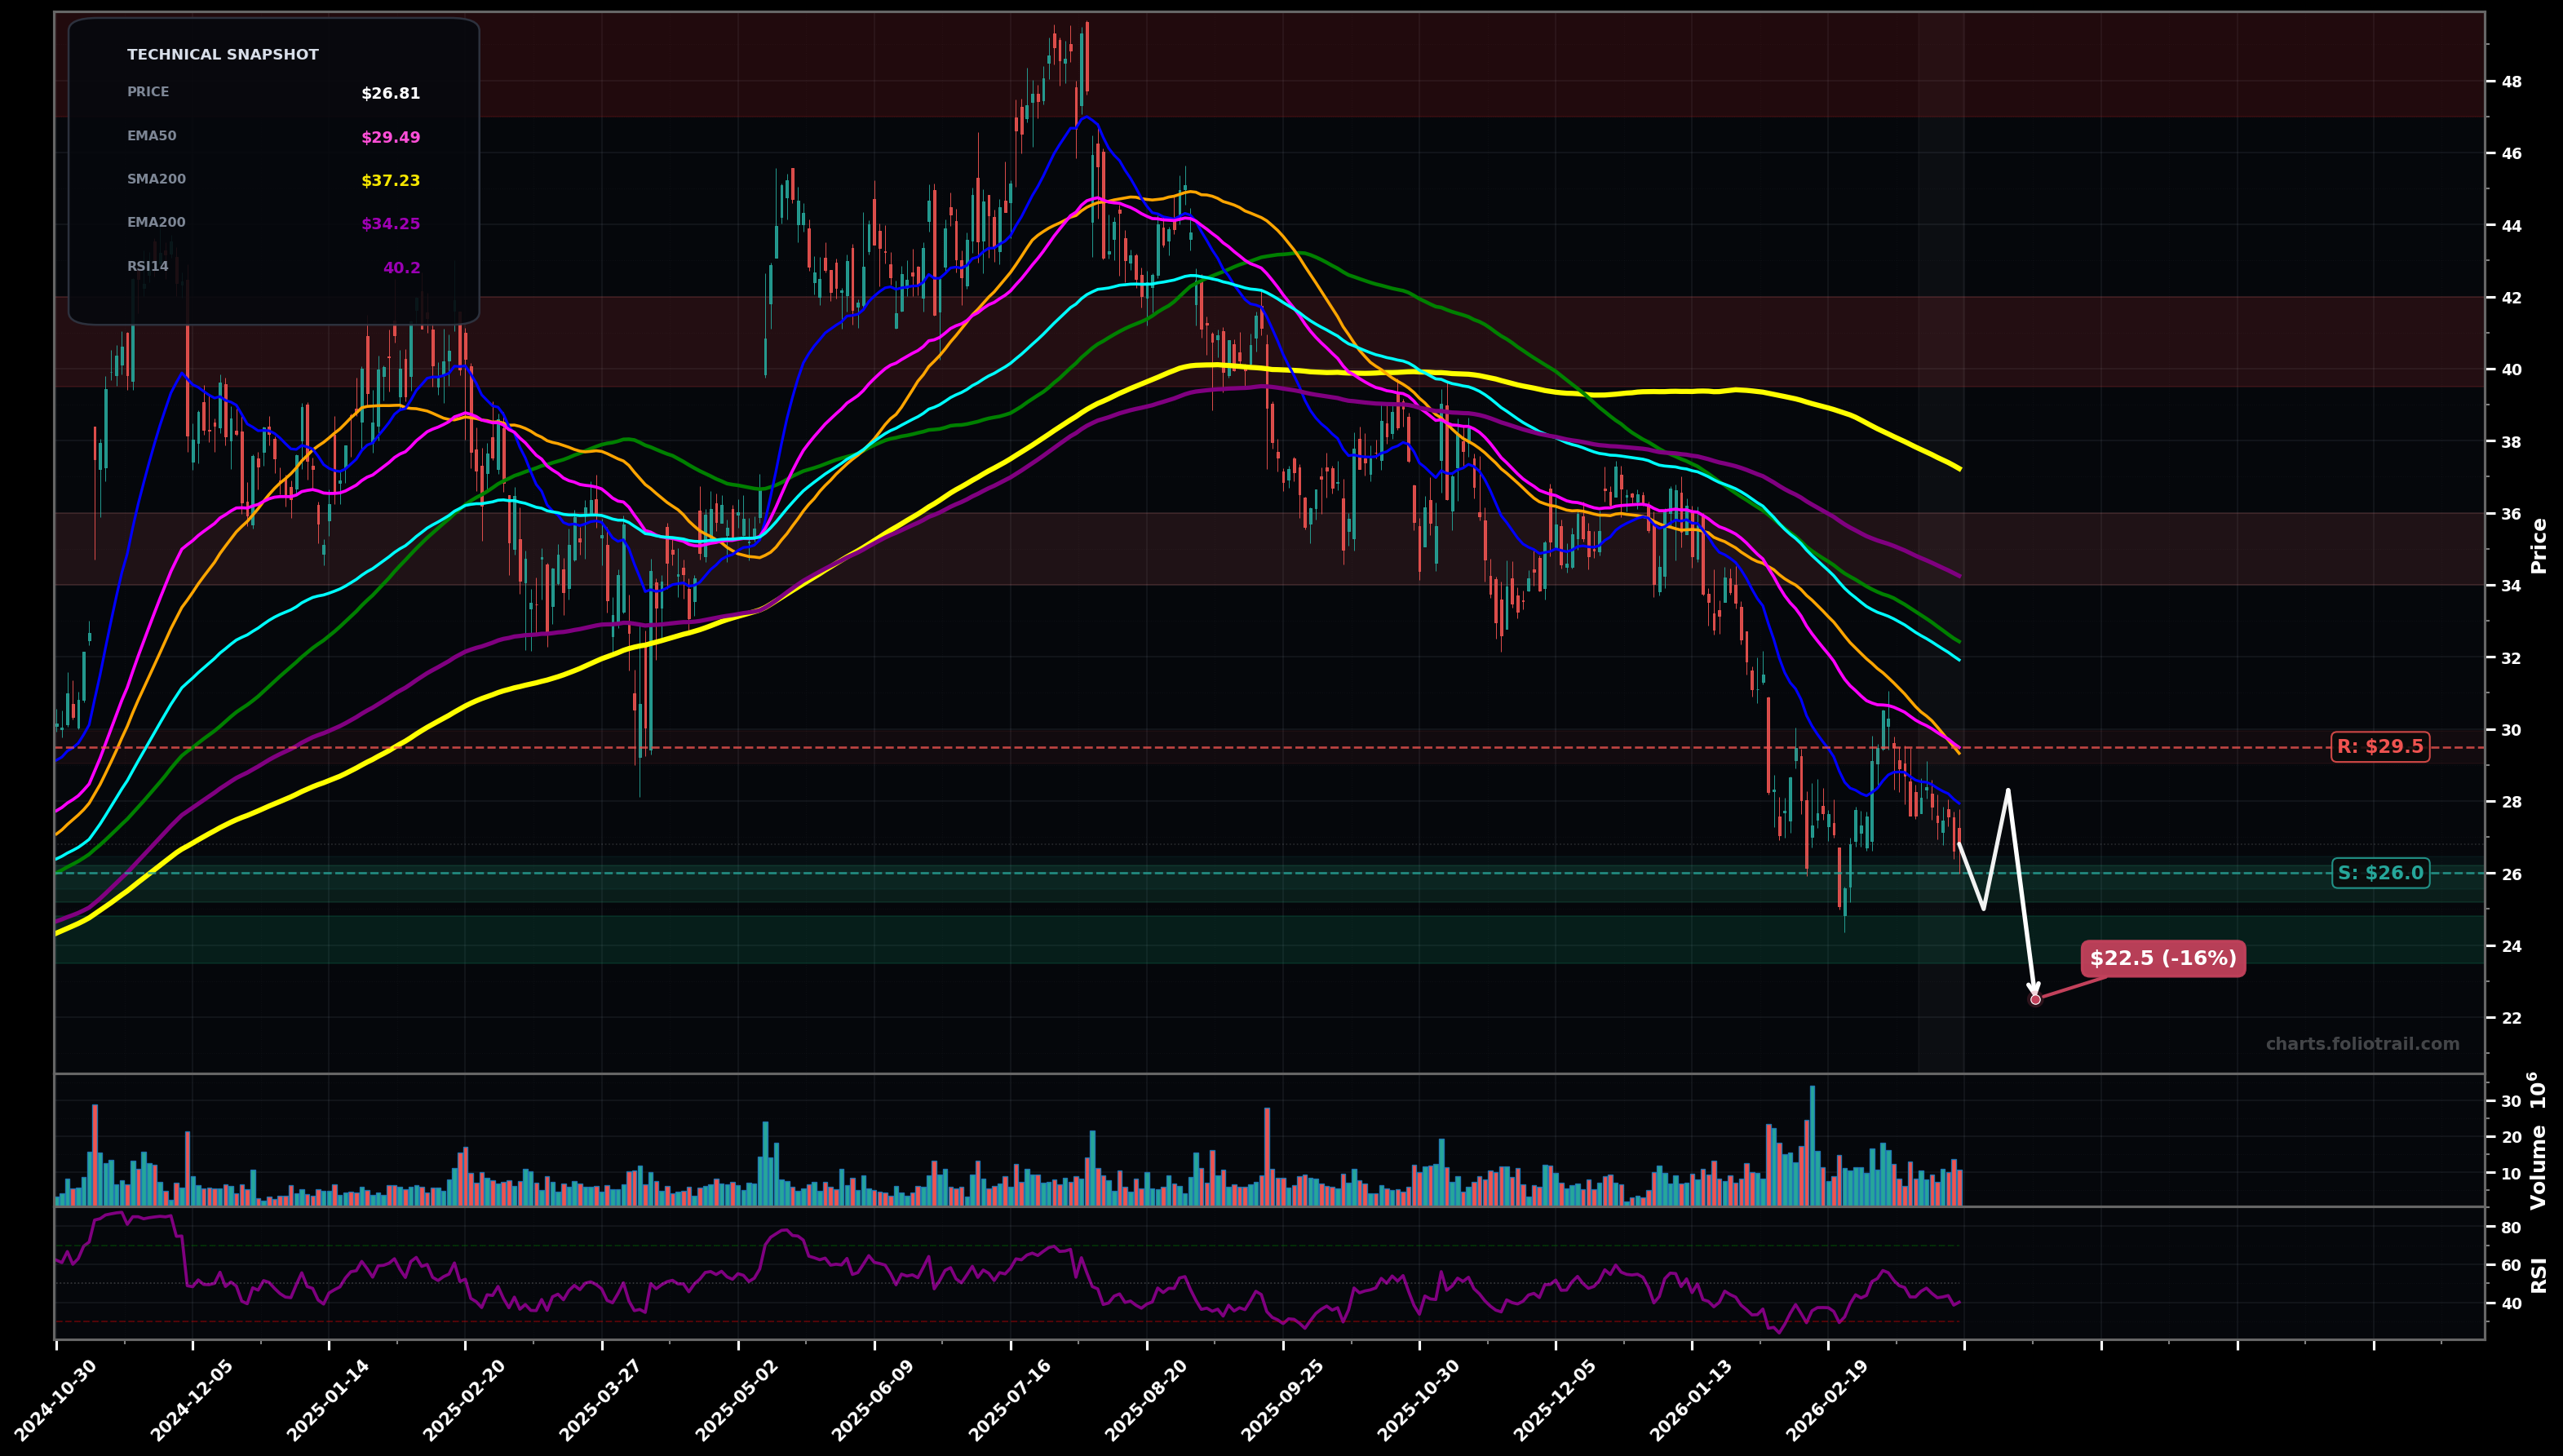
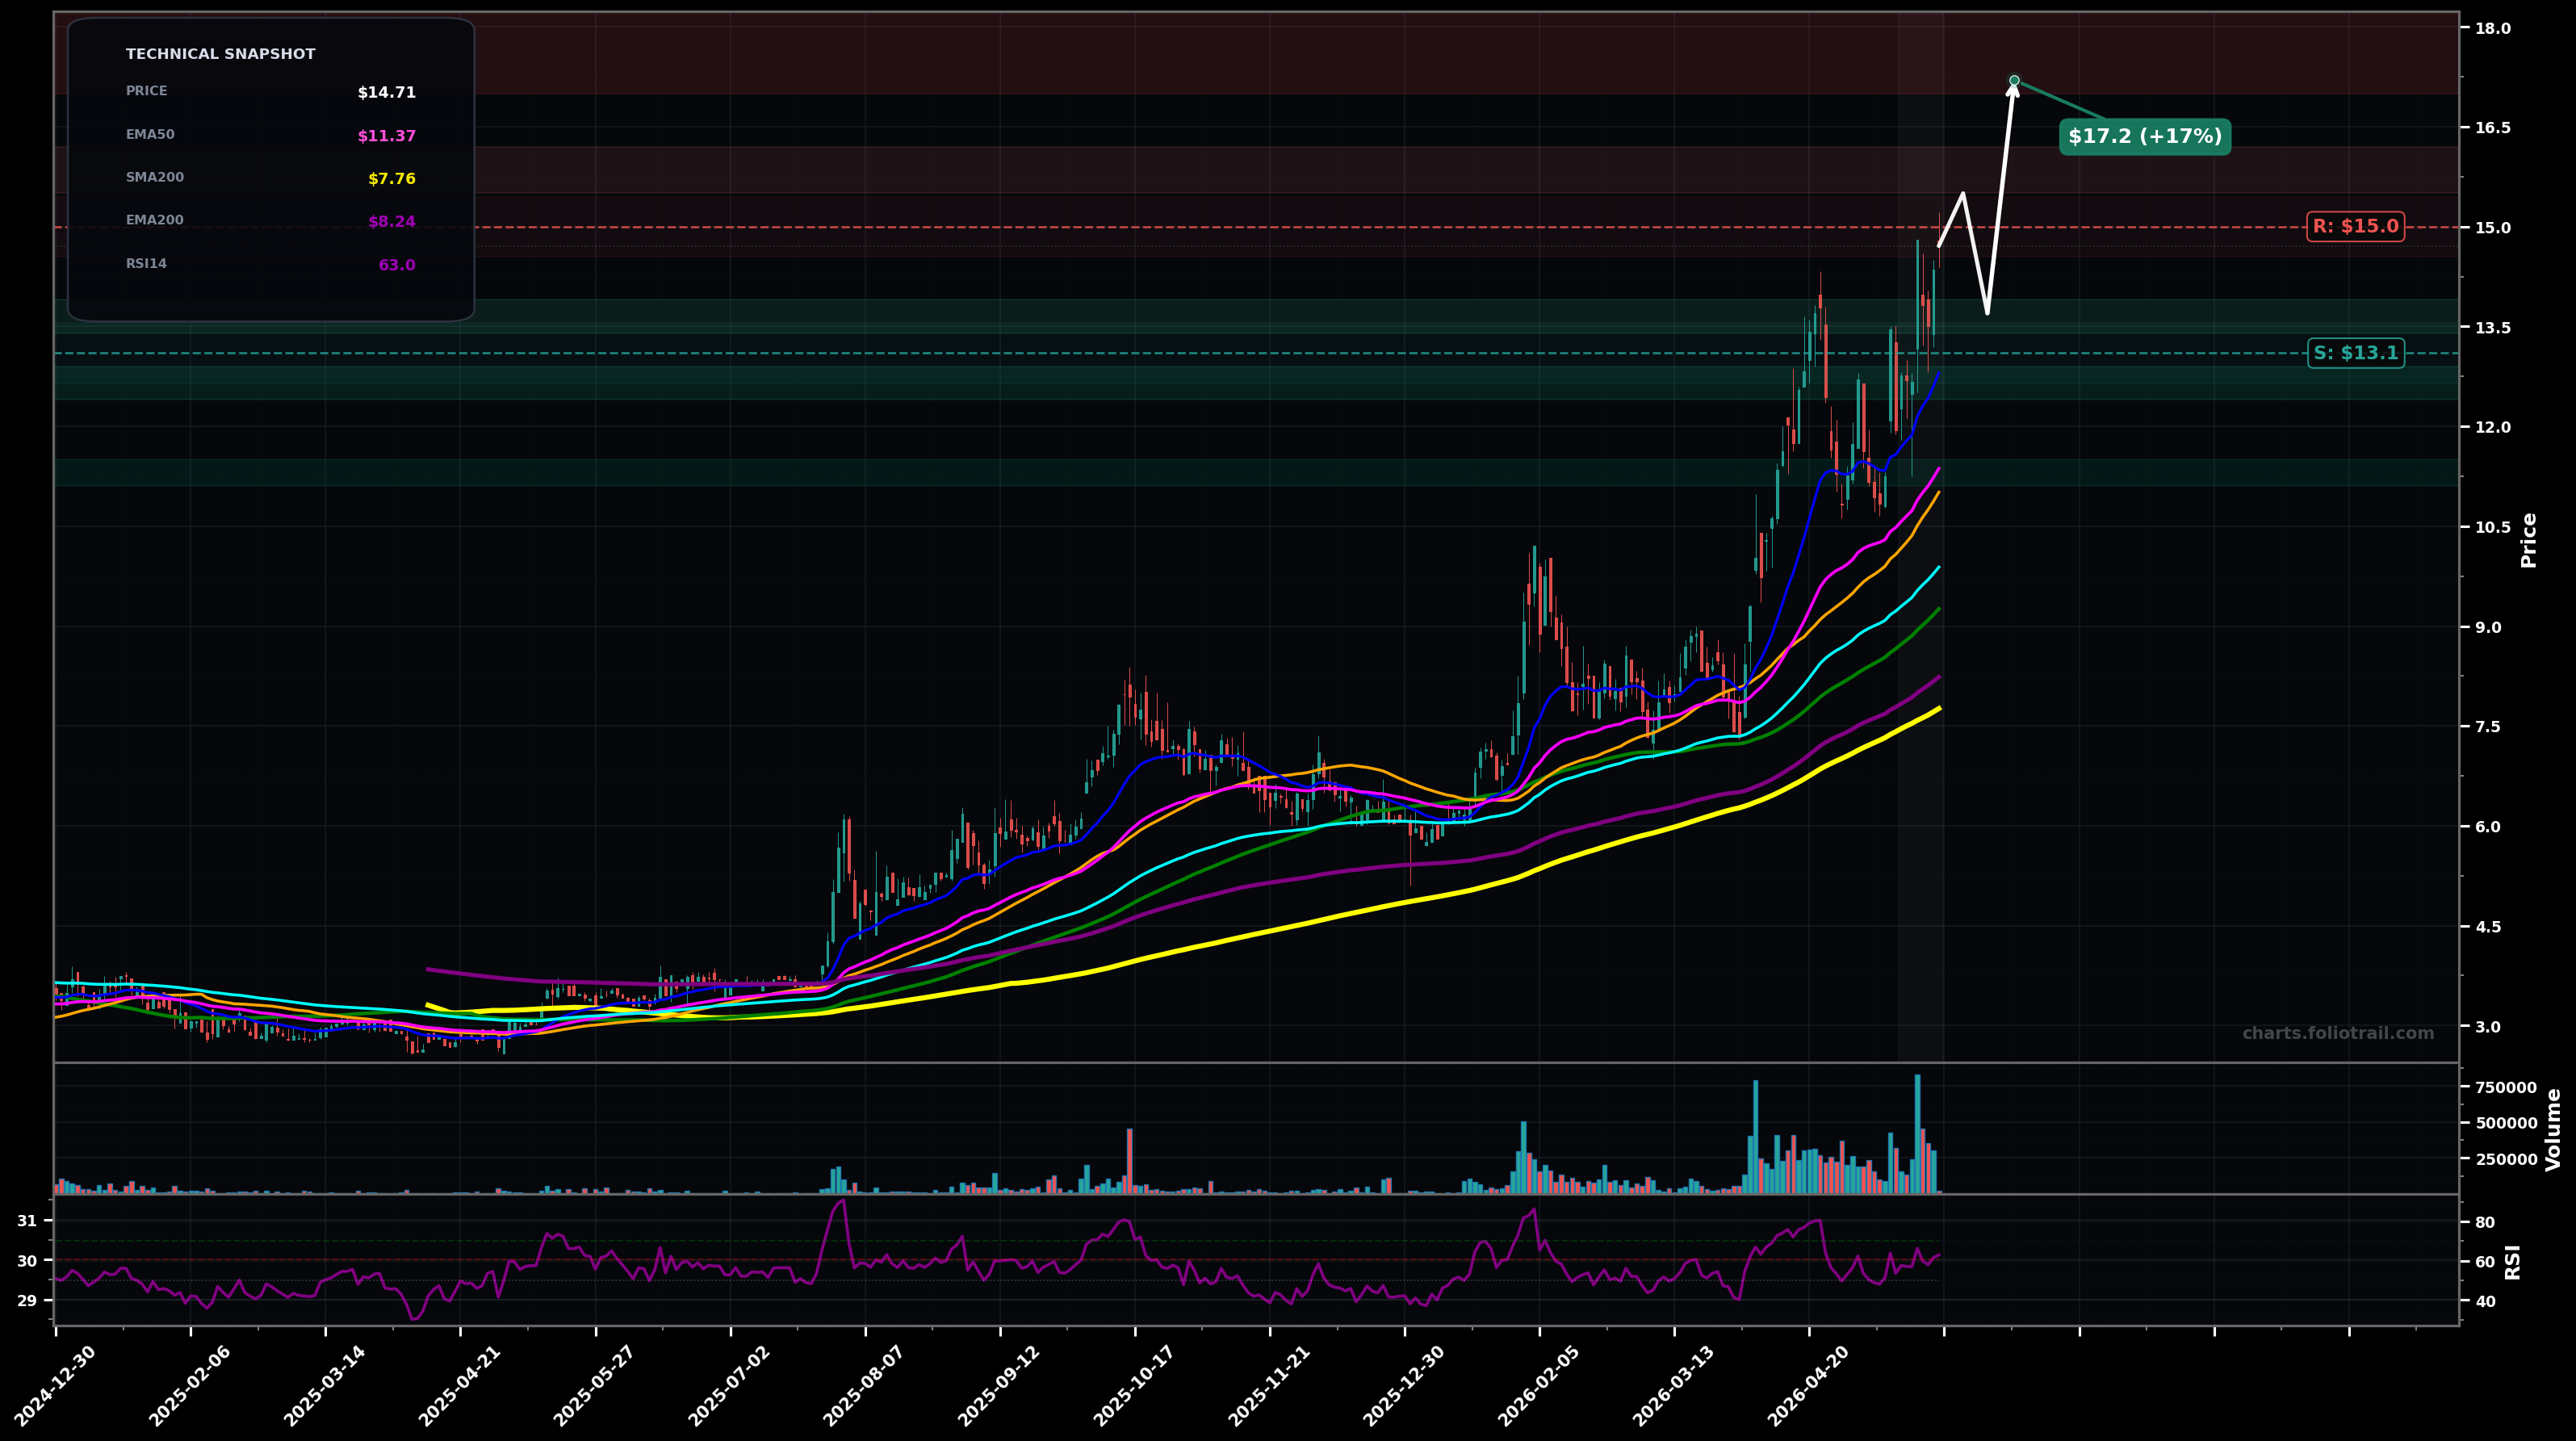
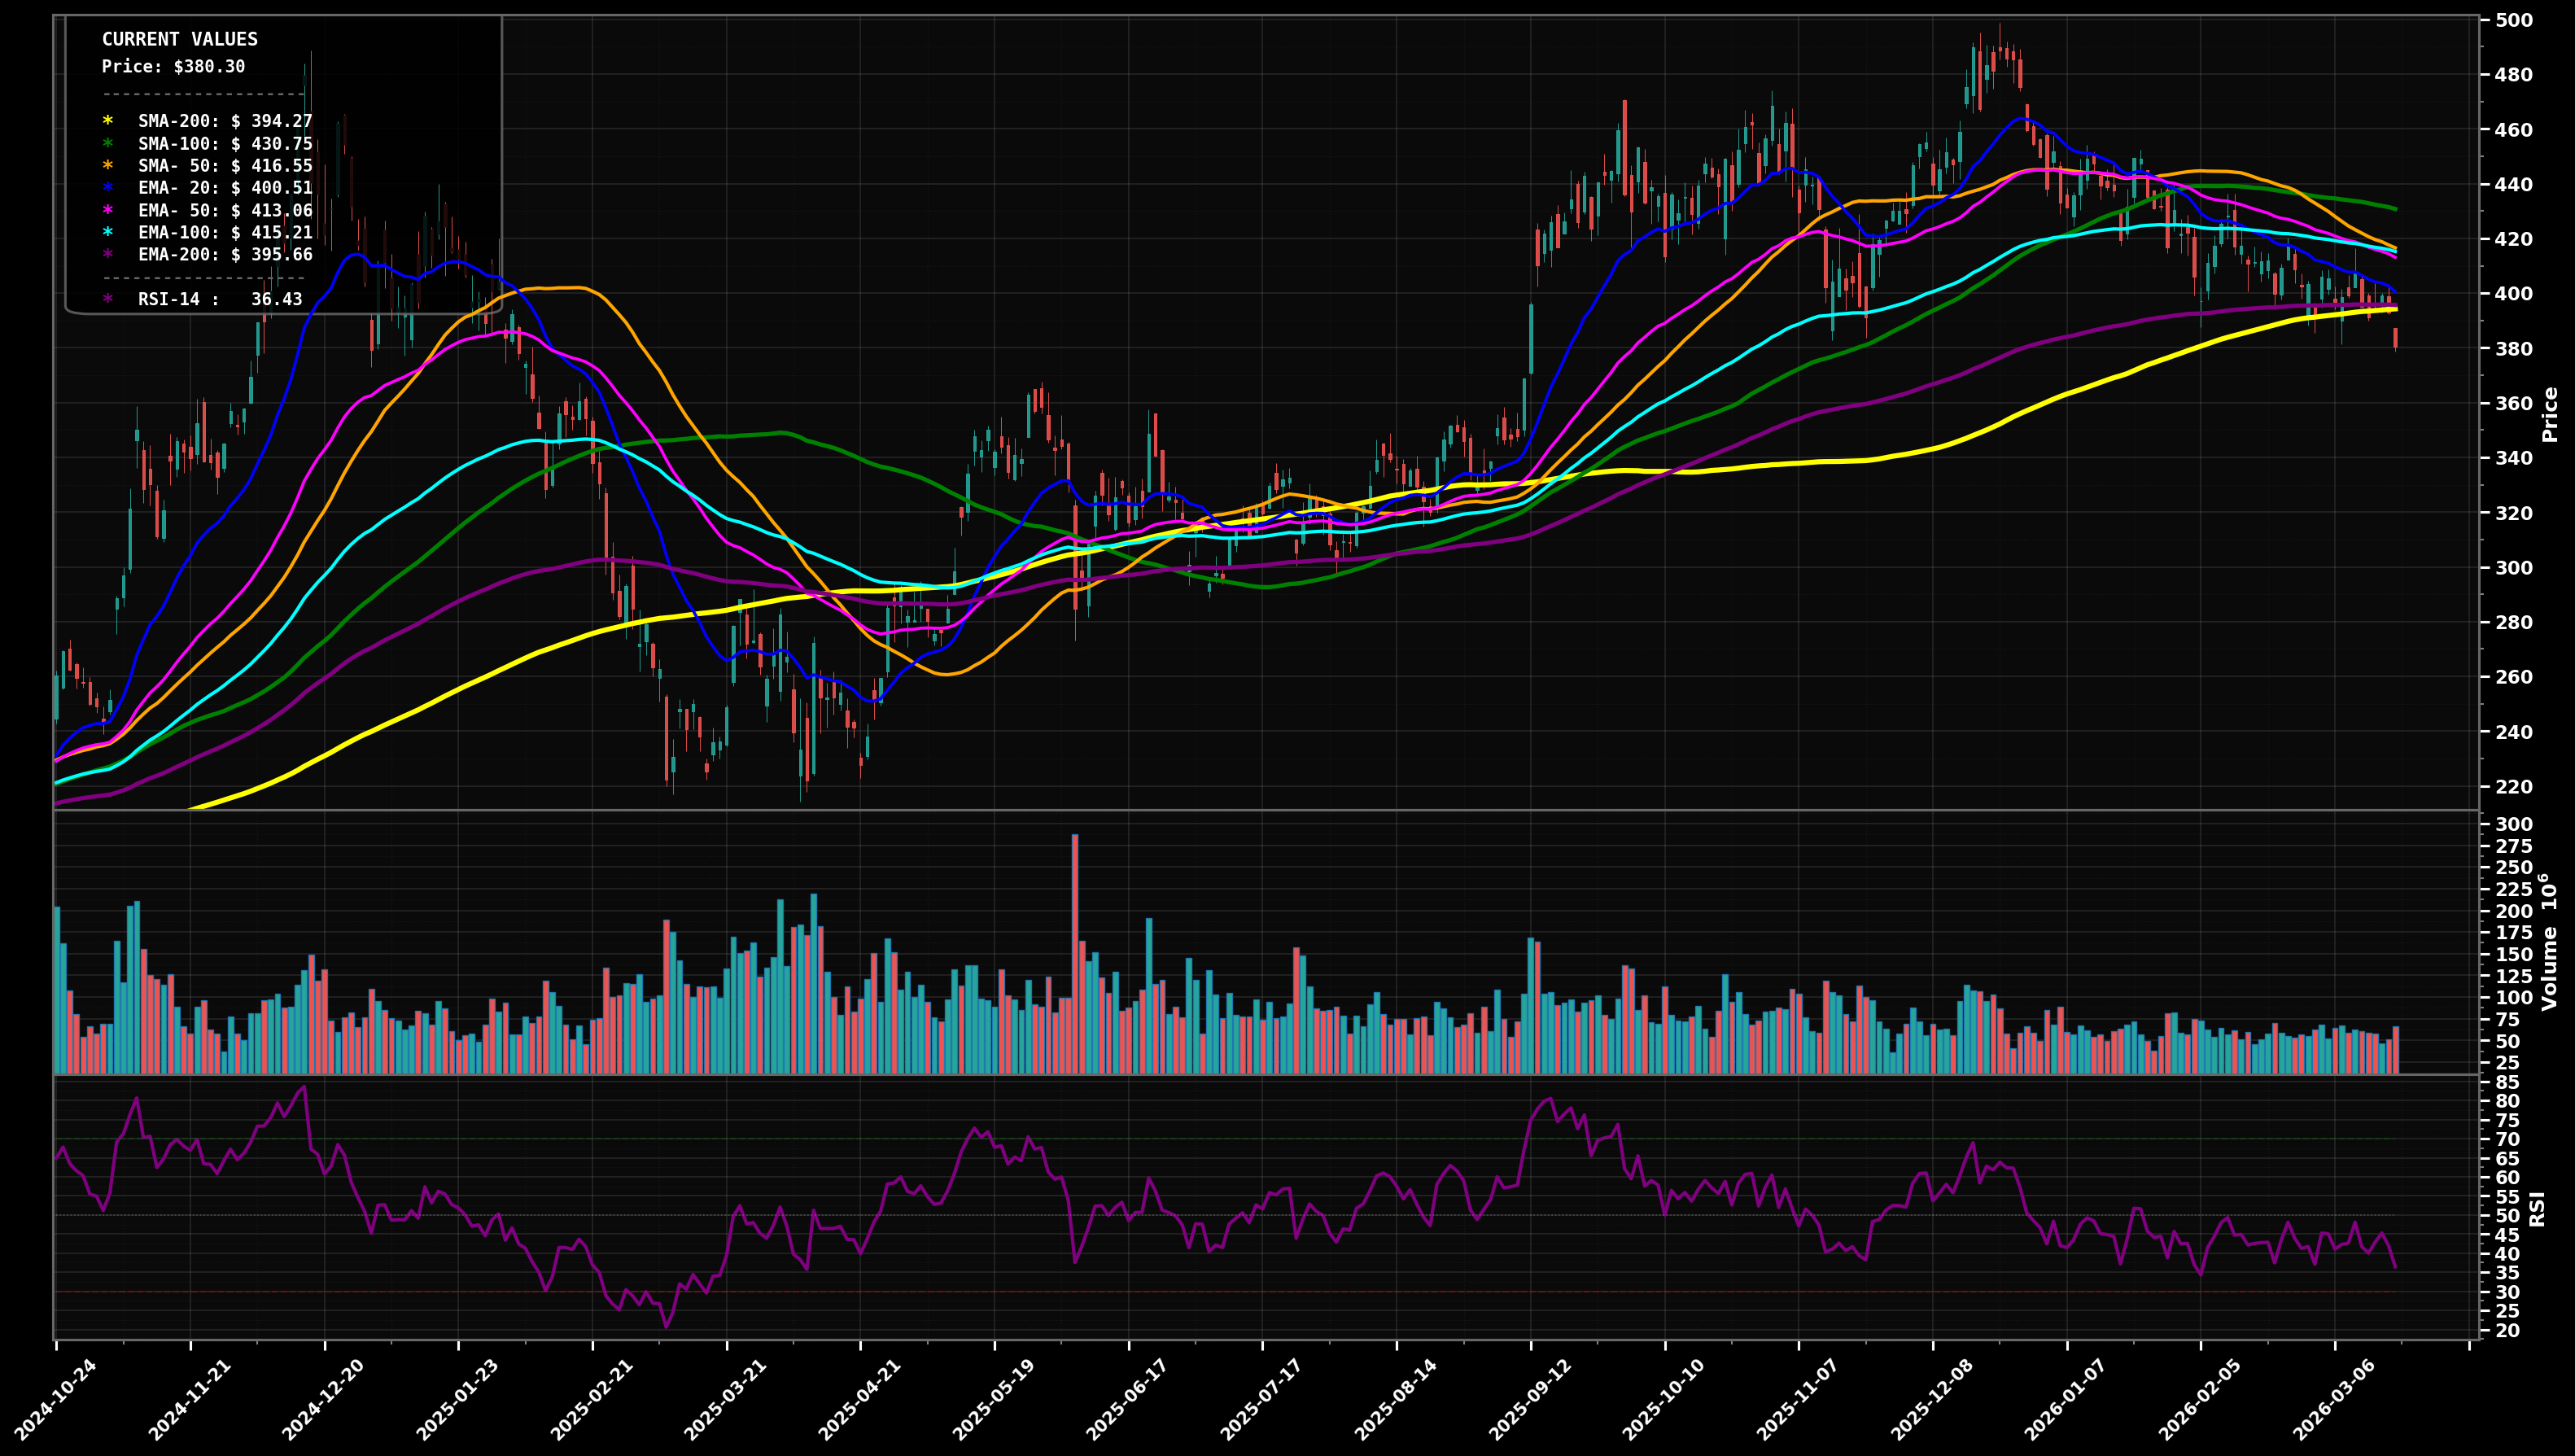
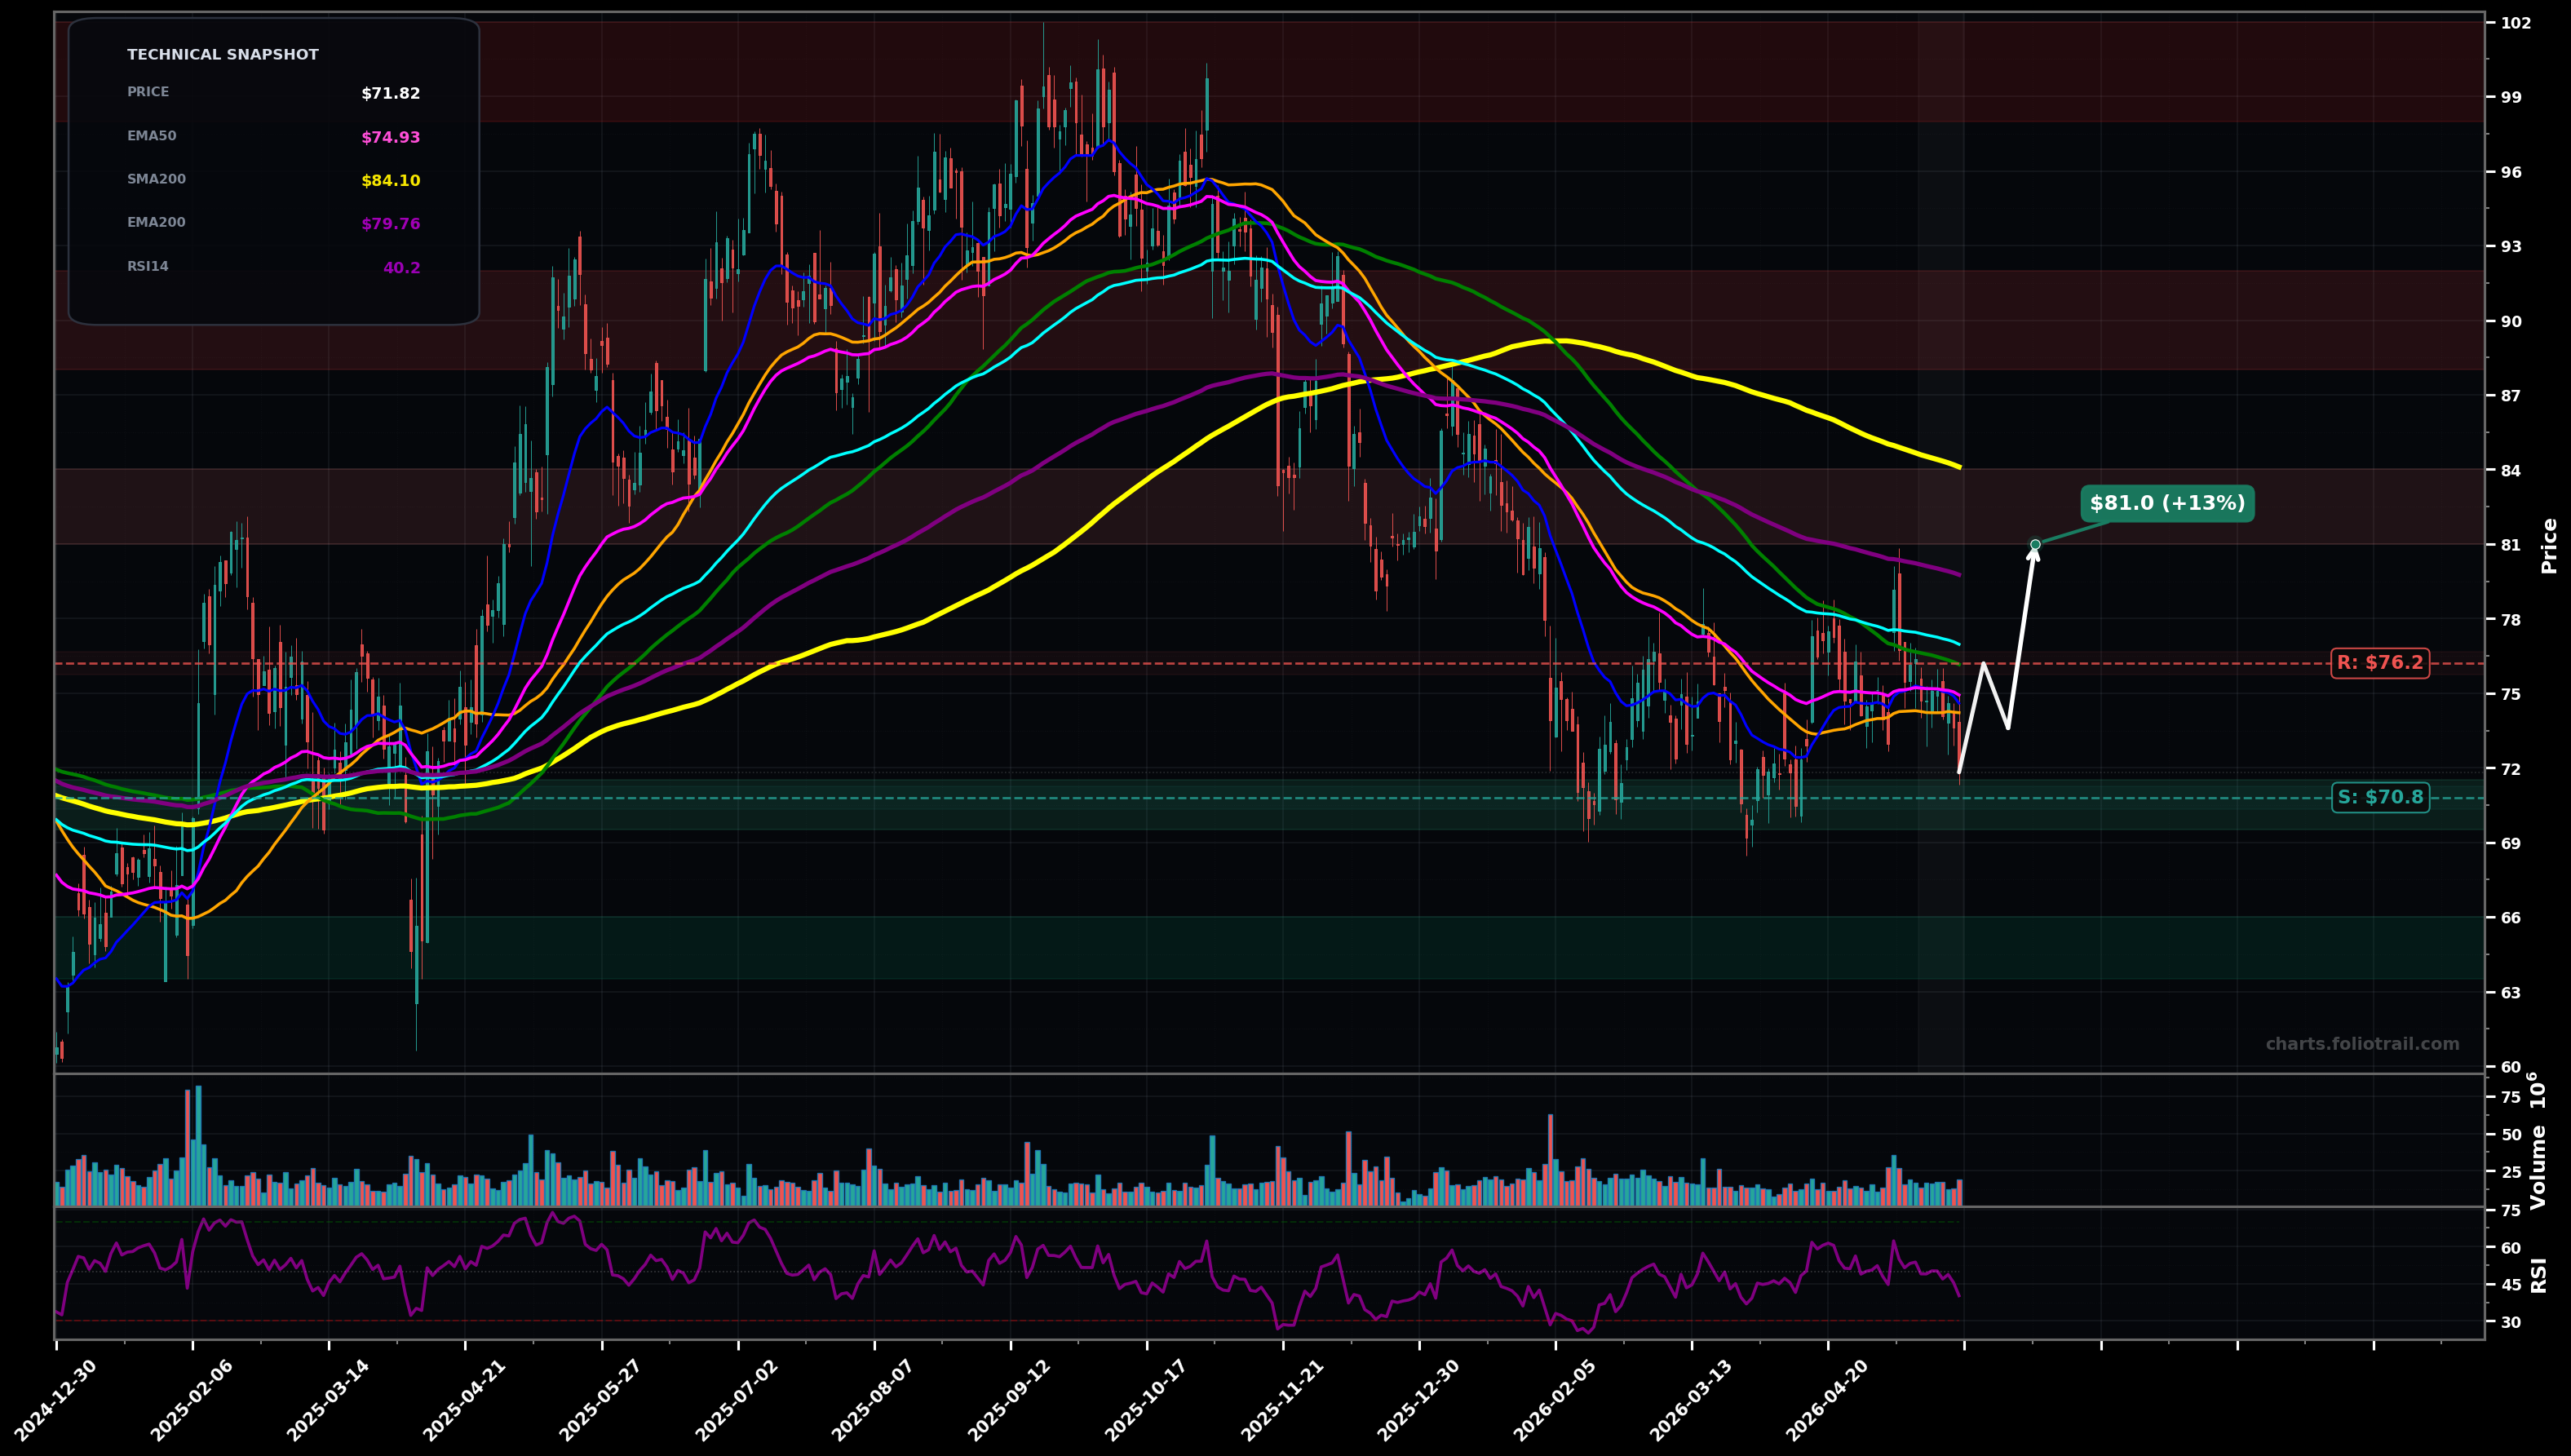
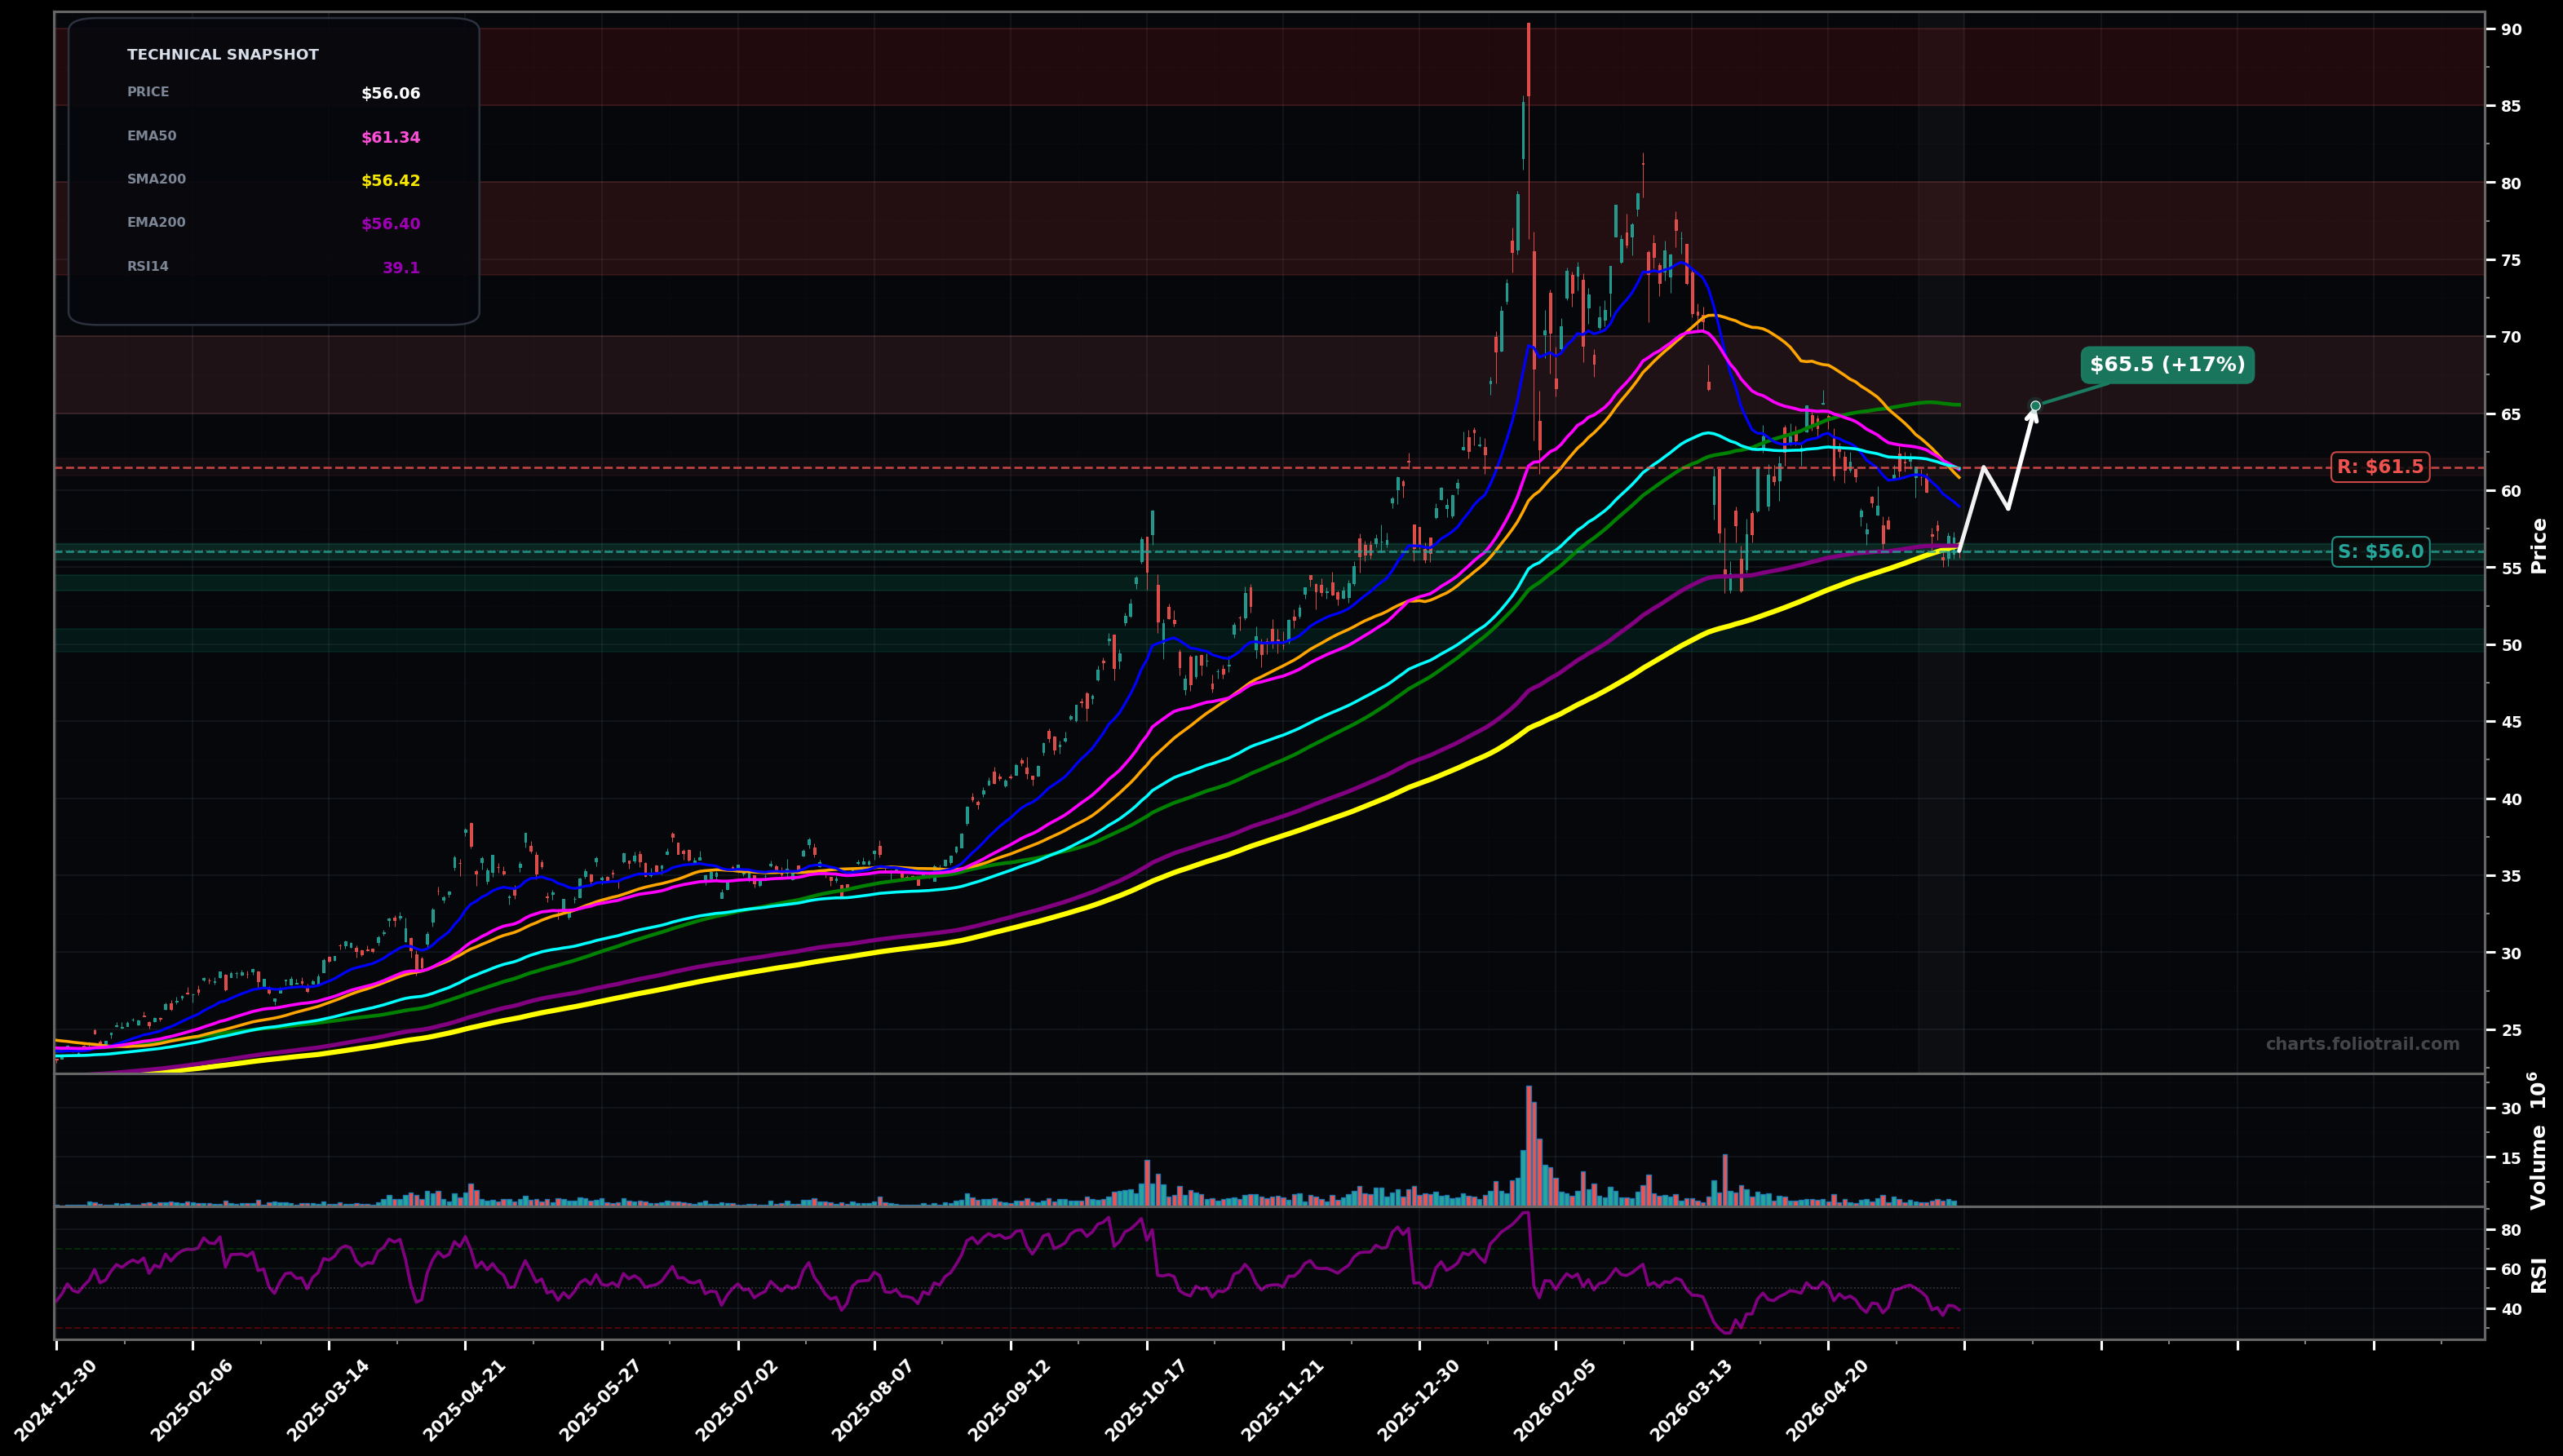
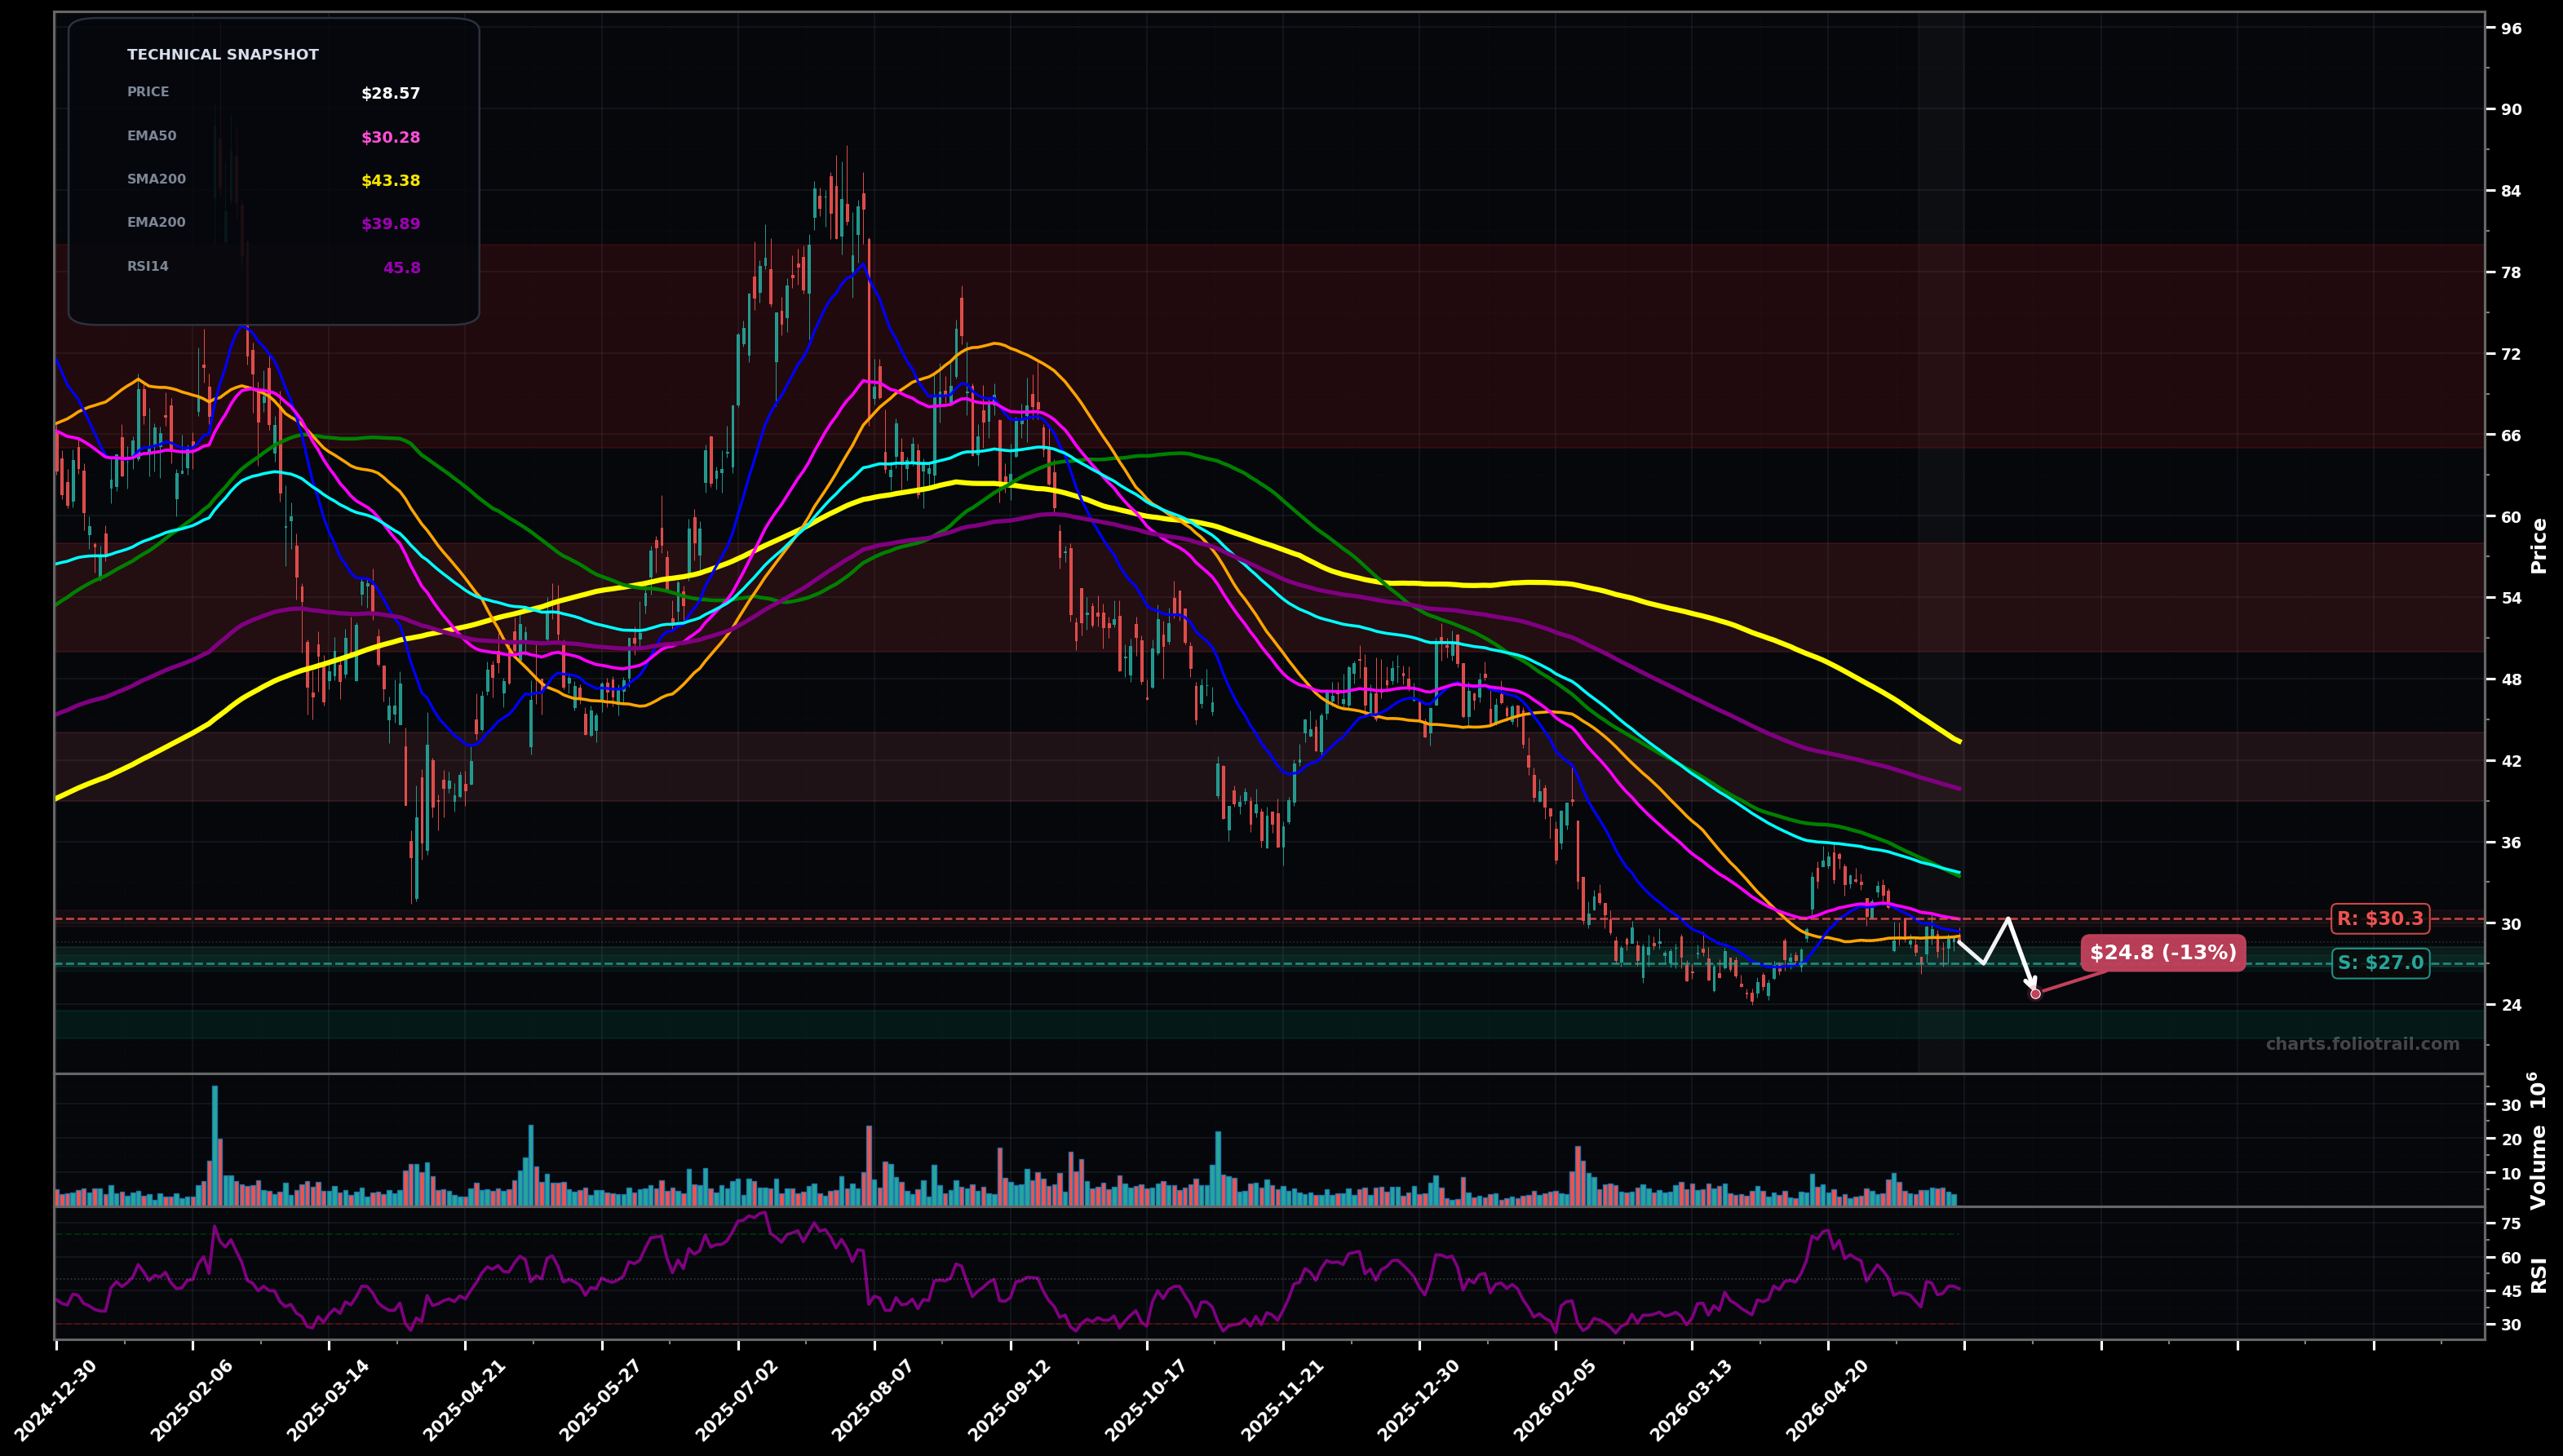
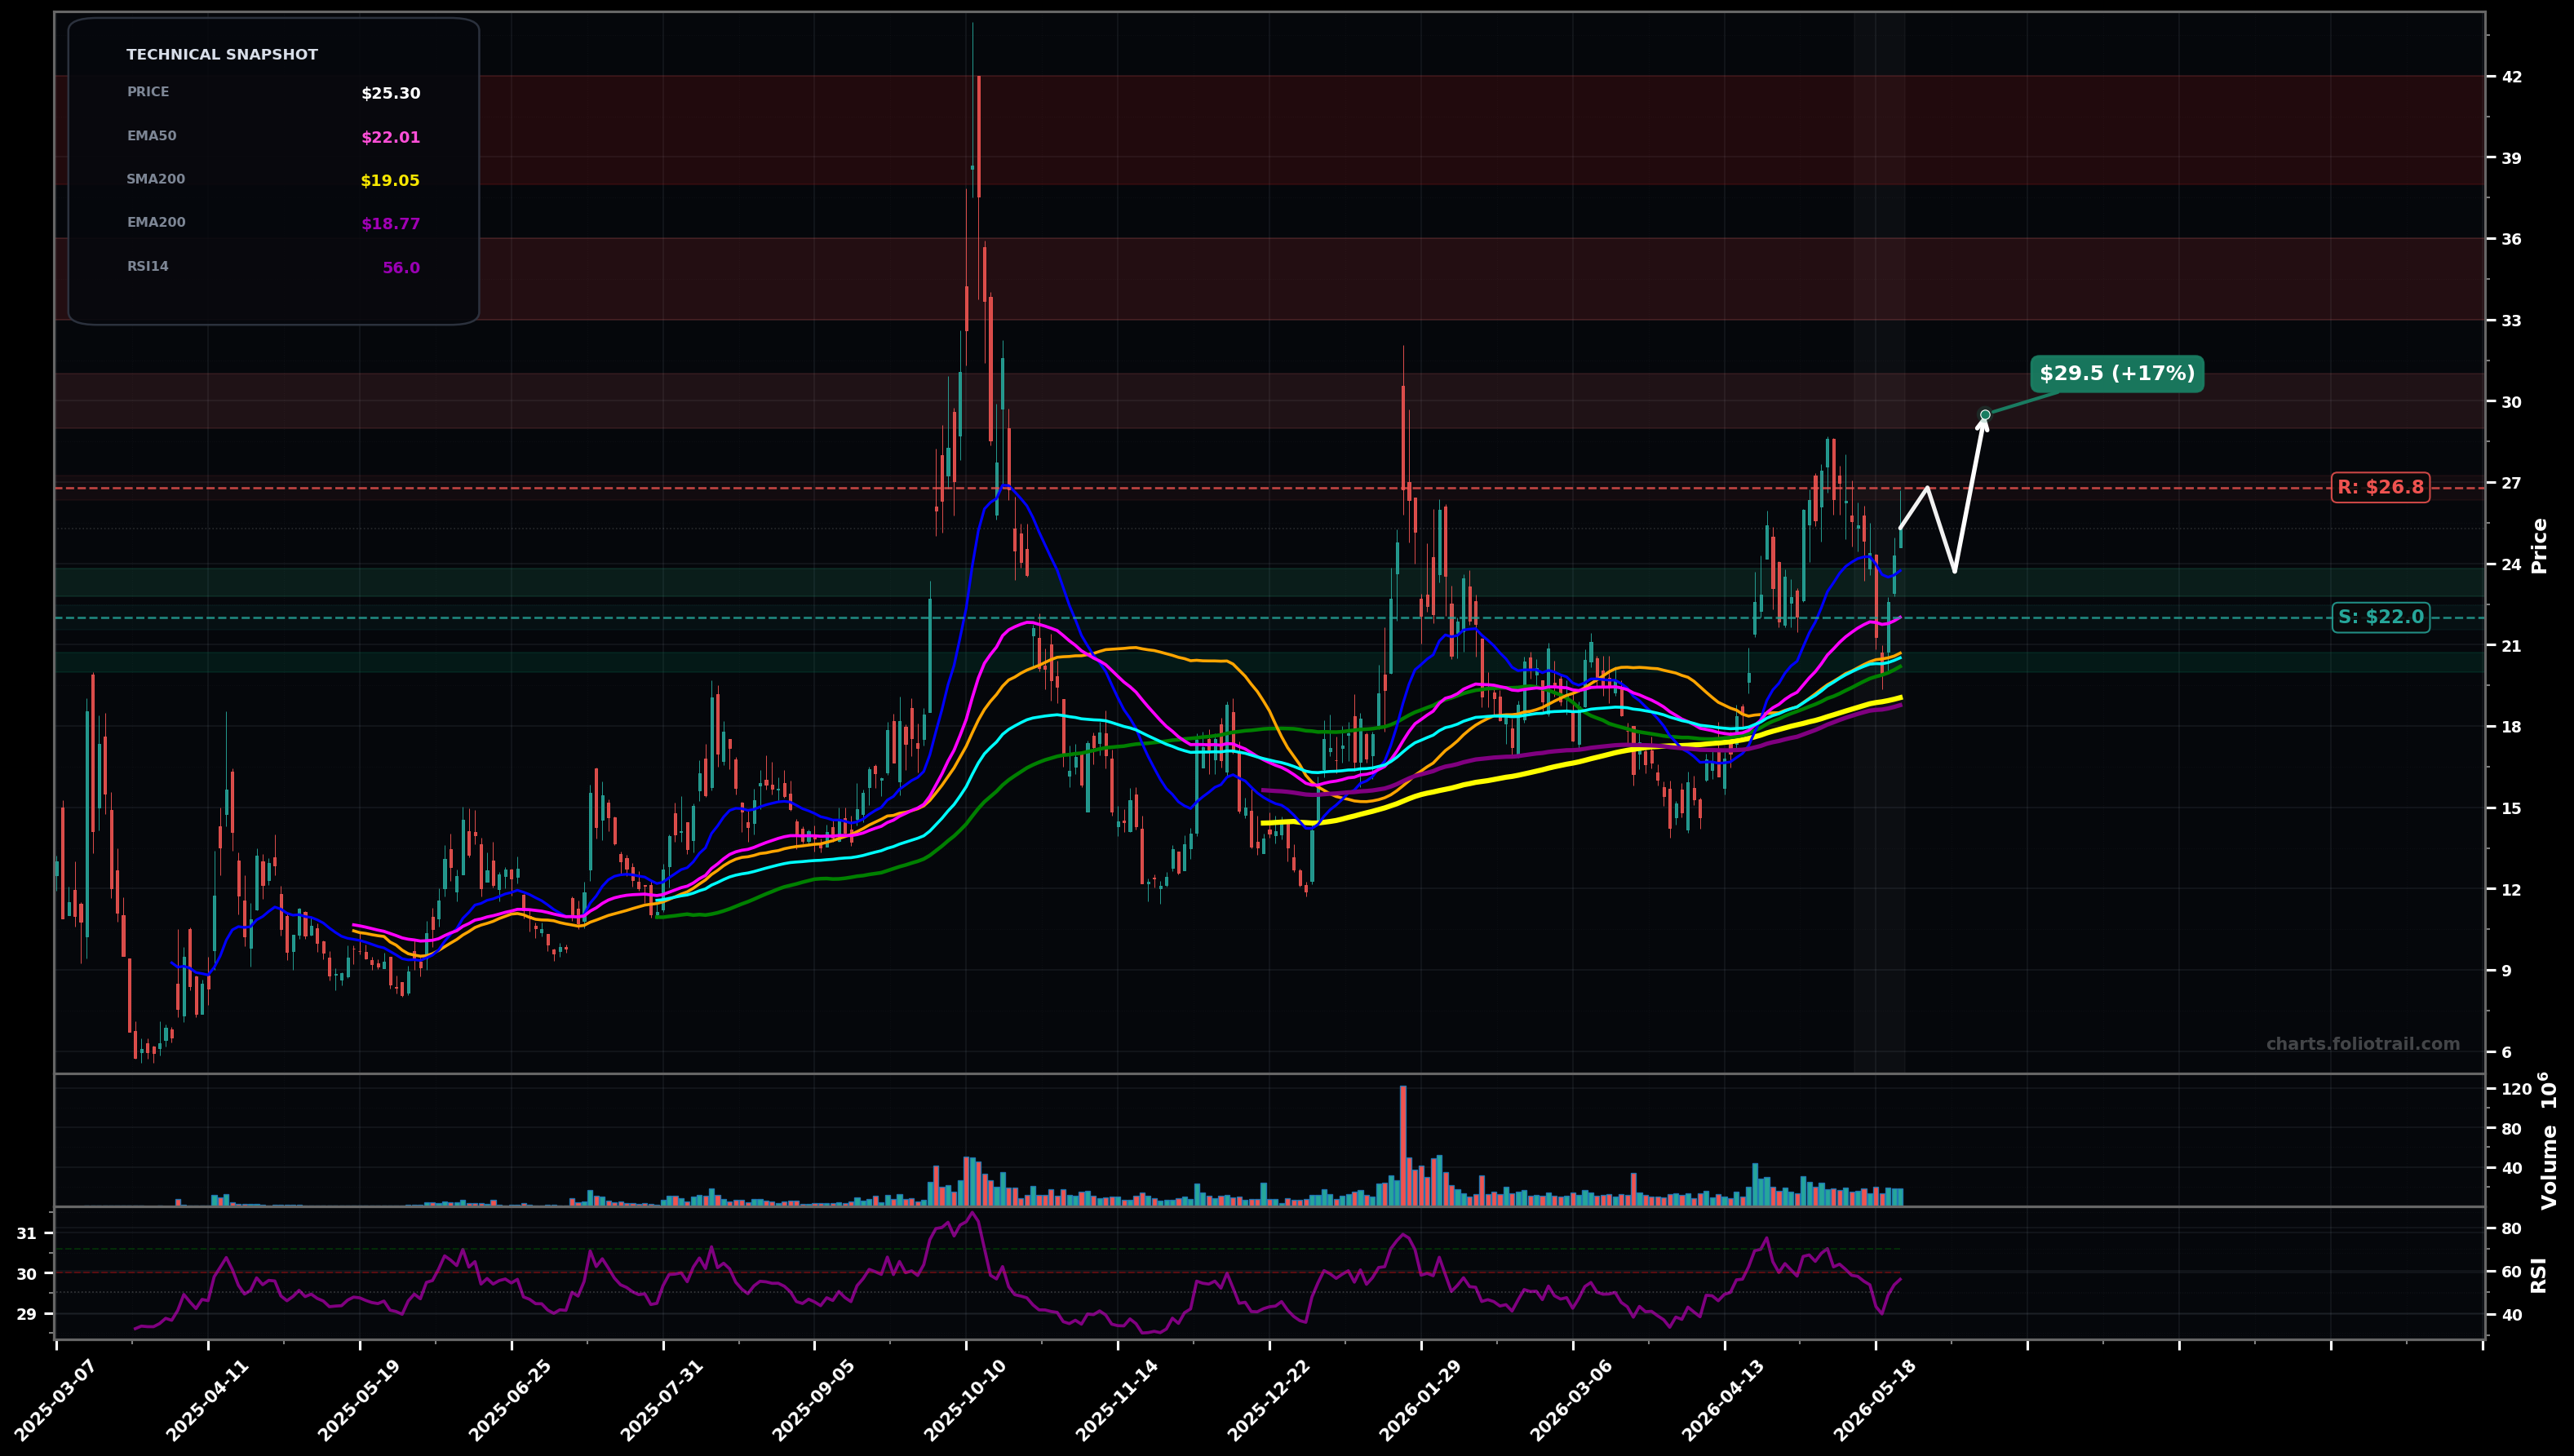
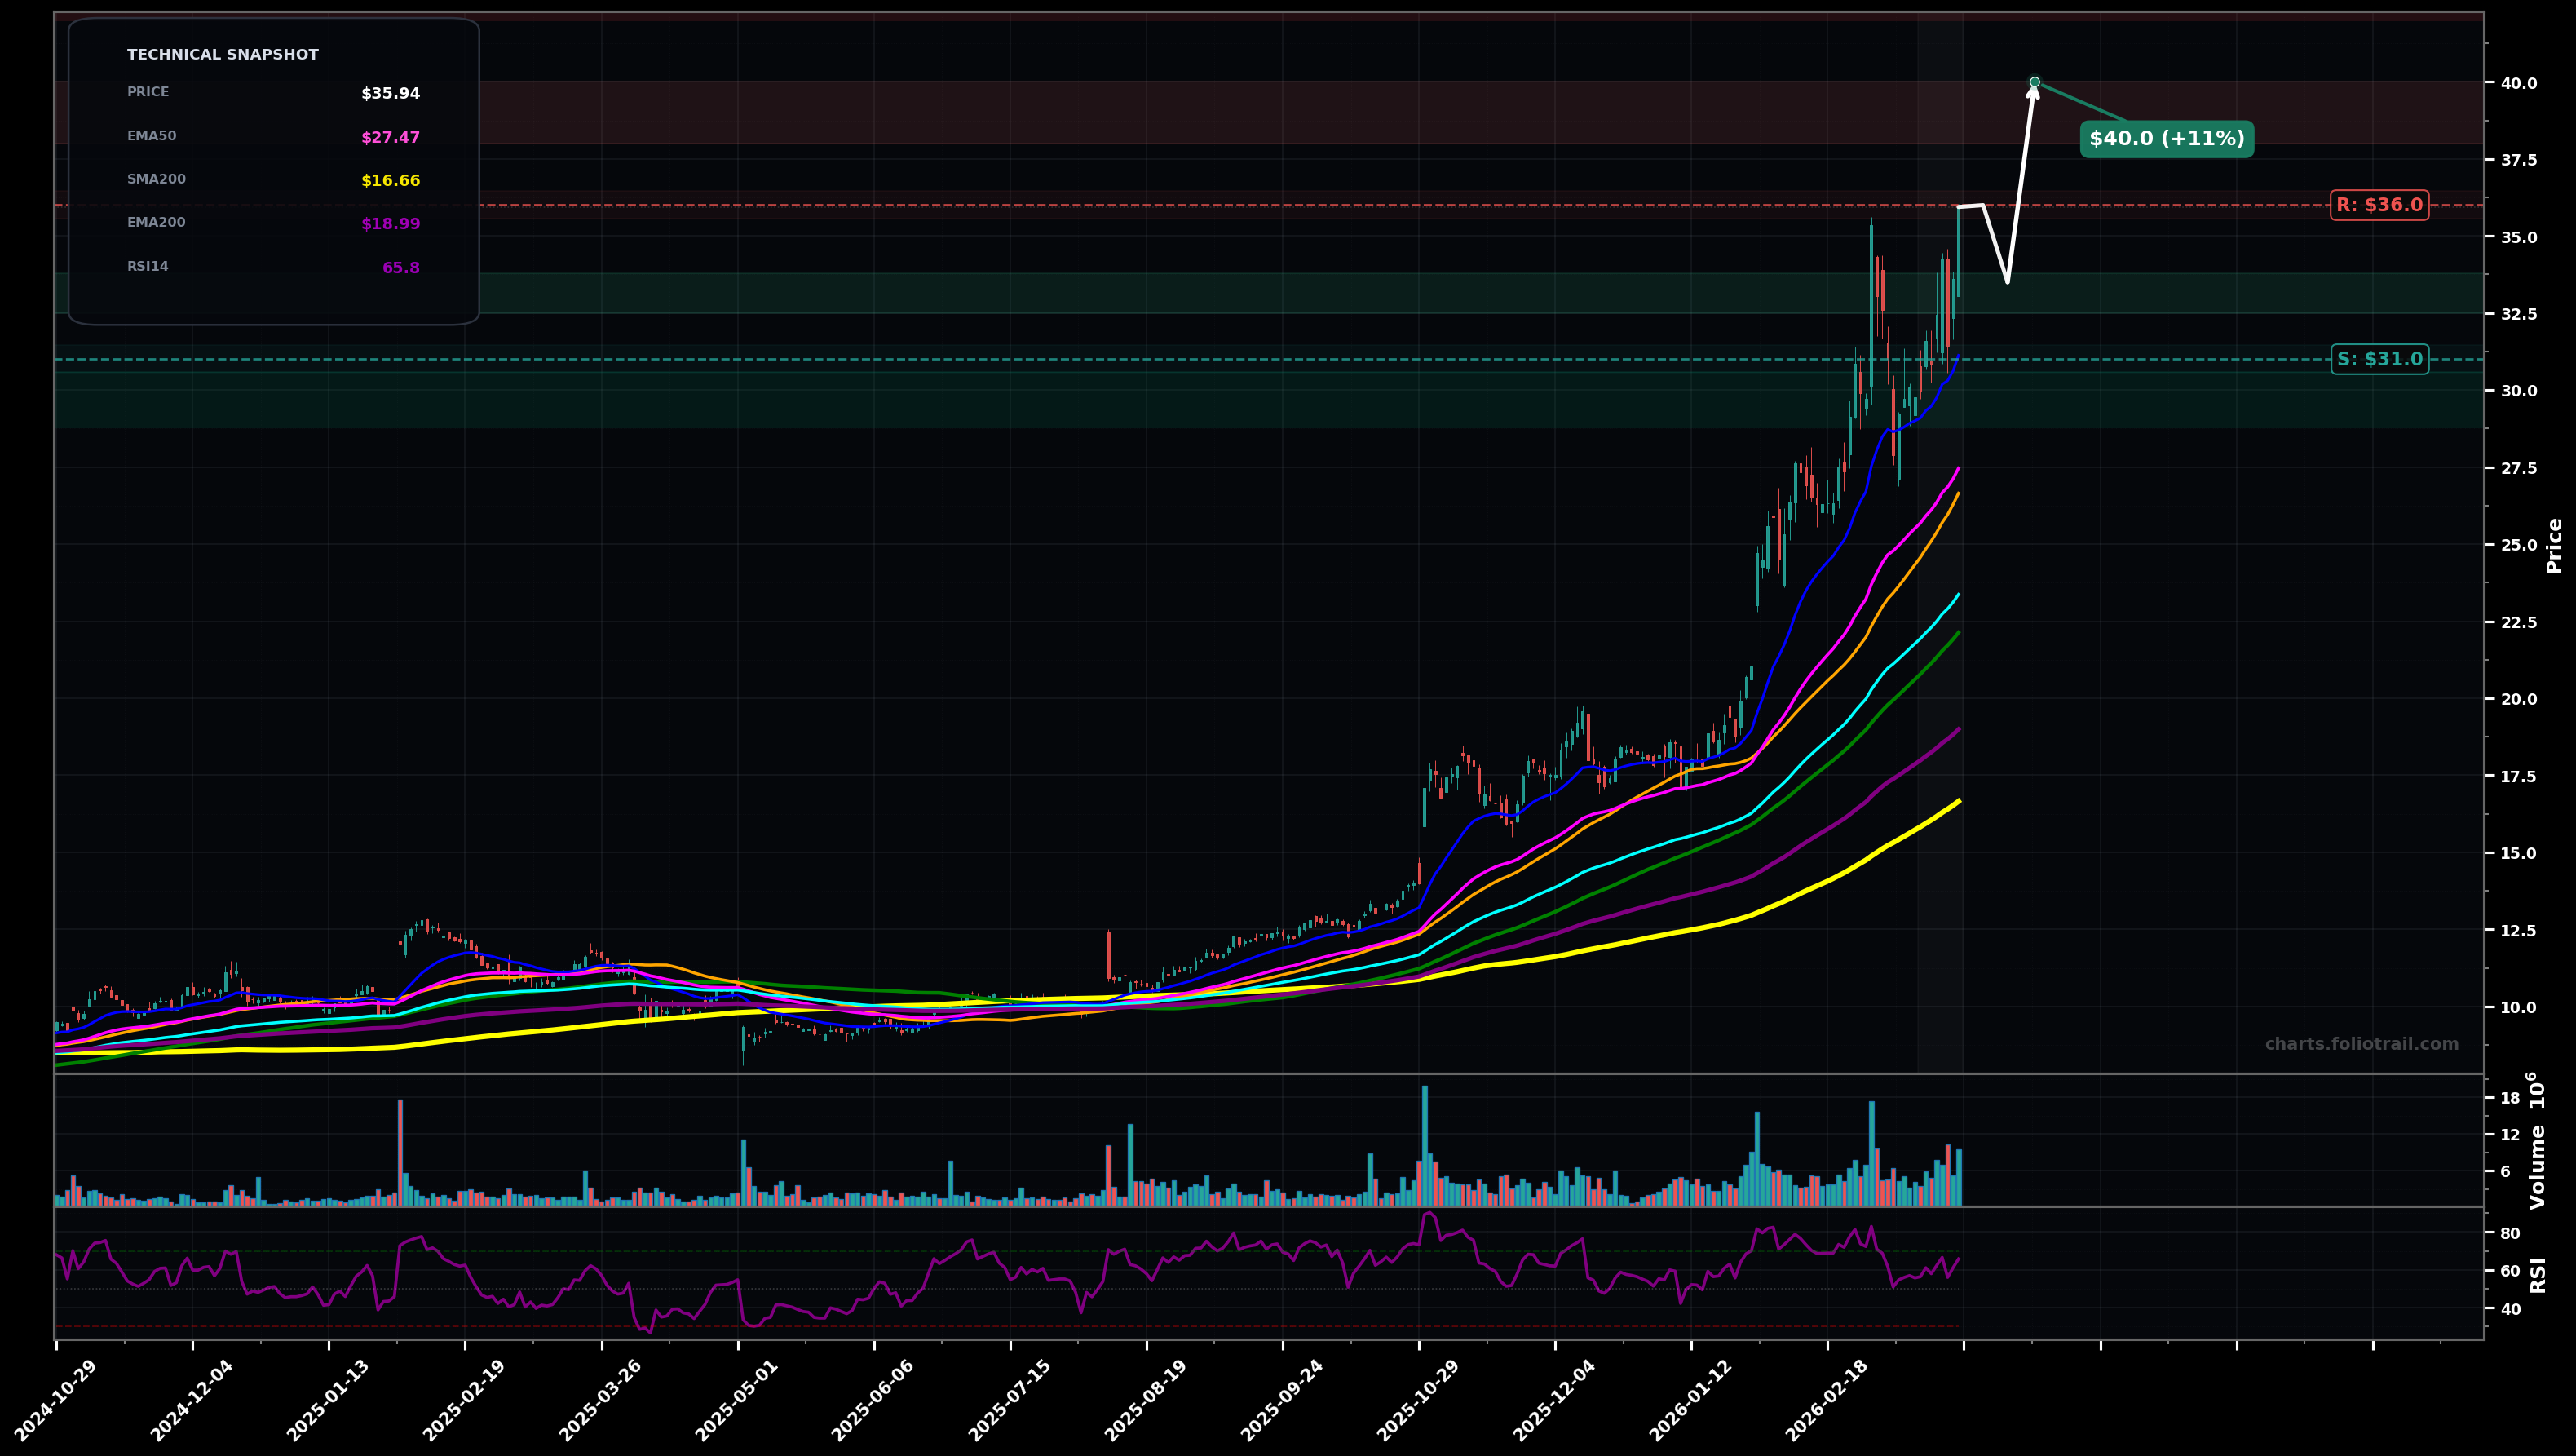
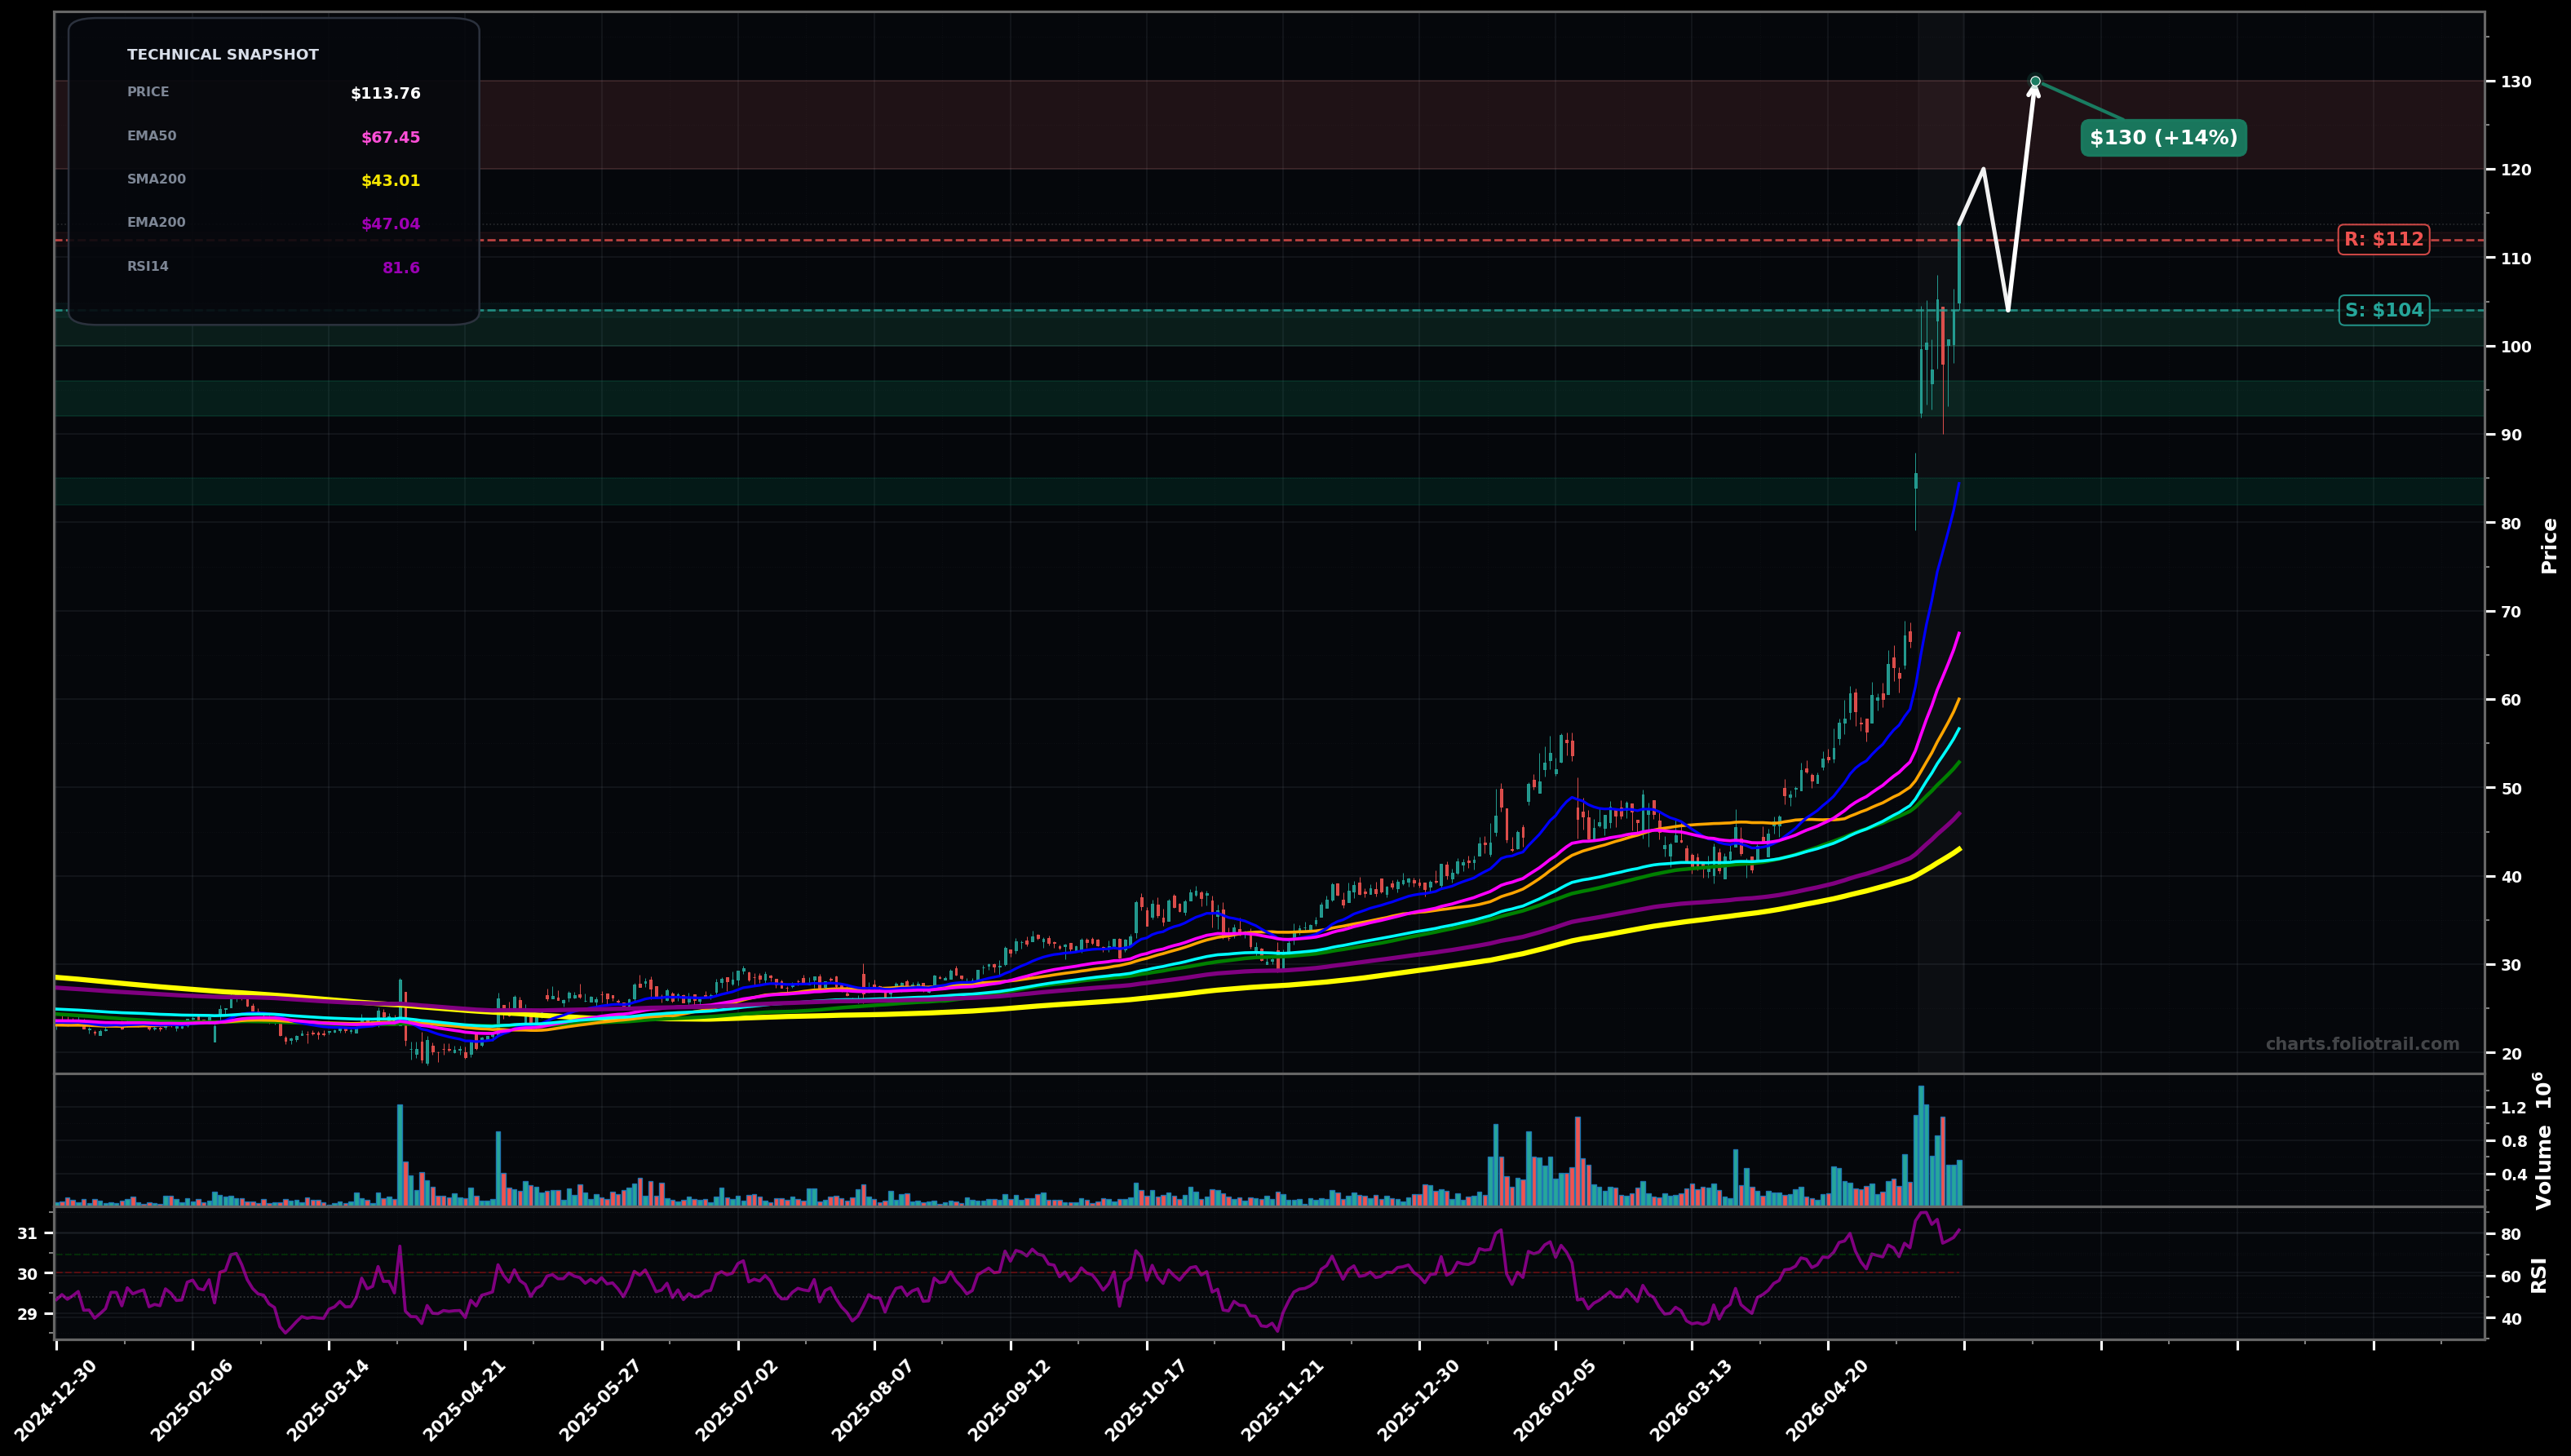
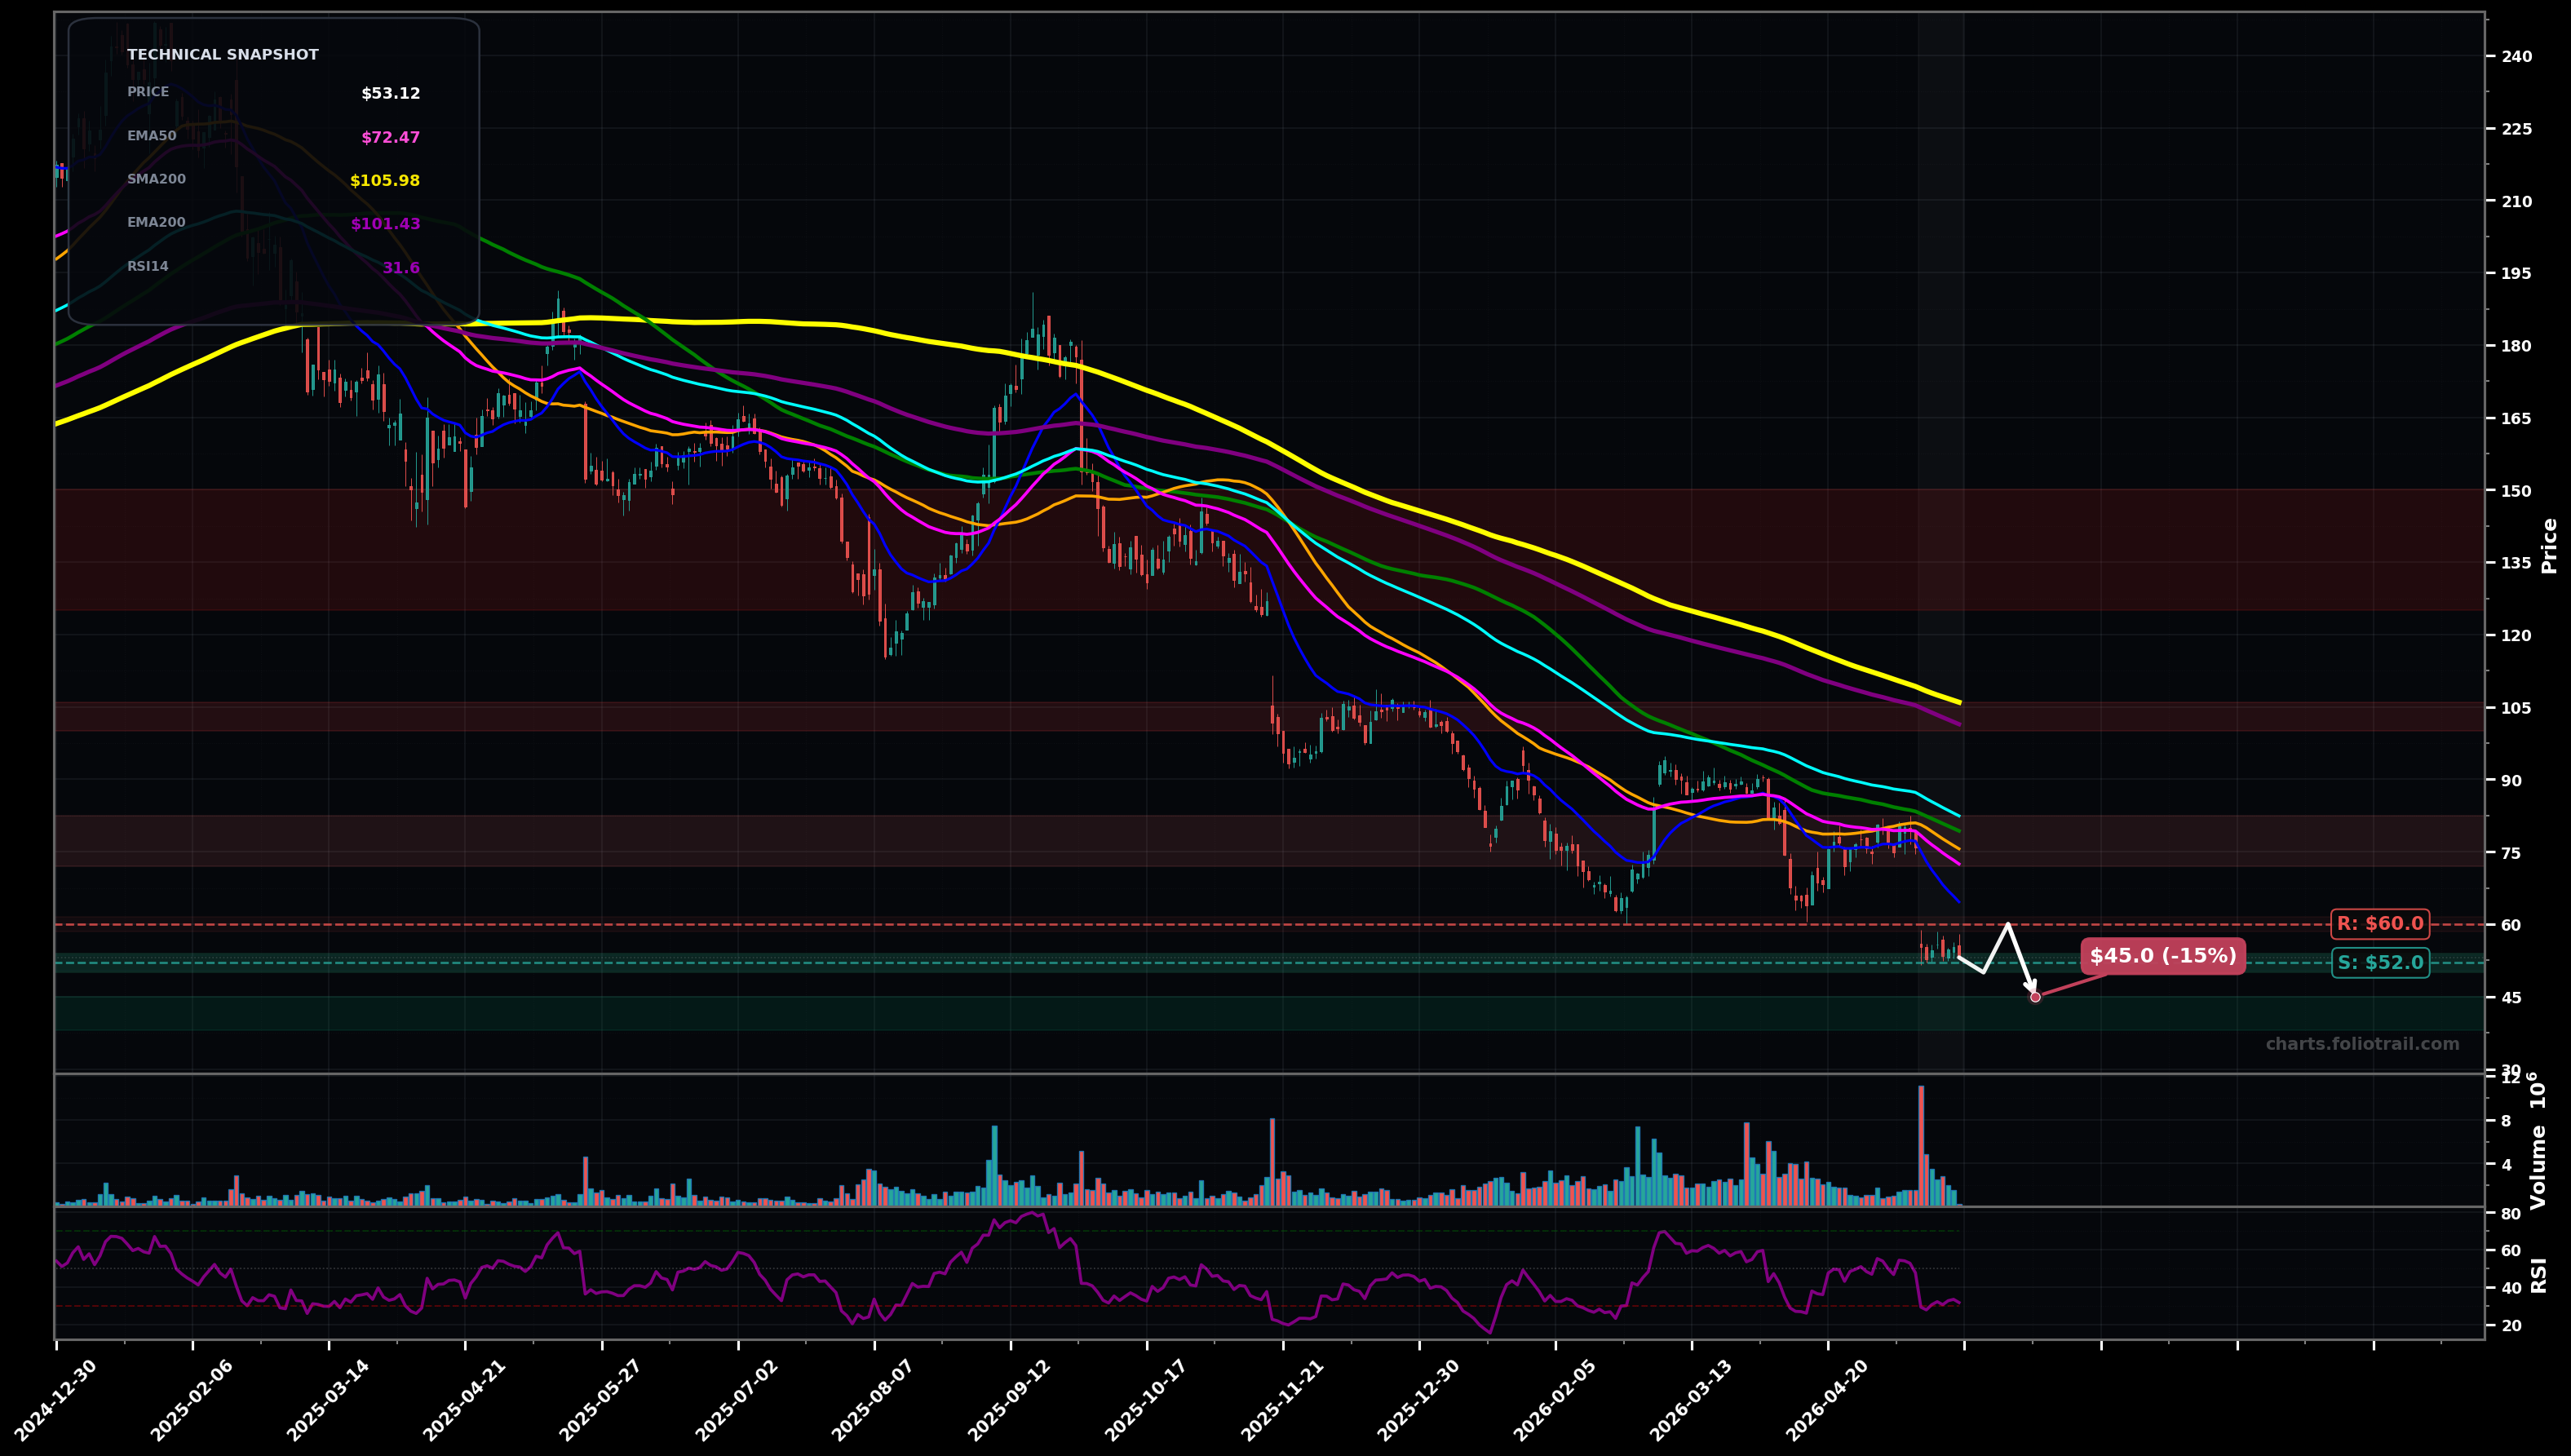
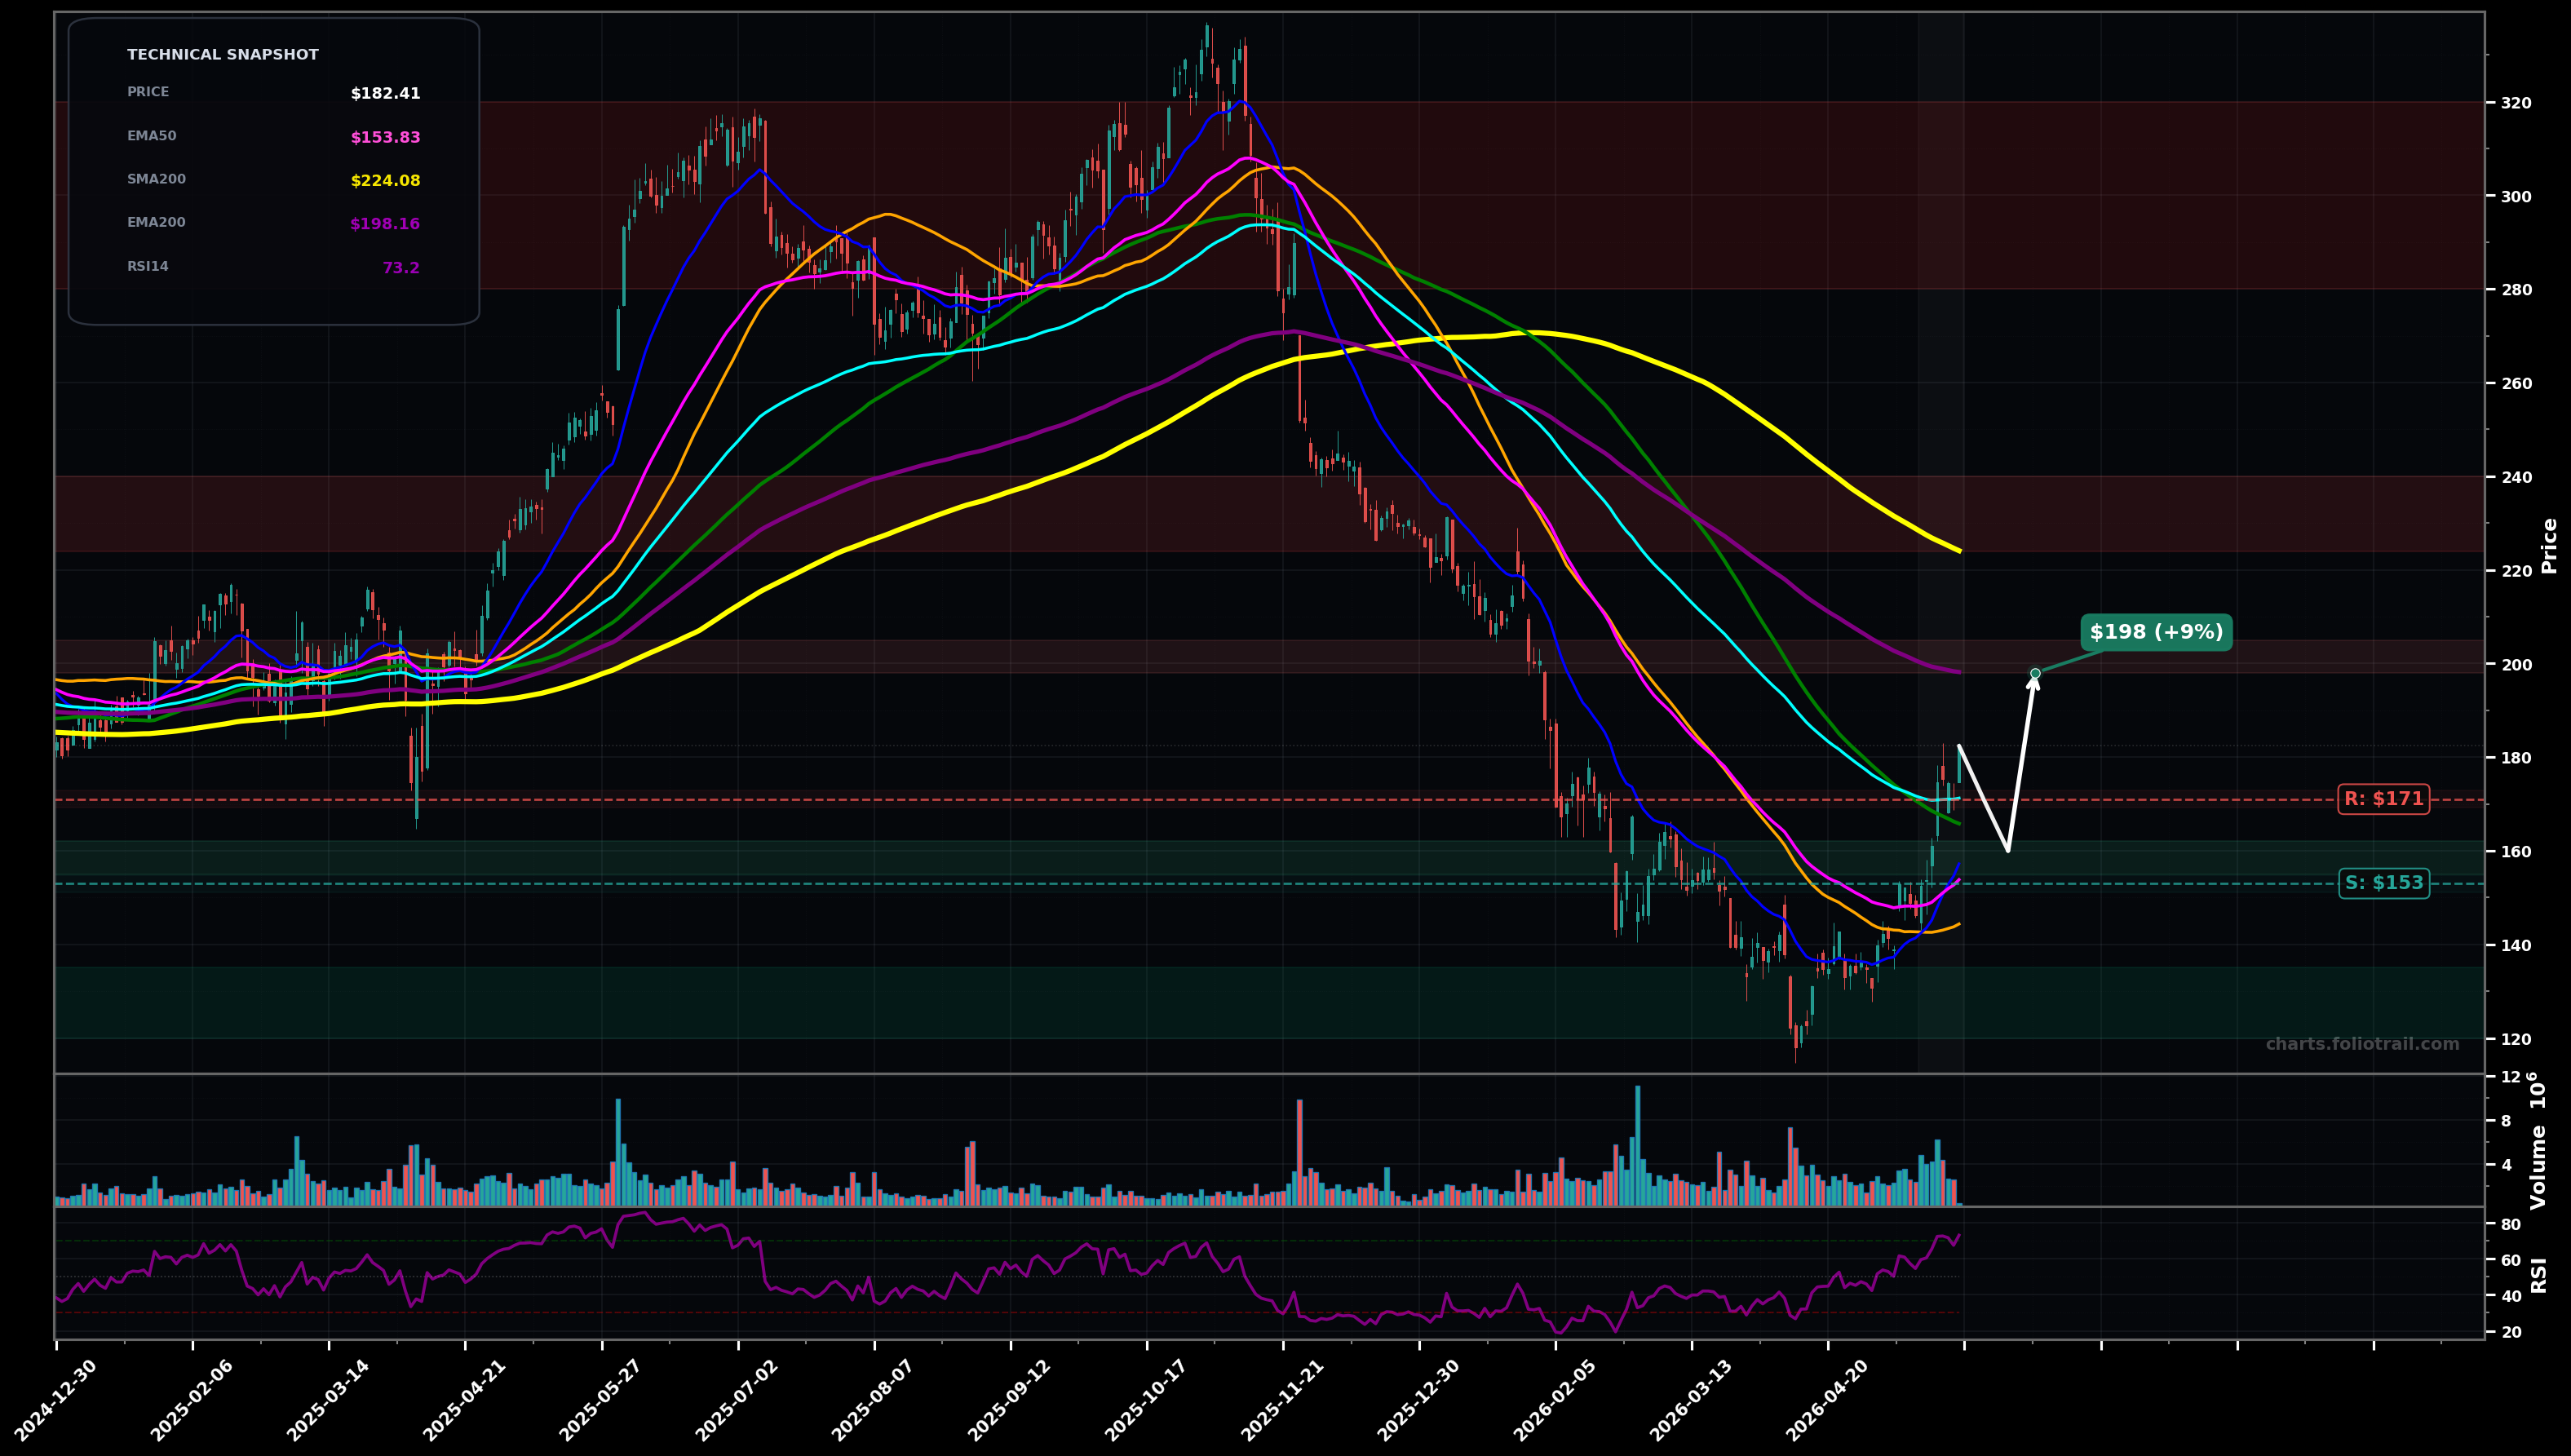
Classifies the current regime (uptrend, downtrend, bottoming, breakout, etc.) using Moving Averages, EMA crossovers, and RSI momentum across multiple timeframes.
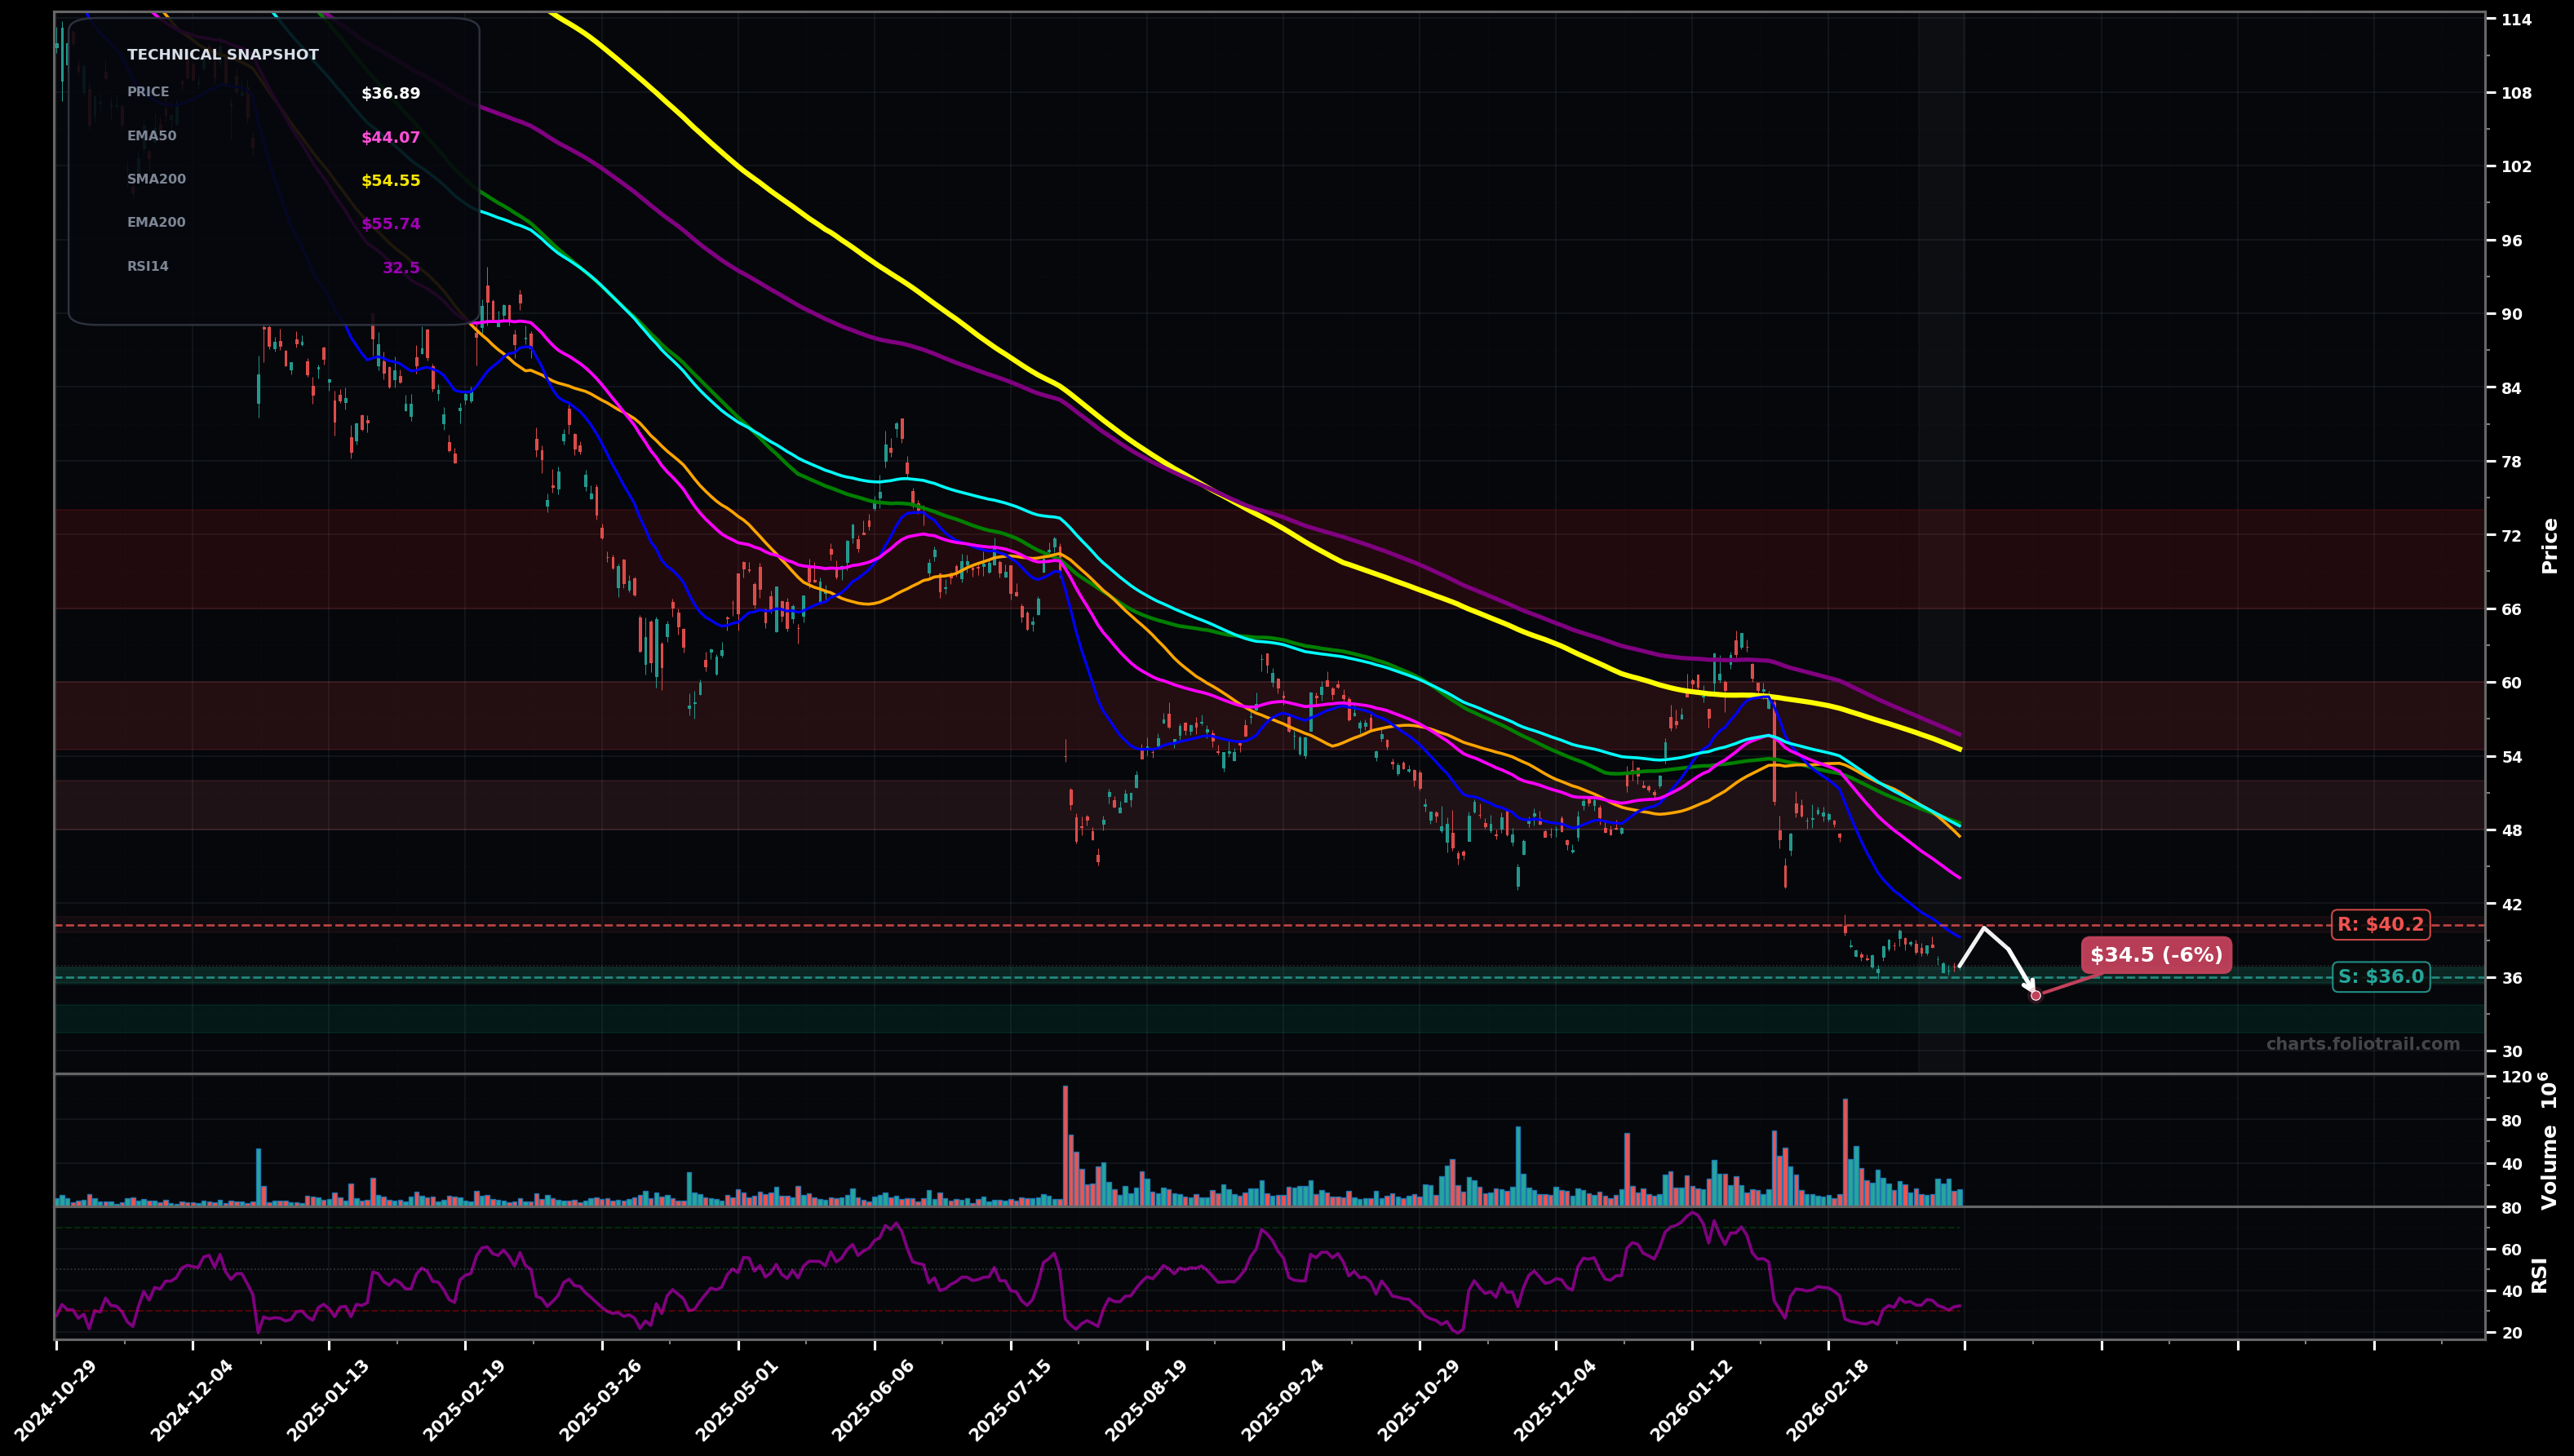
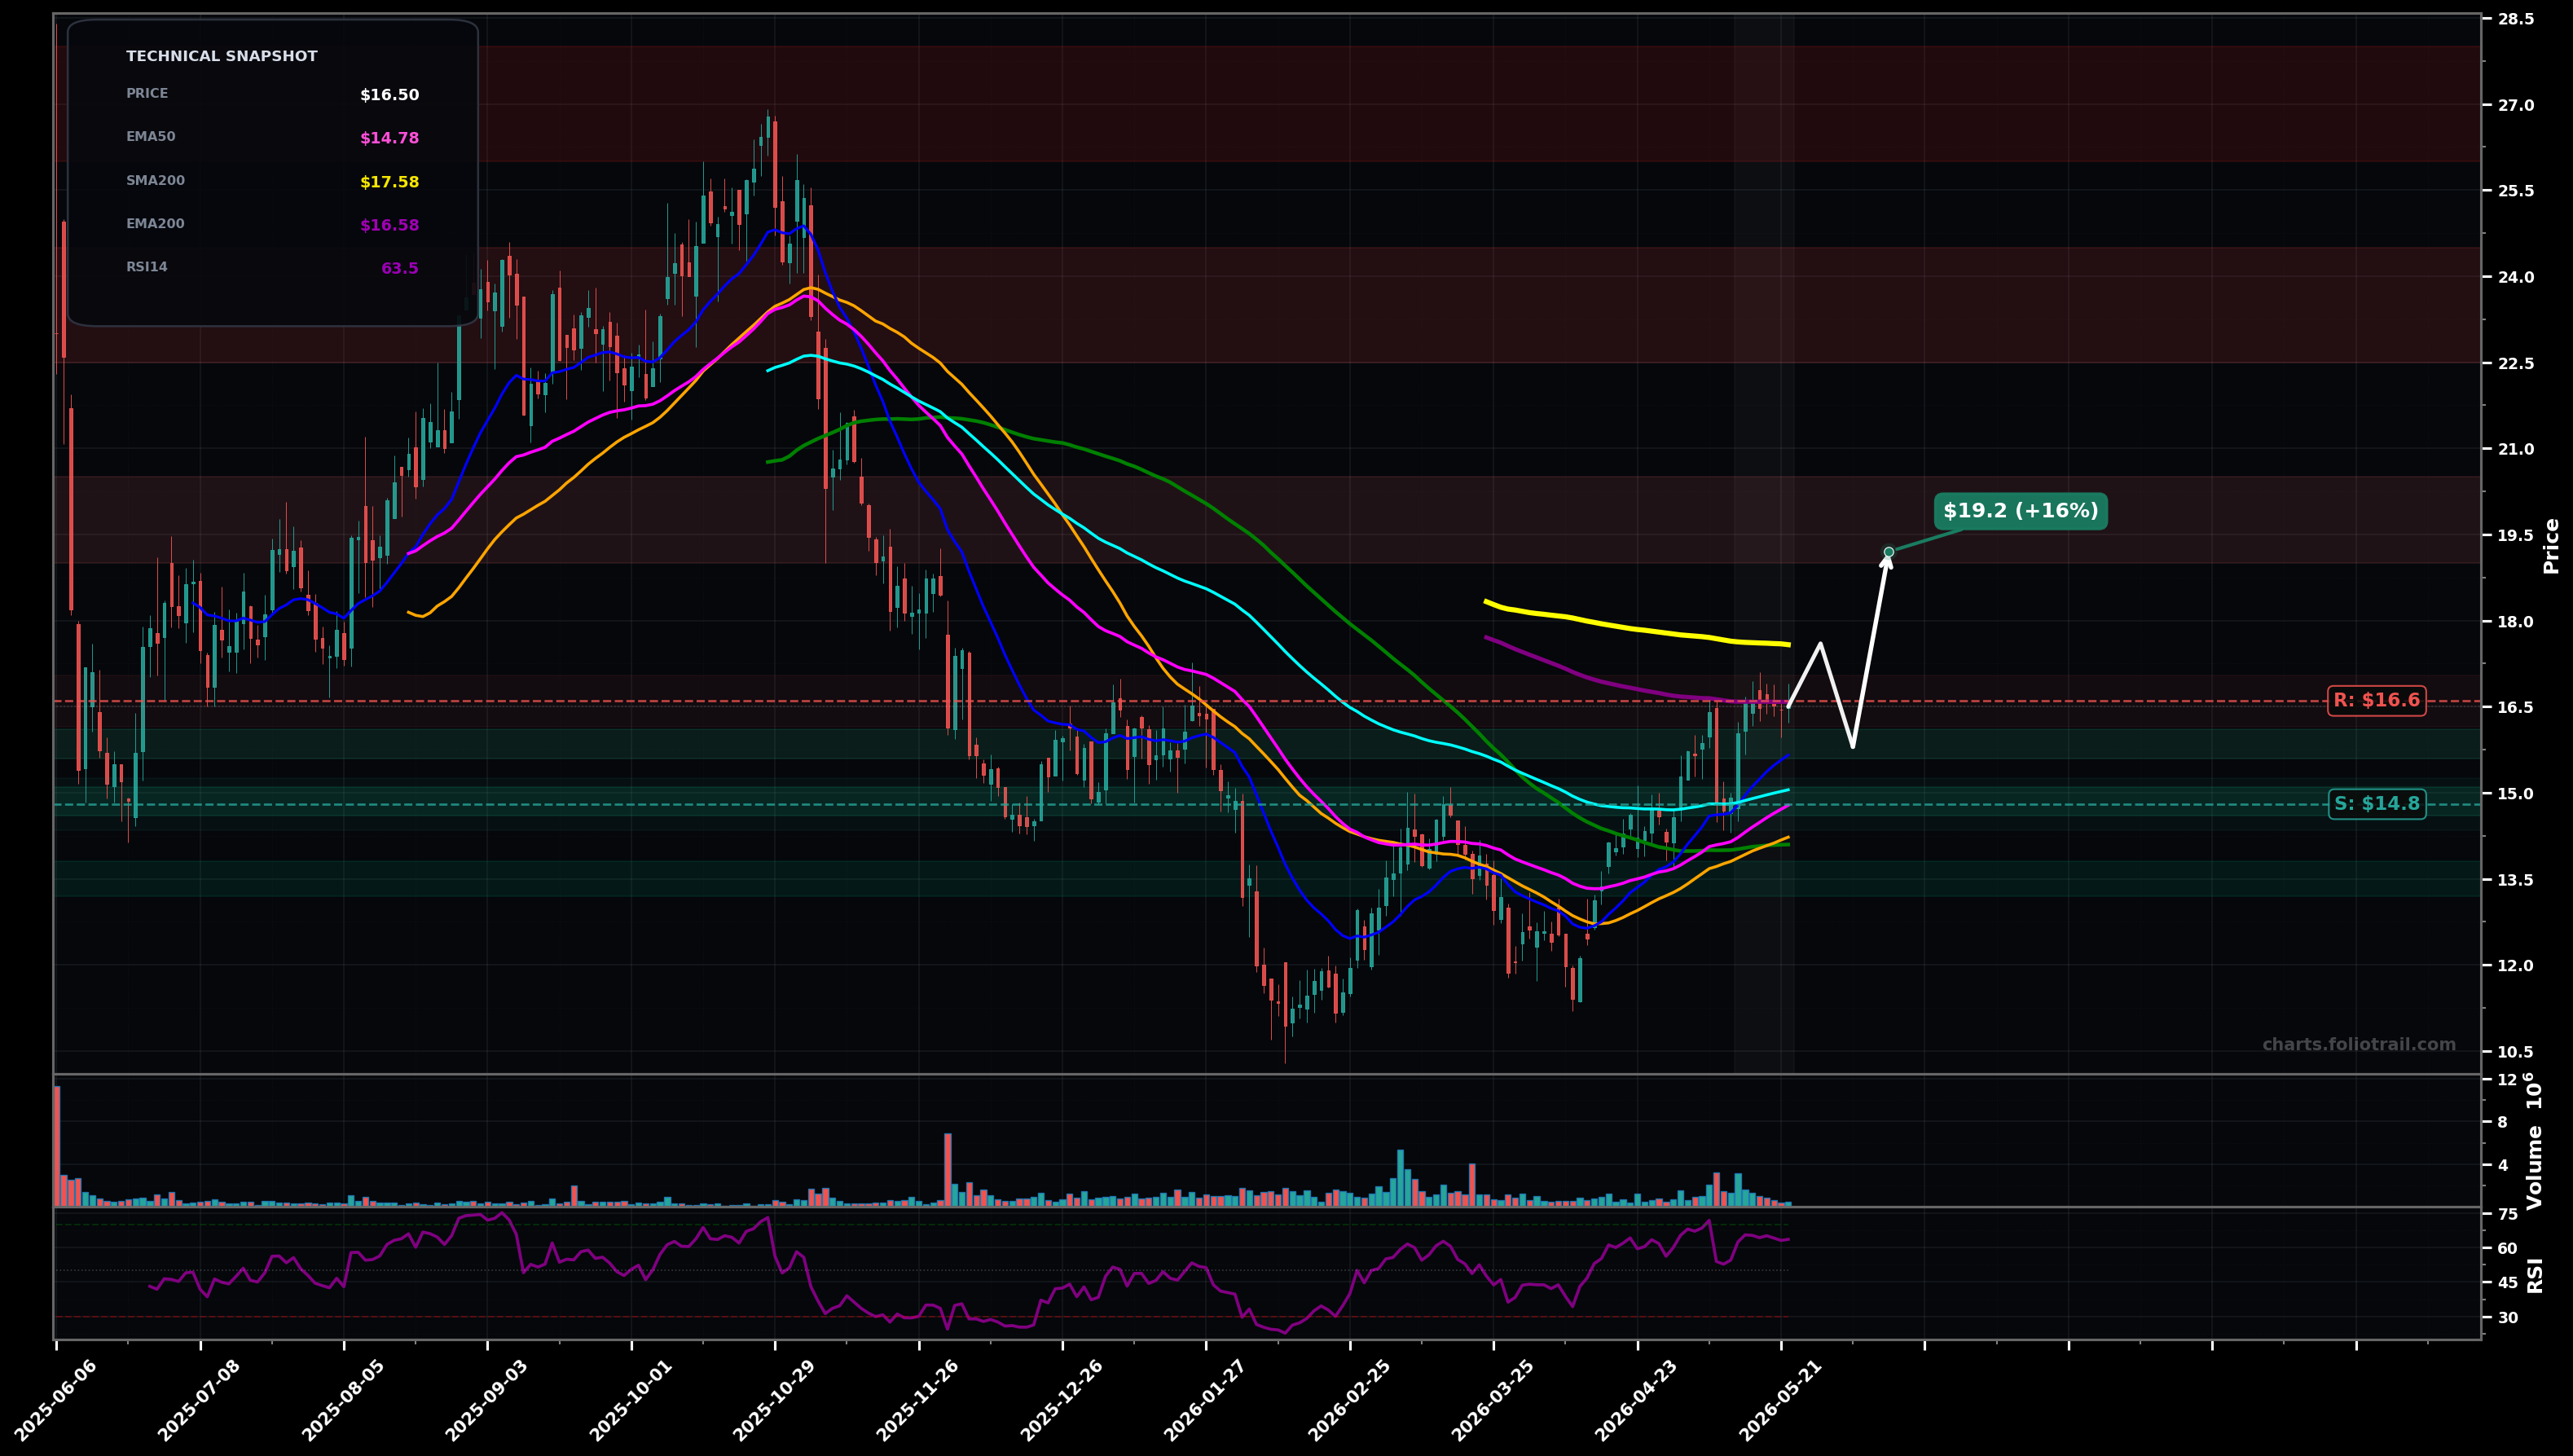
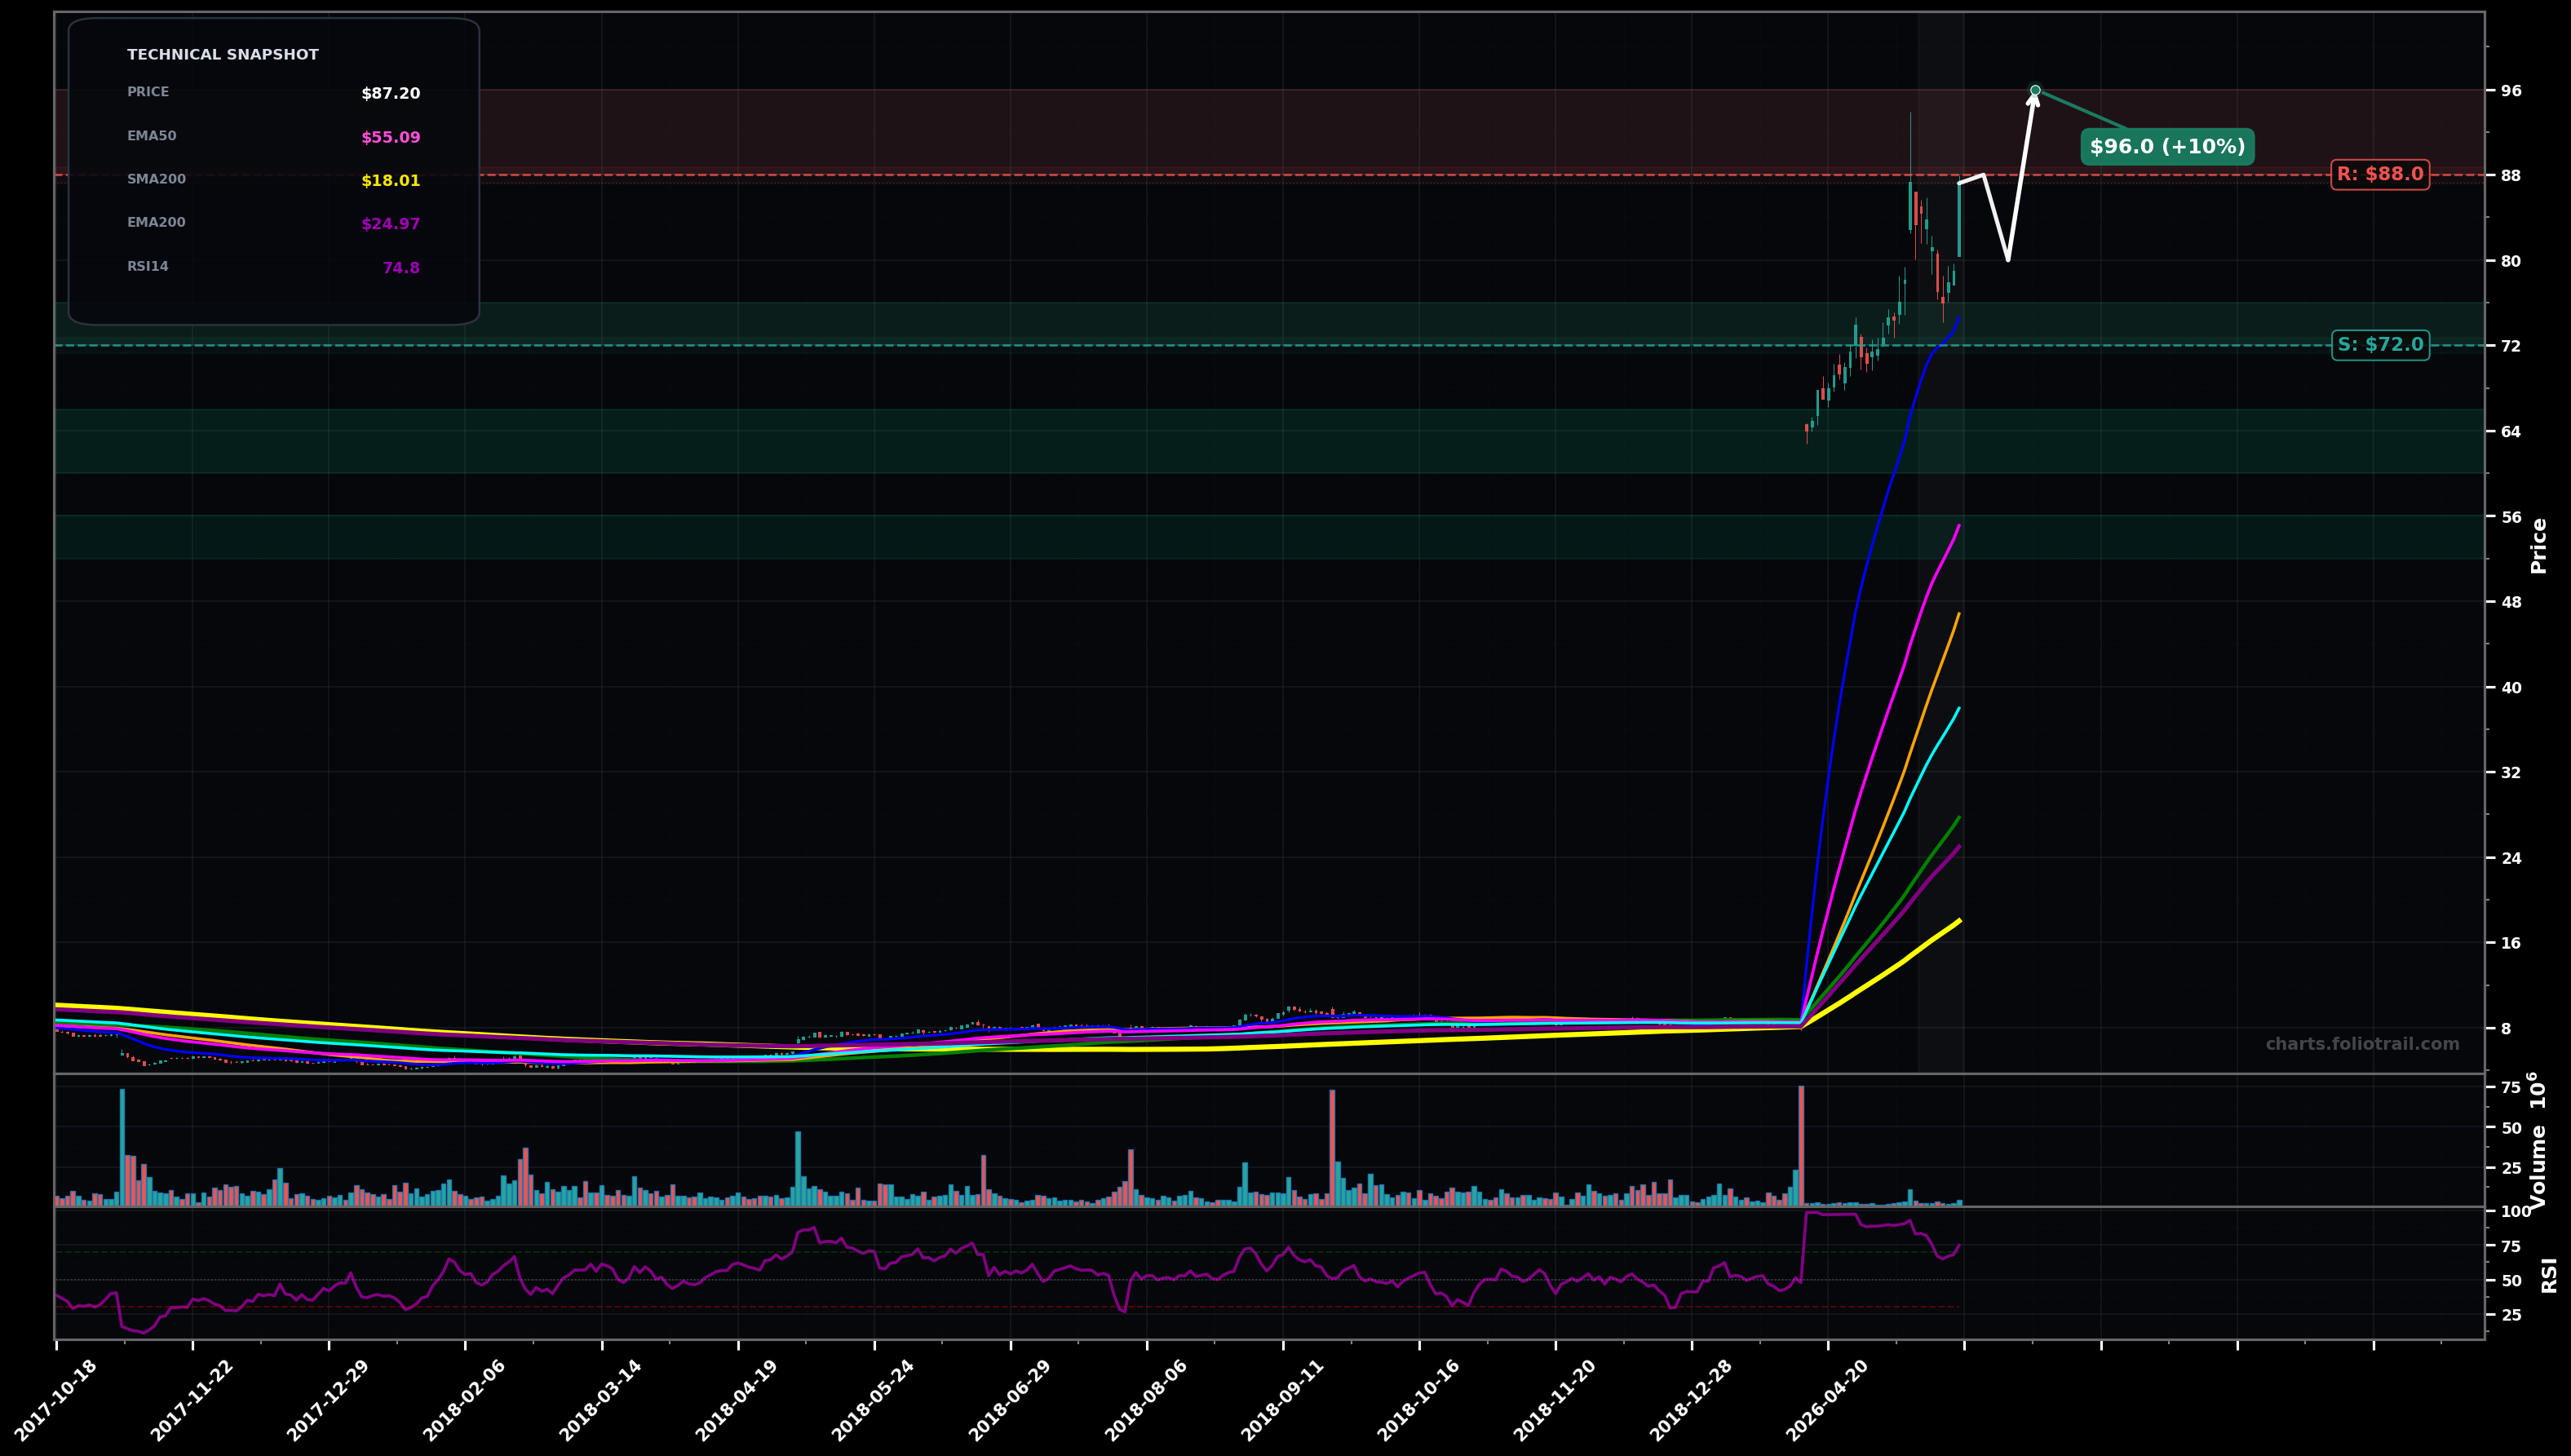
Generates probability-weighted scenarios with precise price targets using Elliott Wave Theory, support/resistance mapping, and volume profile analysis.
Outputs actionable add/trim zones with start position, heavy add, and derisk levels — the same framework used by institutional portfolio managers.
Powered by Foliotrail's proprietary AI agents. Learn more about our methodology.
Multi-layer AI agents analyse 200+ stocks across daily, weekly, and monthly timeframes — producing market state classifications, price scenarios with targets, and position entry/exit levels. Daily charts updated every trading day at 6 PM ET. Weekly charts refresh Fridays. Monthly charts refresh on the last trading day of each month. No paywall. No sign-up required.
Built by Foliotrail.
All content on this website — including charts, analysis, price targets, support/resistance levels, and position zones — is generated entirely by AI and provided for educational and informational purposes only.
This is not financial advice. NEXUSNOIR VENTURES SL (the operator of this website) is not a registered investment adviser or broker-dealer. You should not make investment decisions based solely on this information. Always do your own research and consult a qualified financial advisor.
By continuing, you acknowledge that you have read and agree to our full disclaimer & terms of use and privacy policy.