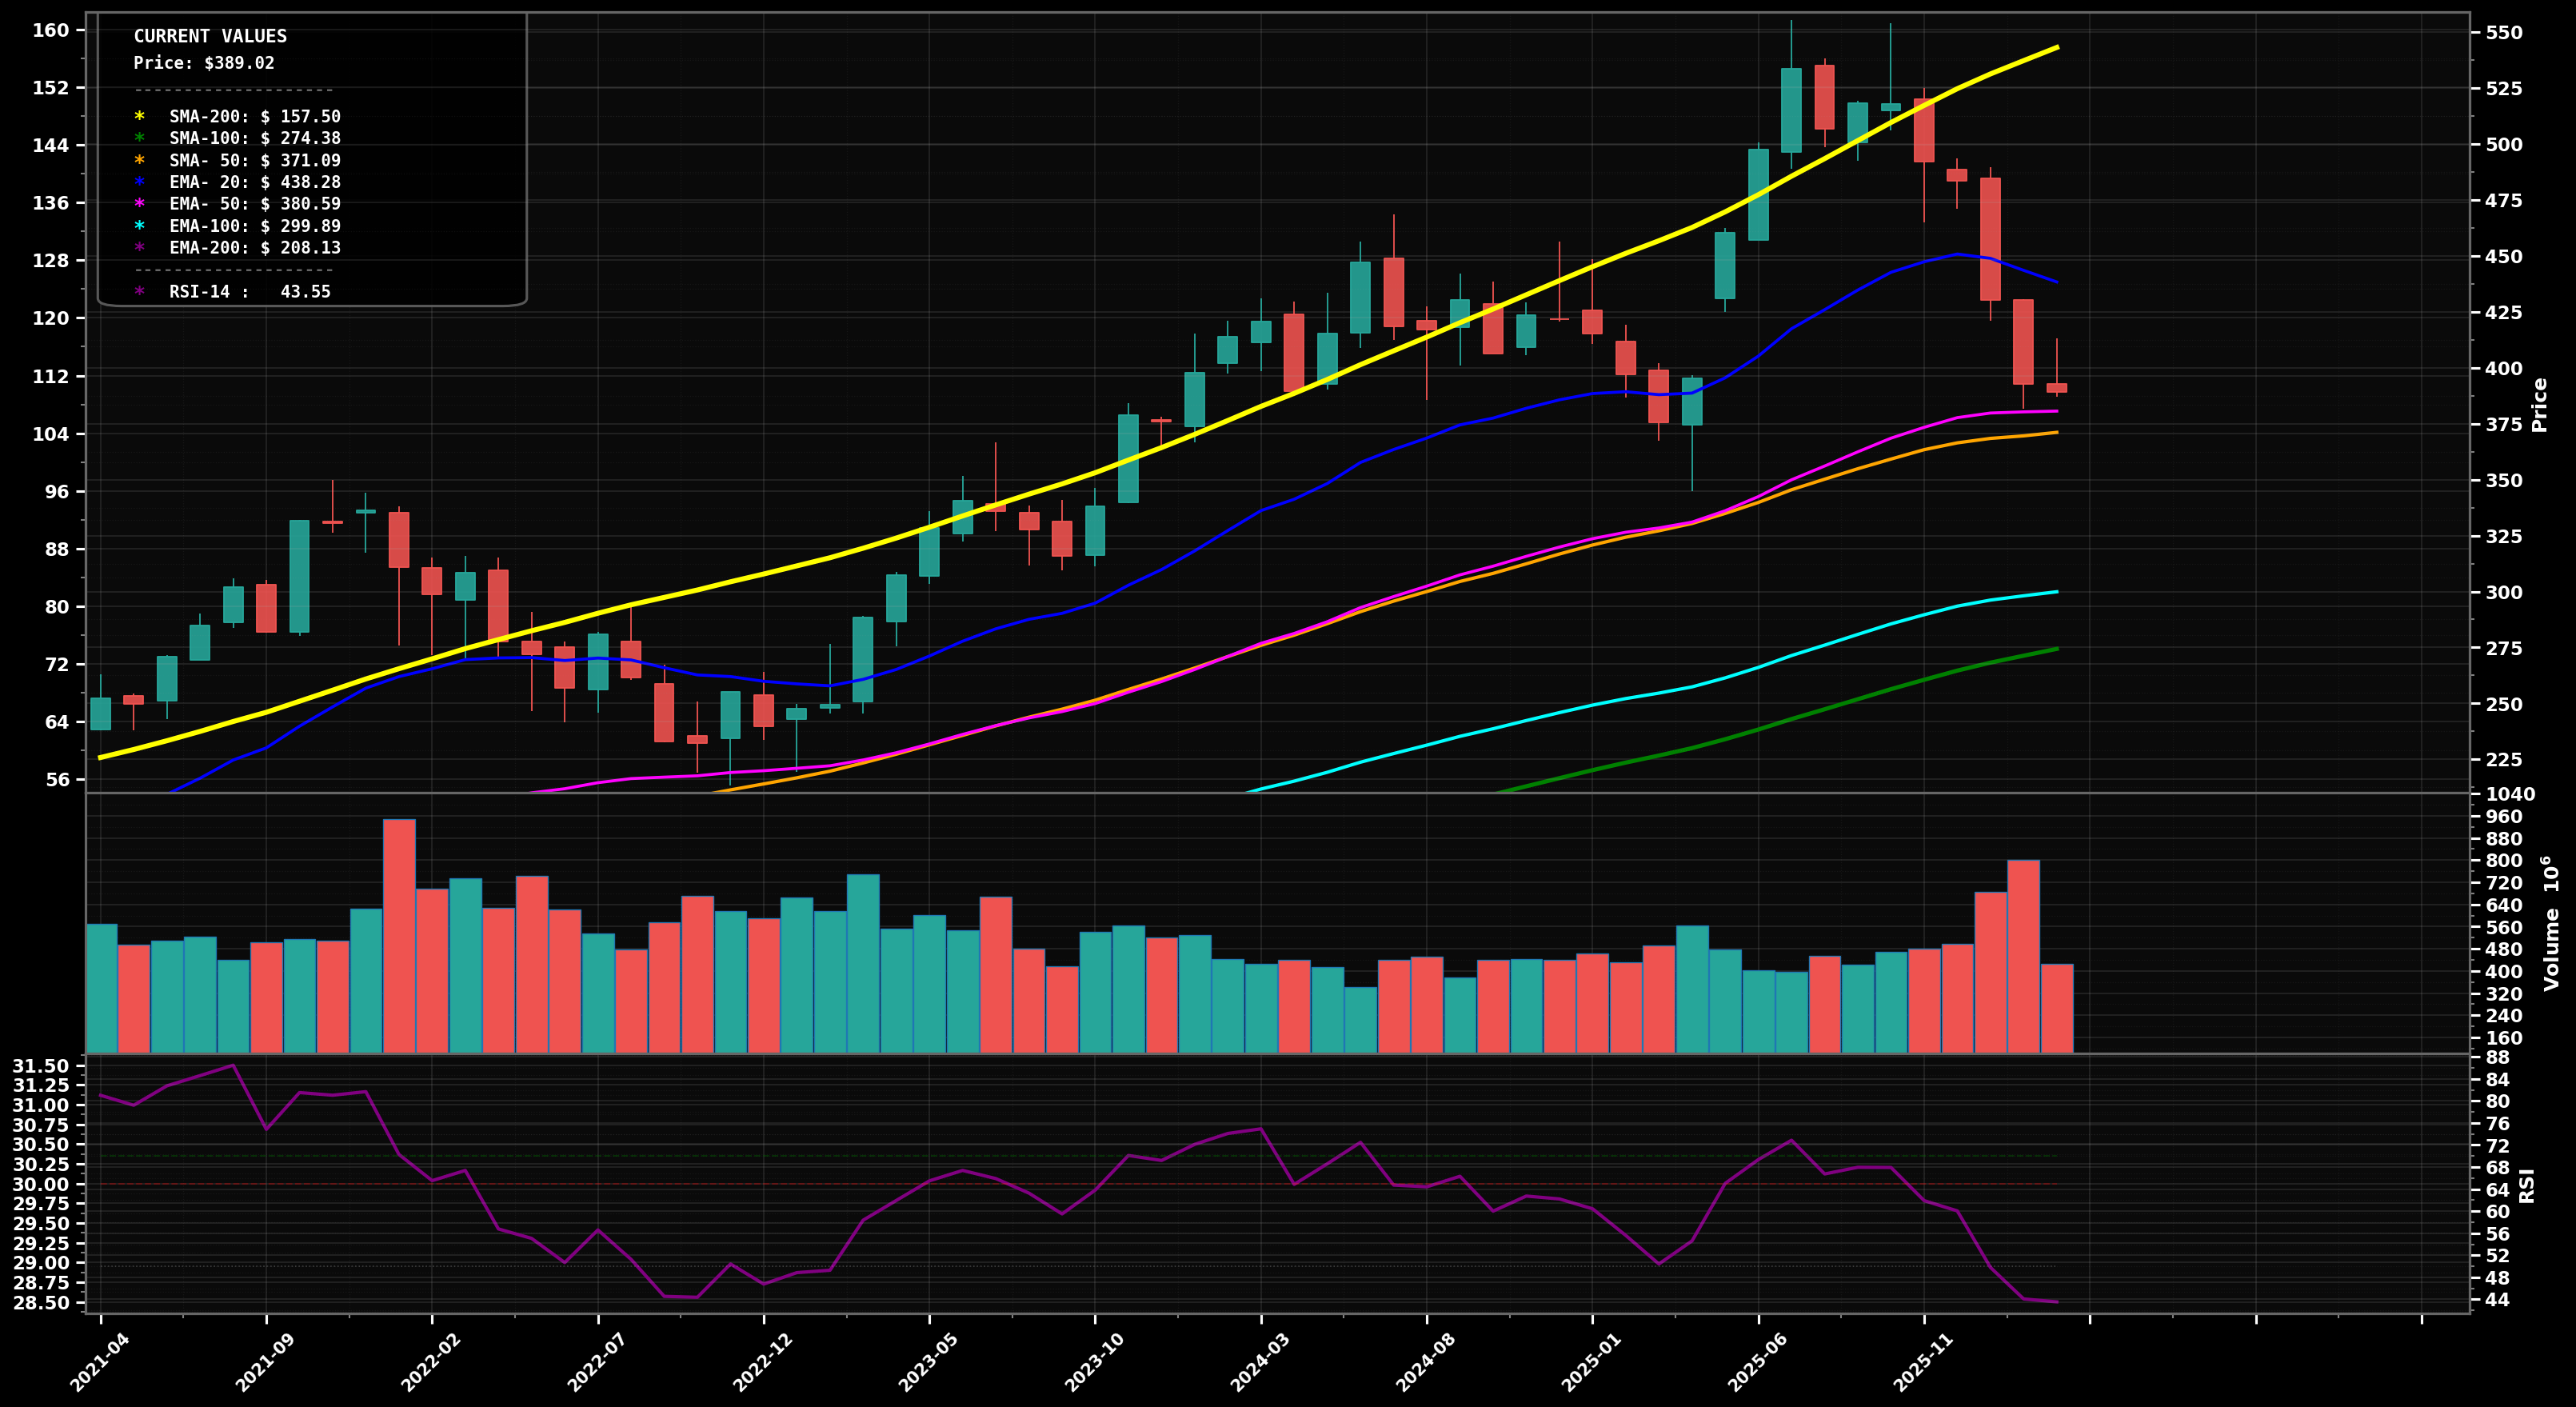
As of May 22, 2026, MSFT (Microsoft Corp.) is in a bottoming attempt state on the monthly chart, with a confidence level of 62%. Key support is at $360 and key resistance at $432. After a blow-off top near ~$550, MSFT sold off hard to the ~$360 area and is now bouncing back to ~$418.50; price is still below the declining EMA20 (~$432) and below the rising SMA50/EMA50 cluster (~$375–$382).
Base-building continues: price holds above the $375–$382 MA cluster (SMA50/EMA50) and pushes to reclaim EMA20 (~$432); then attempts a measured retrace toward the breakdown zone near $470–$490 (Fib 38.2–50% of the ~$550->$360 drop).
Bearish continuation: the bounce fails below $432 and a rollover breaks back under the $375–$382 area, reopening the path to retest $360; if $360 fails on a monthly close, a deeper Fib extension move targets the low-$300s (toward EMA100/SMA100 region).
Monthly close above $432 (EMA20) and then a second close holding above $432
Monthly close below $360 (breaks the swing low support)
Start/add around reclaimed EMA50/SMA50 cluster and prior breakdown area; heavy add only if price flushes toward higher-timeframe mean (EMA100/SMA100 vicinity) after losing $360 support.
Trim into Fib retracements and prior ATH supply ($525–$550); full close only on an overextension above prior ATH (probable Elliott wave blow-off/exhaustion zone).
As of May 22, 2026, MSFT (Microsoft Corp.) is in a bottoming attempt state on the monthly chart with 62% confidence. After a blow-off top near ~$550, MSFT sold off hard to the ~$360 area and is now bouncing back to ~$418.50; price is still below the declining EMA20 (~$432) and below the rising SMA50/EMA50 cluster (~$375–$382).
On the monthly timeframe, MSFT has key support at $360 and key resistance at $432. The most likely scenario (bullish) targets $432 and $485, with a revert level at $395.
MSFT (Microsoft Corp.) is currently classified as bottoming attempt on the monthly chart, with 62% confidence. Confirmation requires: Monthly close above $432 (EMA20) and then a second close holding above $432 This would be invalidated by: Monthly close below $360 (breaks the swing low support)
The most likely scenario (bullish) targets $432 and $485, with a revert level at $395. The alternative scenario (bearish) targets $360 and $305.
Multi-layer AI agents analyse 200+ stocks across daily, weekly, and monthly timeframes — producing market state classifications, price scenarios with targets, and position entry/exit levels. Daily charts updated every trading day at 6 PM ET. Weekly charts refresh Fridays. Monthly charts refresh on the last trading day of each month. No paywall. No sign-up required.
Built by Foliotrail.
All content on this website — including charts, analysis, price targets, support/resistance levels, and position zones — is generated entirely by AI and provided for educational and informational purposes only.
This is not financial advice. NEXUSNOIR VENTURES SL (the operator of this website) is not a registered investment adviser or broker-dealer. You should not make investment decisions based solely on this information. Always do your own research and consult a qualified financial advisor.
By continuing, you acknowledge that you have read and agree to our full disclaimer & terms of use and privacy policy.