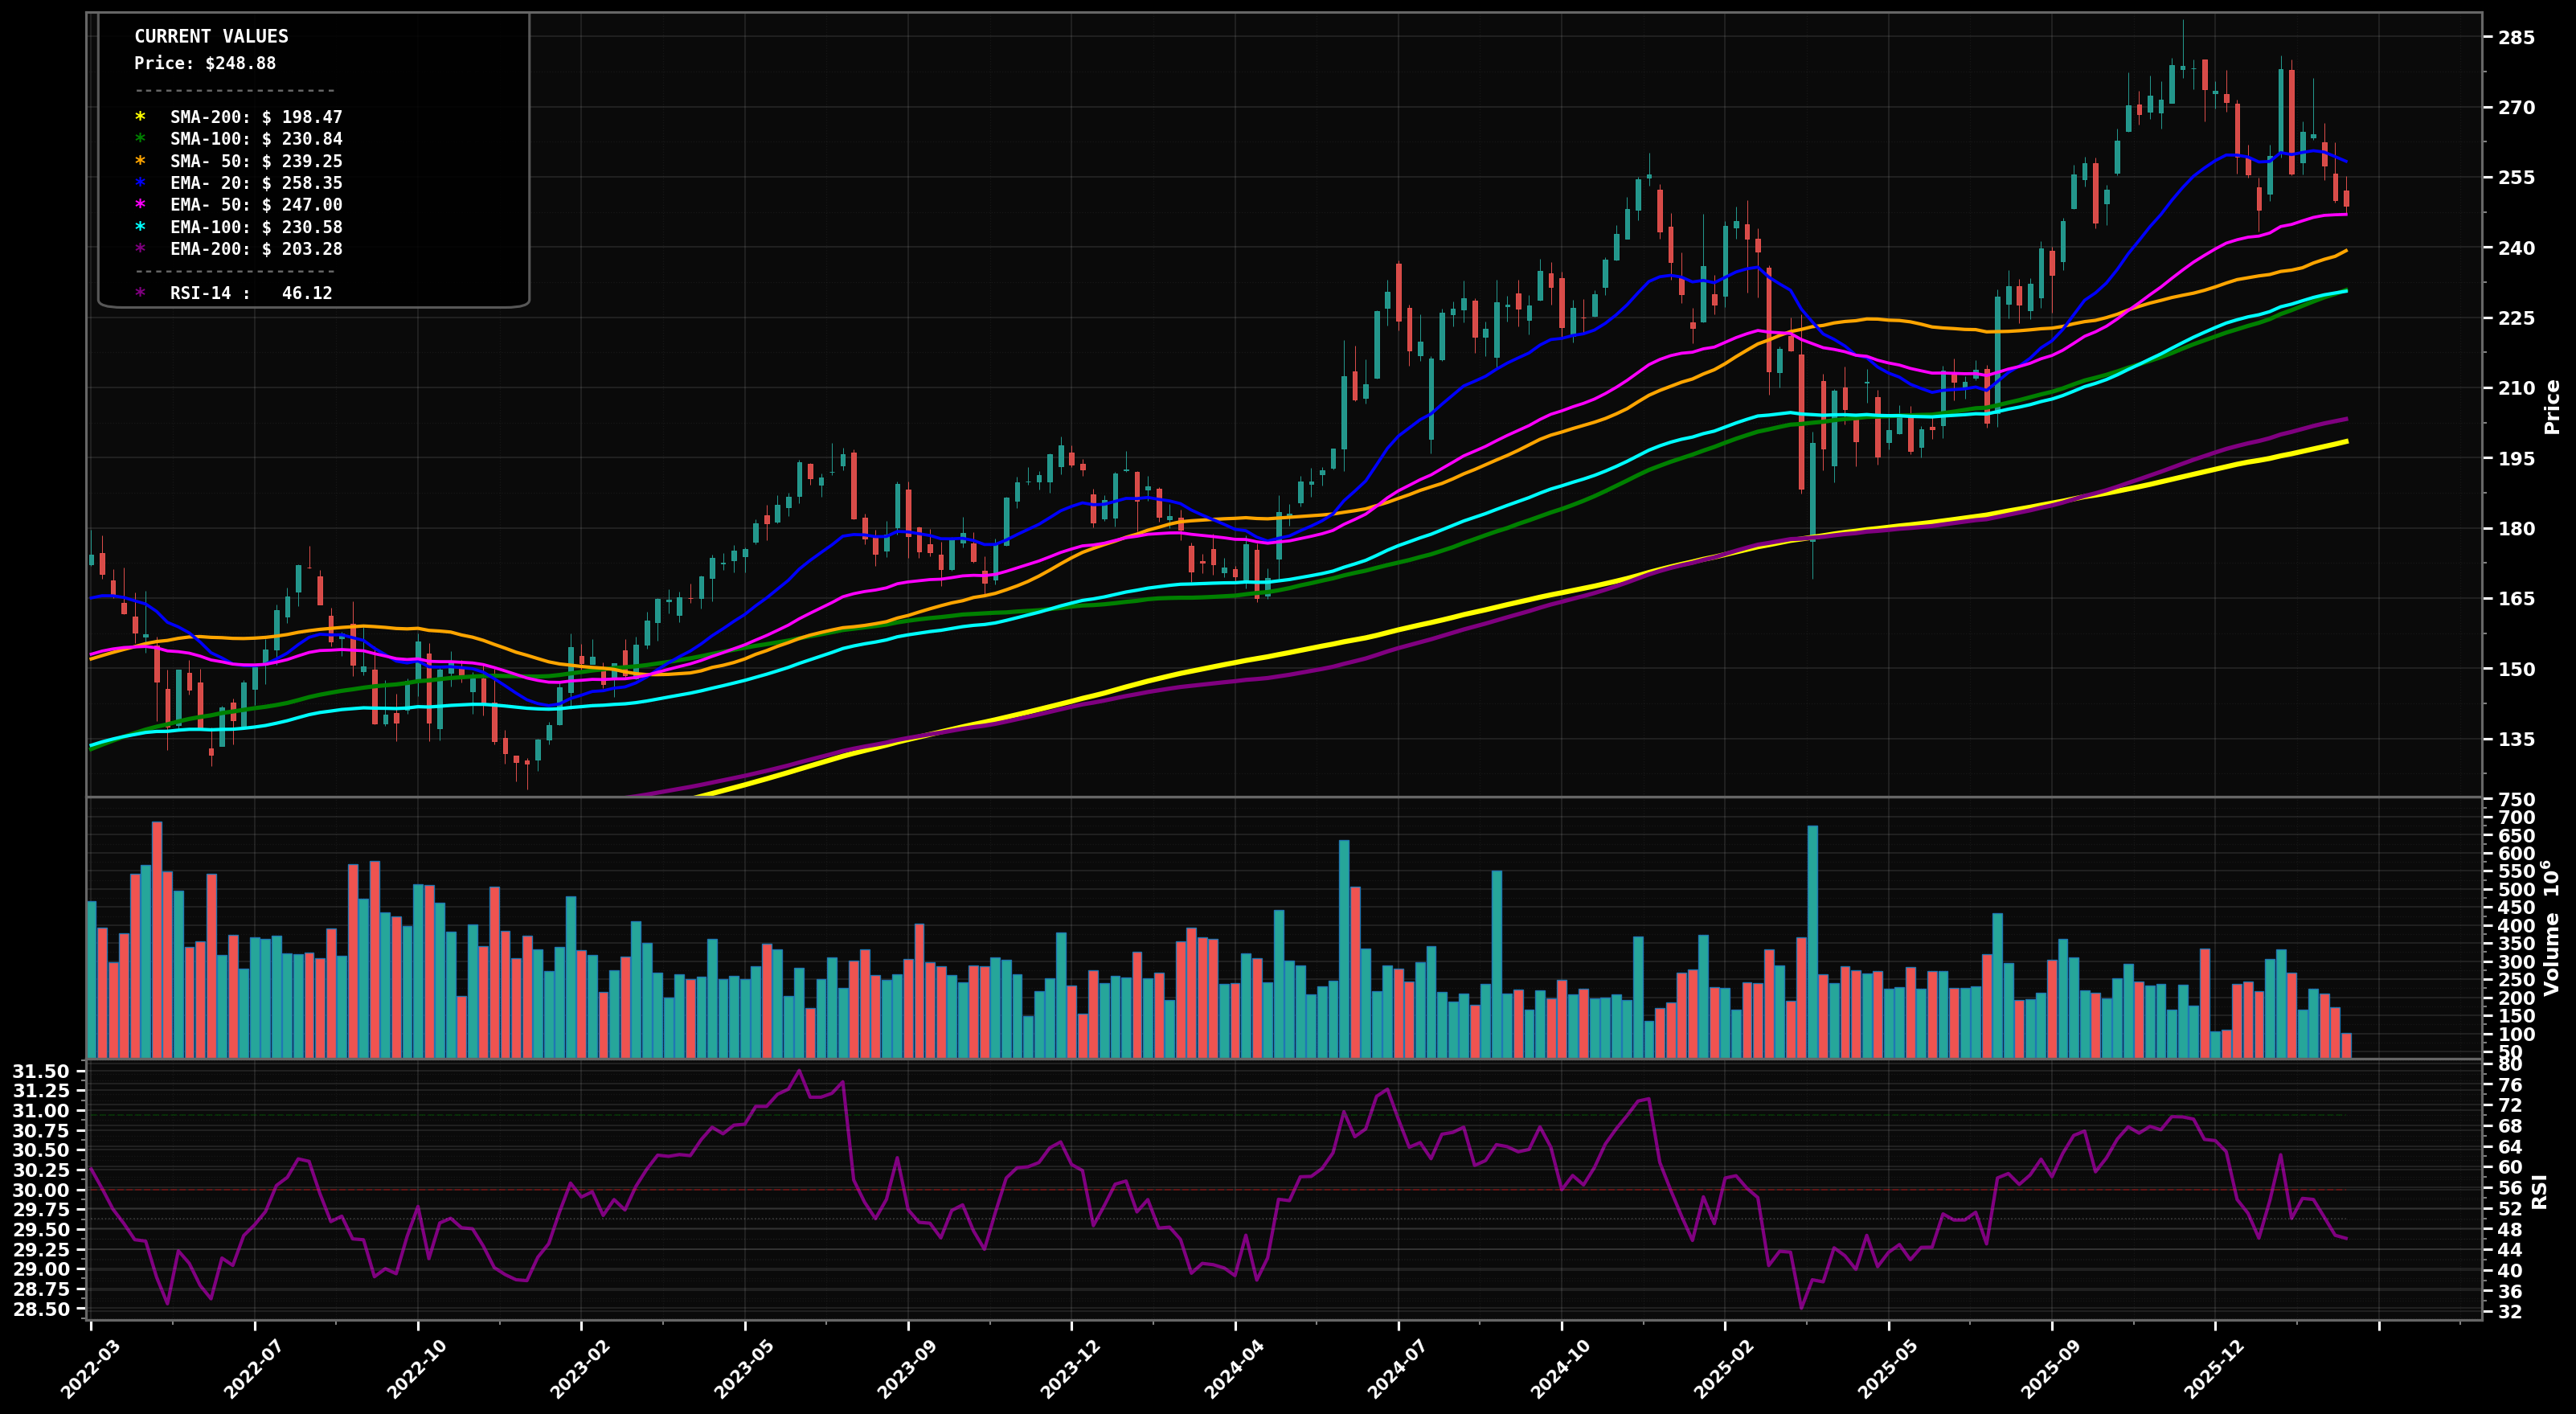
As of May 22, 2026, AAPL (Apple Inc.) is in a uptrend state on the weekly chart, with a confidence level of 78%. Key support is at $270 and key resistance at $315. Weekly breakout to fresh highs; strong green impulse candle with price extended above rising EMA50/EMA100; RSI (~72) overbought but trend intact
Bullish continuation: breakout holds, brief consolidation above prior highs, then push higher; likely Elliott Wave count = wave (3) extension or late wave (5) thrust if this is a mature cycle
Bearish pullback / mean reversion: overbought weekly RSI triggers profit-taking; price revisits broken-resistance zone and EMA50 area before deciding trend continuation (fib-style retrace ~38.2% of the last leg is plausible)
Hold above $300 on weekly closes (2+ consecutive closes) to confirm breakout acceptance
Weekly close below $270 would signal failed breakout and likely deeper pullback
Buy-the-dip zones align with prior breakout area (~$295-$300), then EMA50 region (~mid-$280s), then deeper support near SMA50/structure (~$255-$270) if volatility expands.
Trim into strength as price gets increasingly stretched above EMA50/EMA100 and potential wave (5) excess develops; full exit only in extreme upside extension well beyond trend MAs.
As of May 22, 2026, AAPL (Apple Inc.) is in a uptrend state on the weekly chart with 78% confidence. Weekly breakout to fresh highs; strong green impulse candle with price extended above rising EMA50/EMA100; RSI (~72) overbought but trend intact
On the weekly timeframe, AAPL has key support at $270 and key resistance at $315. The most likely scenario (bullish) targets $315 and $335, with a revert level at $295.
AAPL (Apple Inc.) is currently classified as uptrend on the weekly chart, with 78% confidence. Confirmation requires: Hold above $300 on weekly closes (2+ consecutive closes) to confirm breakout acceptance This would be invalidated by: Weekly close below $270 would signal failed breakout and likely deeper pullback
The most likely scenario (bullish) targets $315 and $335, with a revert level at $295. The alternative scenario (bearish) targets $285 and $270.
Multi-layer AI agents analyse 200+ stocks across daily, weekly, and monthly timeframes — producing market state classifications, price scenarios with targets, and position entry/exit levels. Daily charts updated every trading day at 6 PM ET. Weekly charts refresh Fridays. Monthly charts refresh on the last trading day of each month. No paywall. No sign-up required.
Built by Foliotrail.
All content on this website — including charts, analysis, price targets, support/resistance levels, and position zones — is generated entirely by AI and provided for educational and informational purposes only.
This is not financial advice. NEXUSNOIR VENTURES SL (the operator of this website) is not a registered investment adviser or broker-dealer. You should not make investment decisions based solely on this information. Always do your own research and consult a qualified financial advisor.
By continuing, you acknowledge that you have read and agree to our full disclaimer & terms of use and privacy policy.