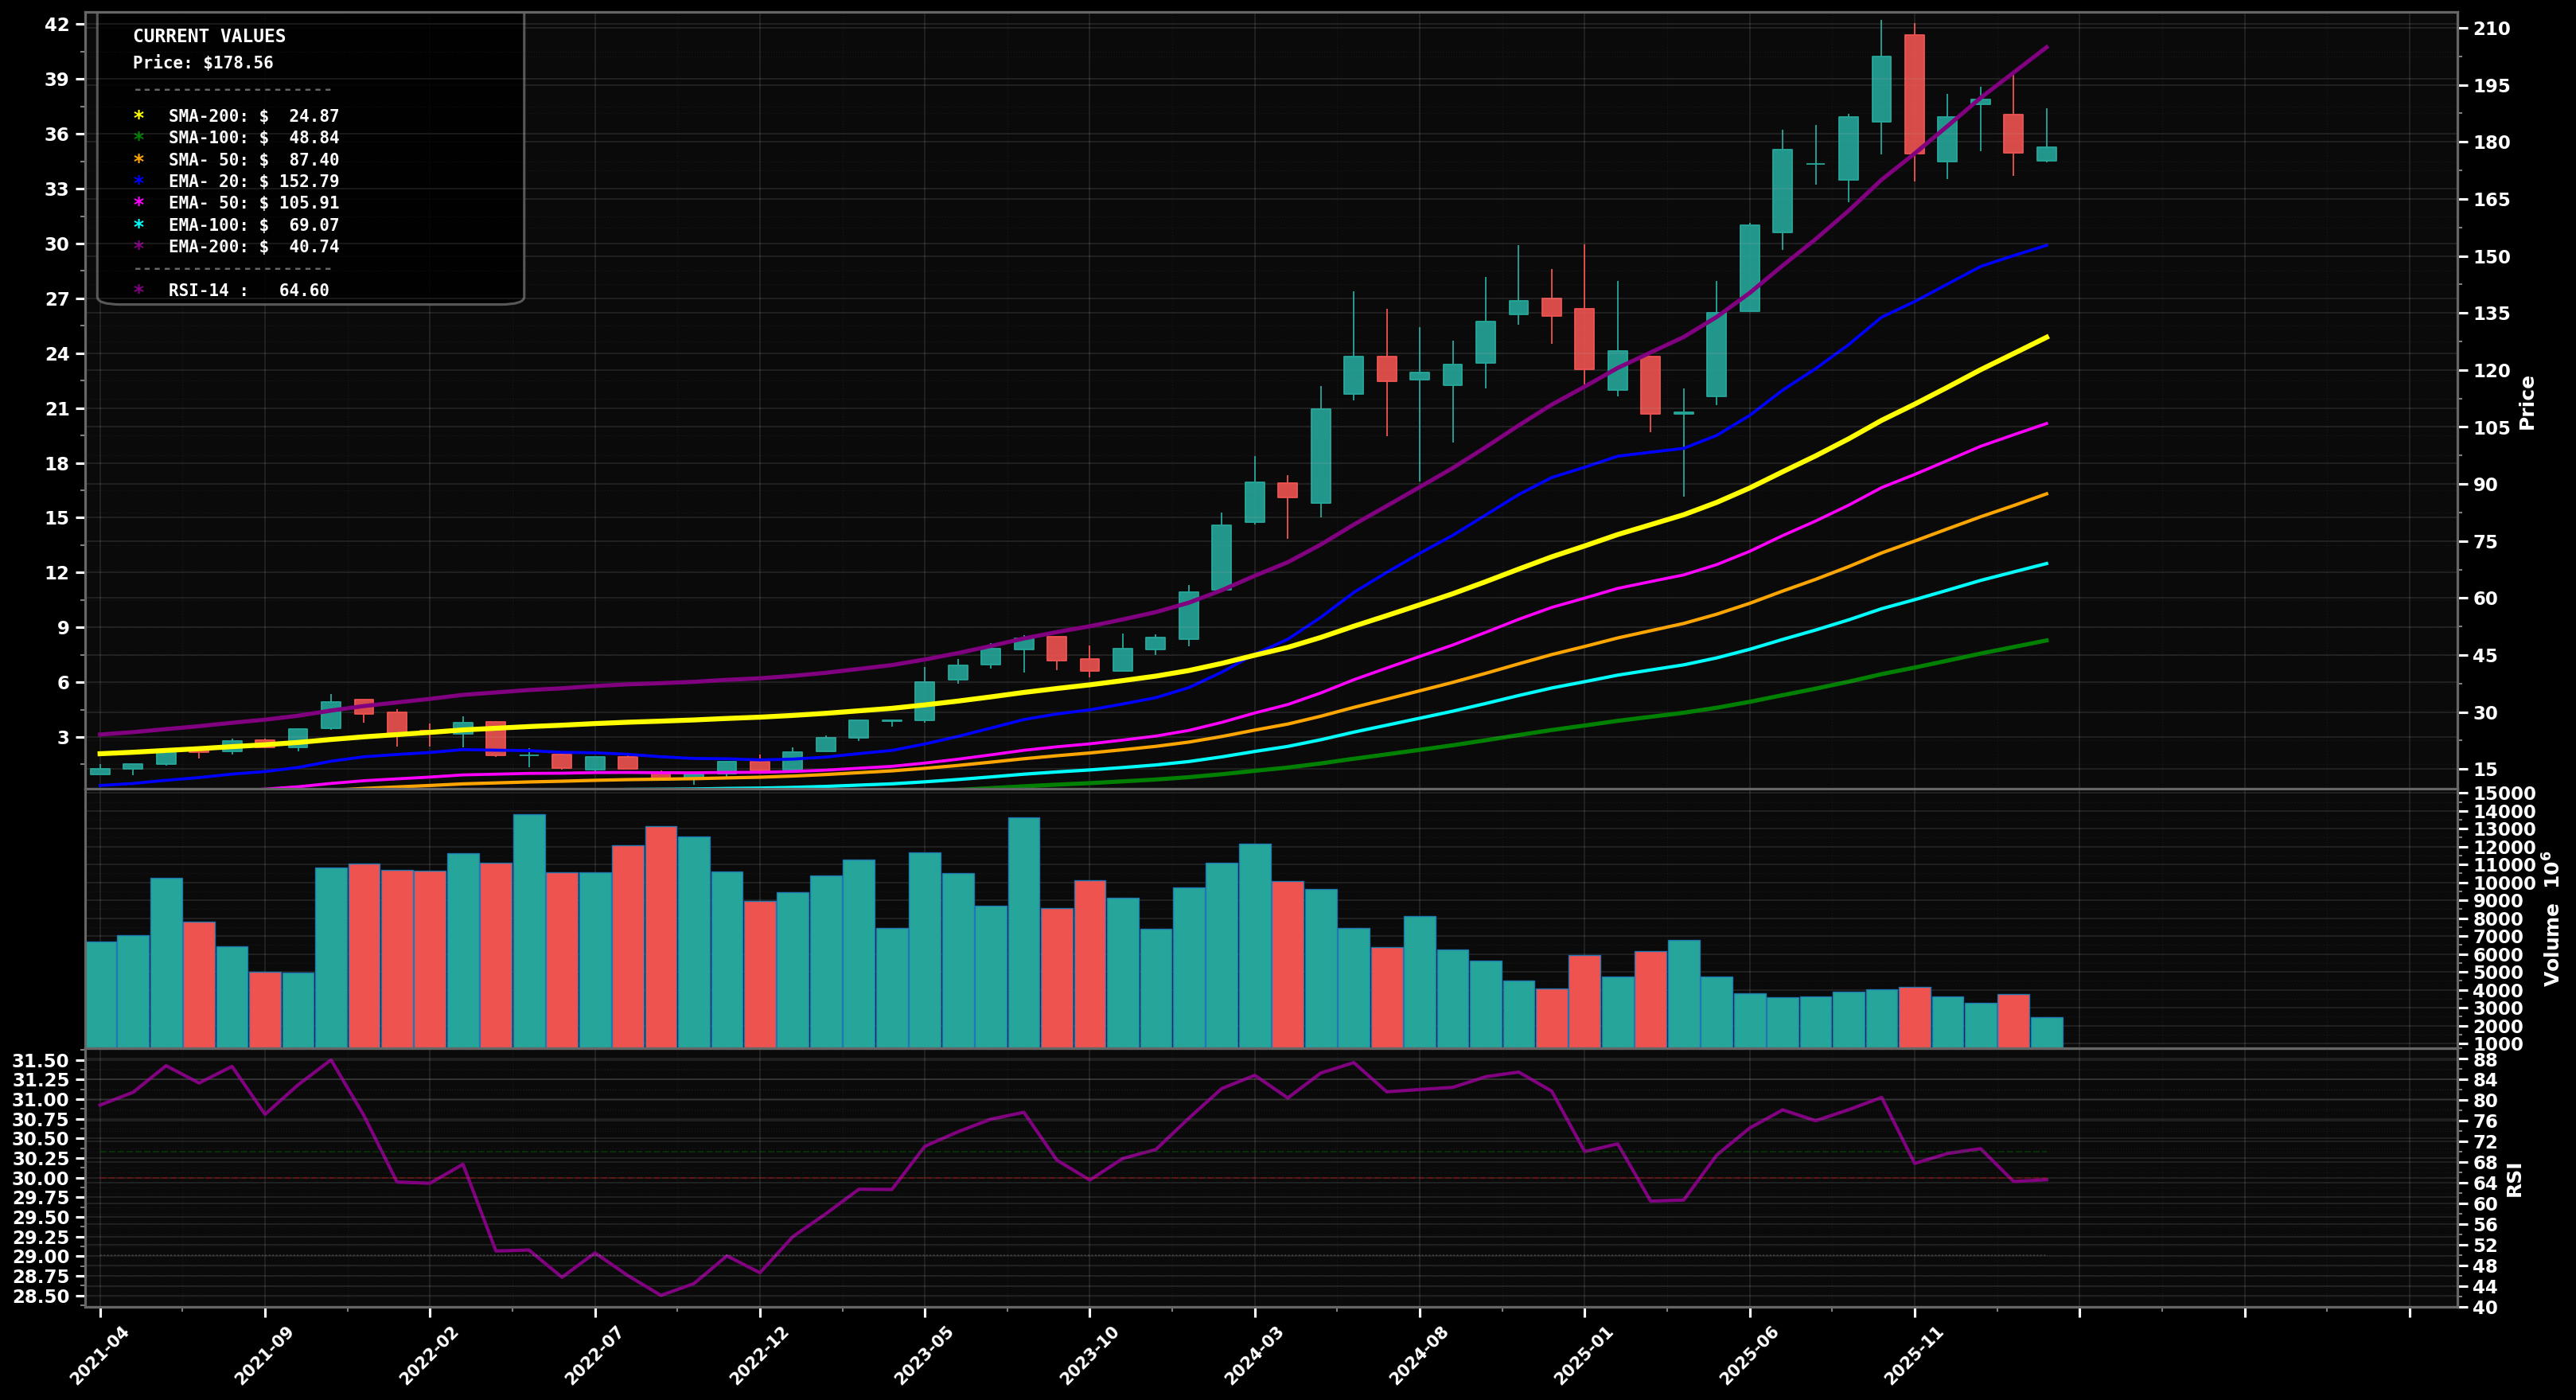
As of May 22, 2026, NVDA (NVIDIA Corporation) is in a uptrend state on the monthly chart, with a confidence level of 78%. Key support is at $180 and key resistance at $220. Monthly candles remain in strong HH/HL structure; price ~$215.26 is far above rising EMA50 (~$113.57) and EMA100 (~$74.41) with RSI-14 ~71.8 (overbought zone), suggesting momentum remains bullish but extended.
Bullish continuation: shallow pullback/consolidation holds above prior breakout zone, then pushes to new highs (prob ~60%). Elliott read: still in a late Wave 3 / early Wave 5-type advance; risk is a Wave 4-style dip that stays above key MAs. Fib extension from the prior impulse suggests upside continuation if $220 breaks.
Bearish mean-reversion: momentum cools with a deeper Wave 4-type correction toward the rising EMA50 zone; price chops then attempts to resume uptrend (prob ~40%). Key is whether $180-$170 holds; losing that opens a larger retrace toward EMA50/previous structure.
Monthly close above $220 with follow-through (next month holds above $220).
Monthly close below $170 (breaks the most recent swing-low area and loses trend momentum).
Bias is buy-the-dip within UPTREND: start near prior support ($180 area), add on deeper Fib retrace into $165-$150, heavy add near EMA50 pink (~$113.6) / larger structure support if a Wave-4 flush occurs.
RSI>70 and price stretched far above EMA50/100: trim into extensions (Fib 1.0–1.272 then 1.618-style zones); close most if price goes vertical into a parabolic overshoot well beyond trend MAs.
As of May 22, 2026, NVDA (NVIDIA Corporation) is in a uptrend state on the monthly chart with 78% confidence. Monthly candles remain in strong HH/HL structure; price ~$215.26 is far above rising EMA50 (~$113.57) and EMA100 (~$74.41) with RSI-14 ~71.8 (overbought zone), suggesting momentum remains bullish but extended.
On the monthly timeframe, NVDA has key support at $180 and key resistance at $220. The most likely scenario (bullish) targets $230 and $250, with a revert level at $200.
NVDA (NVIDIA Corporation) is currently classified as uptrend on the monthly chart, with 78% confidence. Confirmation requires: Monthly close above $220 with follow-through (next month holds above $220). This would be invalidated by: Monthly close below $170 (breaks the most recent swing-low area and loses trend momentum).
The most likely scenario (bullish) targets $230 and $250, with a revert level at $200. The alternative scenario (bearish) targets $170 and $140.
Multi-layer AI agents analyse 200+ stocks across daily, weekly, and monthly timeframes — producing market state classifications, price scenarios with targets, and position entry/exit levels. Daily charts updated every trading day at 6 PM ET. Weekly charts refresh Fridays. Monthly charts refresh on the last trading day of each month. No paywall. No sign-up required.
Built by Foliotrail.
All content on this website — including charts, analysis, price targets, support/resistance levels, and position zones — is generated entirely by AI and provided for educational and informational purposes only.
This is not financial advice. NEXUSNOIR VENTURES SL (the operator of this website) is not a registered investment adviser or broker-dealer. You should not make investment decisions based solely on this information. Always do your own research and consult a qualified financial advisor.
By continuing, you acknowledge that you have read and agree to our full disclaimer & terms of use and privacy policy.