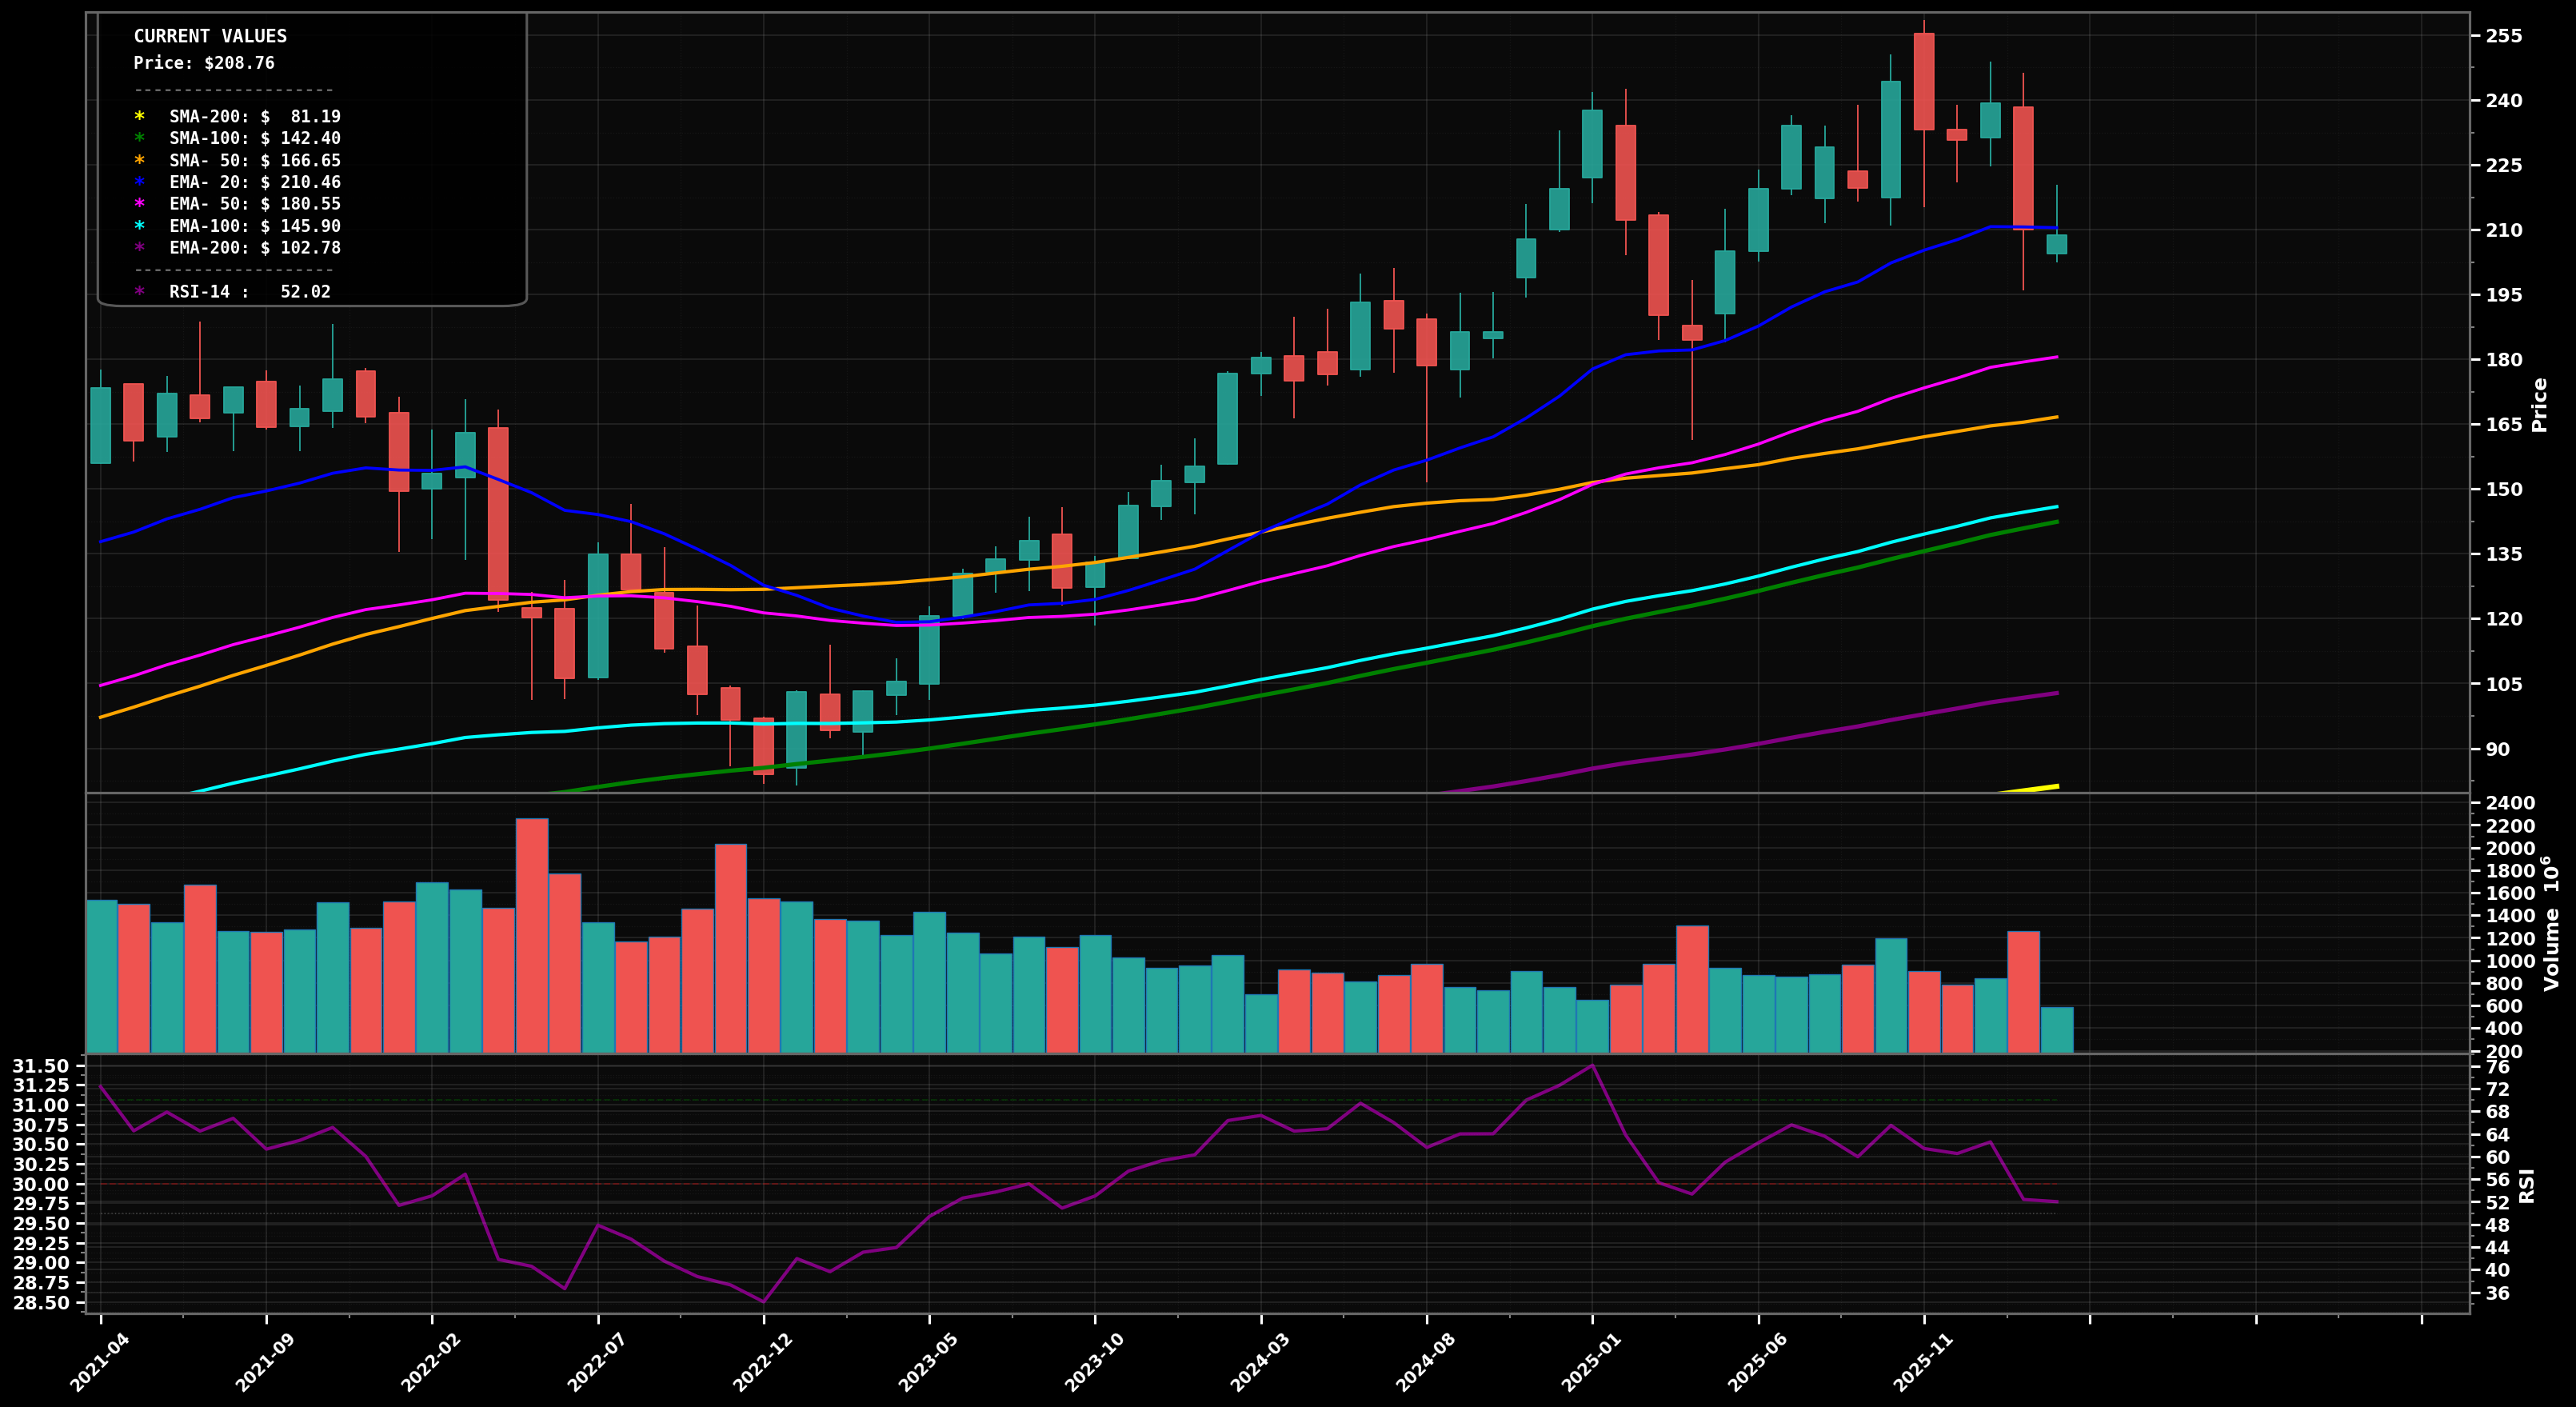
As of May 22, 2026, AMZN (Amazon.com, Inc.) is in a uptrend state on the monthly chart, with a confidence level of 78%. Key support is at $210 and key resistance at $270. Monthly HH/HL structure; strong impulsive push to new cycle highs near $270 after a sharp shakeout toward ~$200; price holding well above rising EMA50/EMA100 (pink/cyan).
Continuation: price consolidates below $270 then breaks out to new highs; momentum remains constructive while above $210, suggesting an Elliott impulse continuation (likely wave 5 extension) after a wave-4 style shakeout.
Deeper pullback: rejection at/near $270 leads to a mean-reversion toward the rising EMA20/EMA50 area; still a bull-market pullback unless $210 fails (would shift structure to LH risk).
Monthly close above $270 with follow-through hold (next close not back below $260).
Monthly close below $210 (break of the most recent swing-low reference zone).
Scale-in around prior breakout/failed-break retest ($230-$215), then deeper demand at prior swing support/psych ($210-$200); heavy add into EMA50 region (~$187) if reached while trend MAs stay rising.
Trim into strength near round-number extensions above the $270 breakout (typical fib/psychological targets), with heavier trimming as price gets increasingly stretched above EMA50/EMA100 on monthly.
As of May 22, 2026, AMZN (Amazon.com, Inc.) is in a uptrend state on the monthly chart with 78% confidence. Monthly HH/HL structure; strong impulsive push to new cycle highs near $270 after a sharp shakeout toward ~$200; price holding well above rising EMA50/EMA100 (pink/cyan).
On the monthly timeframe, AMZN has key support at $210 and key resistance at $270. The most likely scenario (bullish) targets $285 and $300, with a revert level at $250.
AMZN (Amazon.com, Inc.) is currently classified as uptrend on the monthly chart, with 78% confidence. Confirmation requires: Monthly close above $270 with follow-through hold (next close not back below $260). This would be invalidated by: Monthly close below $210 (break of the most recent swing-low reference zone).
The most likely scenario (bullish) targets $285 and $300, with a revert level at $250. The alternative scenario (bearish) targets $230 and $210.
Multi-layer AI agents analyse 200+ stocks across daily, weekly, and monthly timeframes — producing market state classifications, price scenarios with targets, and position entry/exit levels. Daily charts updated every trading day at 6 PM ET. Weekly charts refresh Fridays. Monthly charts refresh on the last trading day of each month. No paywall. No sign-up required.
Built by Foliotrail.
All content on this website — including charts, analysis, price targets, support/resistance levels, and position zones — is generated entirely by AI and provided for educational and informational purposes only.
This is not financial advice. NEXUSNOIR VENTURES SL (the operator of this website) is not a registered investment adviser or broker-dealer. You should not make investment decisions based solely on this information. Always do your own research and consult a qualified financial advisor.
By continuing, you acknowledge that you have read and agree to our full disclaimer & terms of use and privacy policy.