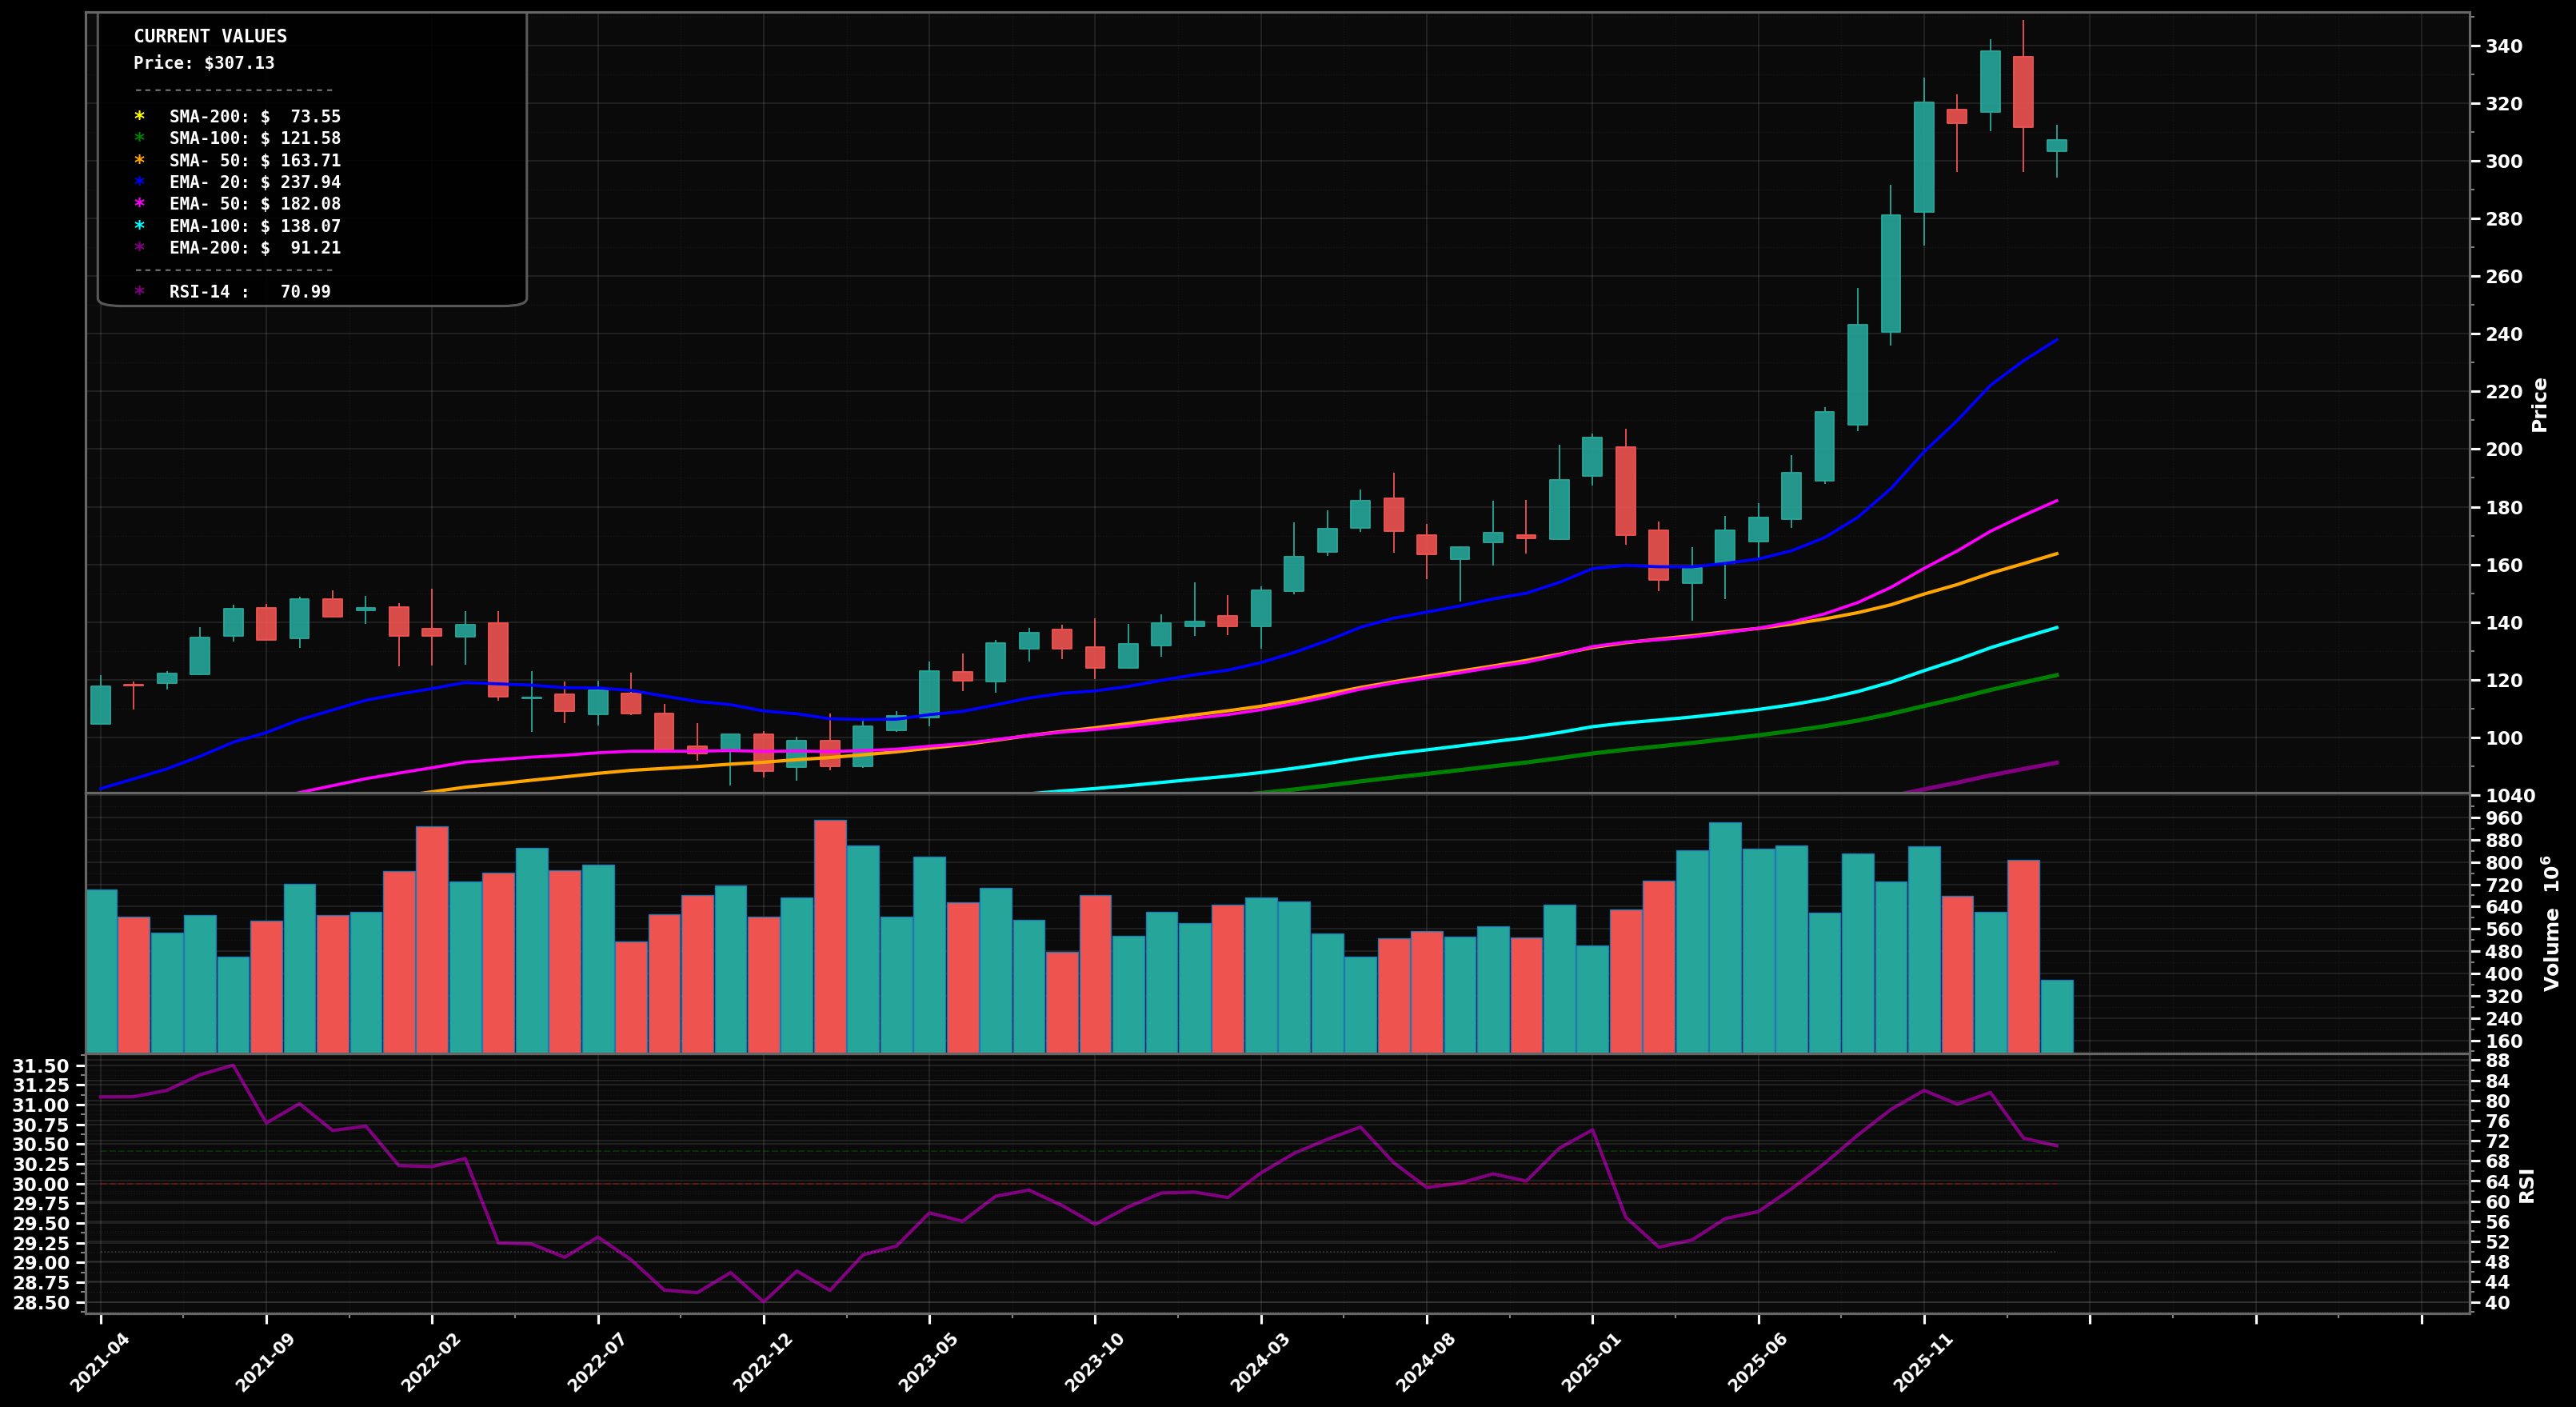
As of May 22, 2026, GOOGL (Alphabet Inc.) is in a parabolic state on the monthly chart, with a confidence level of 72%. Key support is at $300 and key resistance at $400. Monthly uptrend accelerated into a strong impulse; brief pullback then continuation to fresh highs with price ~$382.88 far above EMA50/100 and RSI-14 ~75 (overbought).
Bullish continuation after a shallow consolidation: price digests above the breakout zone (~$350) then pushes through the psychological $400 and trends toward the next extension area.
Mean-reversion/ABC pullback (Wave 4 style): rejection near $400 followed by a deeper retrace toward the rising EMA50 area before attempting another leg higher.
Hold above $350 on monthly closes (no breakdown back under the breakout zone).
Monthly close below $300 (loss of last major swing support / reclaim failure).
Buy-the-dip zones align with prior breakout retest ($350), then deeper Fib/structure support around $300 and a higher-probability mean-reversion tag of the rising EMA50 region ($230–$265).
Trim into extension/resistance: first into $400+ (psych + likely Fib extension), more trimming if momentum carries into higher Fib extensions, and full exit only if price becomes multi-year stretched relative to the long MAs (EMA100/200 and SMA200 far below).
As of May 22, 2026, GOOGL (Alphabet Inc.) is in a parabolic state on the monthly chart with 72% confidence. Monthly uptrend accelerated into a strong impulse; brief pullback then continuation to fresh highs with price ~$382.88 far above EMA50/100 and RSI-14 ~75 (overbought).
On the monthly timeframe, GOOGL has key support at $300 and key resistance at $400. The most likely scenario (bullish) targets $400 and $445, with a revert level at $350.
GOOGL (Alphabet Inc.) is currently classified as parabolic on the monthly chart, with 72% confidence. Confirmation requires: Hold above $350 on monthly closes (no breakdown back under the breakout zone). This would be invalidated by: Monthly close below $300 (loss of last major swing support / reclaim failure).
The most likely scenario (bullish) targets $400 and $445, with a revert level at $350. The alternative scenario (bearish) targets $320 and $265.
Multi-layer AI agents analyse 200+ stocks across daily, weekly, and monthly timeframes — producing market state classifications, price scenarios with targets, and position entry/exit levels. Daily charts updated every trading day at 6 PM ET. Weekly charts refresh Fridays. Monthly charts refresh on the last trading day of each month. No paywall. No sign-up required.
Built by Foliotrail.
All content on this website — including charts, analysis, price targets, support/resistance levels, and position zones — is generated entirely by AI and provided for educational and informational purposes only.
This is not financial advice. NEXUSNOIR VENTURES SL (the operator of this website) is not a registered investment adviser or broker-dealer. You should not make investment decisions based solely on this information. Always do your own research and consult a qualified financial advisor.
By continuing, you acknowledge that you have read and agree to our full disclaimer & terms of use and privacy policy.