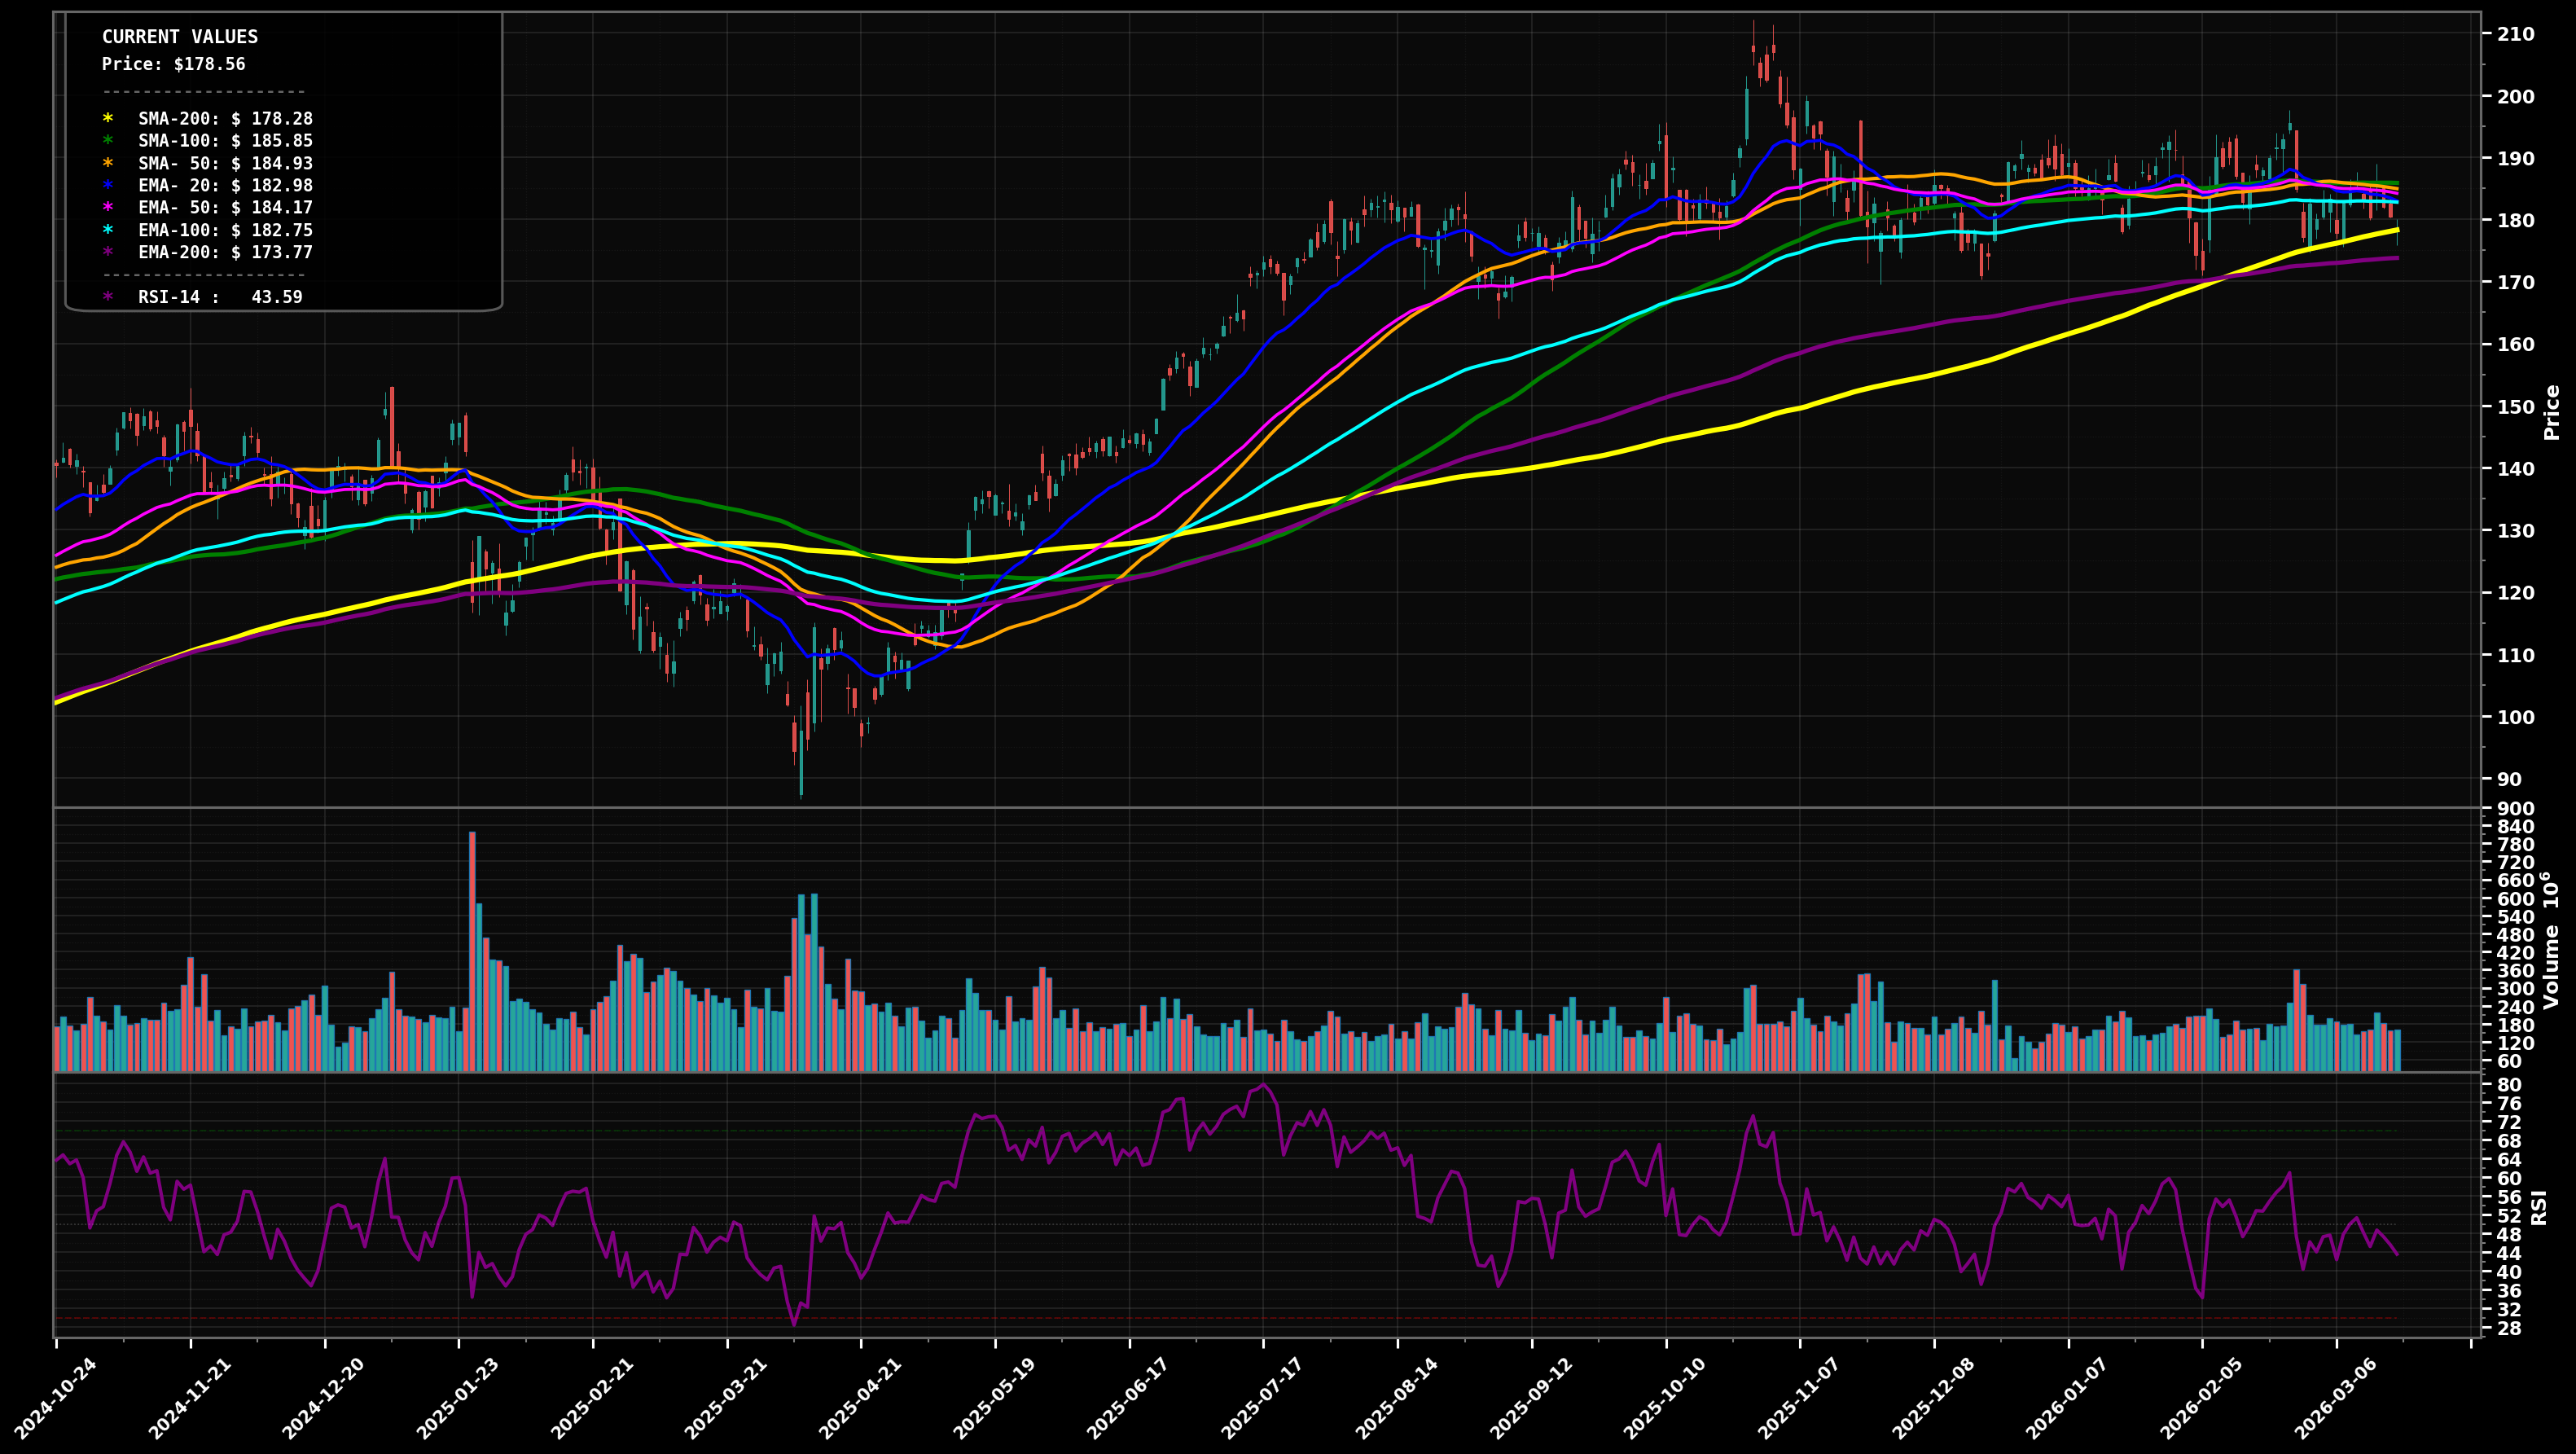
As of May 22, 2026, NVDA (NVIDIA Corporation) is in a uptrend state on the daily chart, with a confidence level of 72%. Key support is at $203 and key resistance at $223. Sharp breakout from the ~$180-$190 base into a new high near ~$230, followed by a pullback/flag back toward the rising short-term averages; price ~$215 holding above EMA50/EMA100 with RSI ~54 cooling.
Bullish continuation: pullback completes as a wave-4 style flag above EMA50, then price attempts a wave-5 push to retest/clear the prior high; Fibonacci focus: a shallow retrace (roughly 23.6%-38.2% of the ~$170->$230 impulse) typically resolves higher in strong trends.
Deeper correction: wave-5 fails and price mean-reverts to the prior breakout zone/EMA100; this would look like a larger ABC pullback with the base top acting as support (risk increases if multiple closes occur below EMA50).
Daily close back above $223 with follow-through (2+ closes holding above $223)
Daily close below $203 (EMA50) and then failure to quickly reclaim it
Scale-in around EMA50 then EMA100; heavy add near the prior base top/SMA200 (~$187) where trend buyers typically defend if the breakout remains valid.
Trim into prior-high retest and potential wave-5 extension; increase derisking if price becomes stretched far above rising EMA50/100 and RSI re-accelerates while volatility expands.
As of May 22, 2026, NVDA (NVIDIA Corporation) is in a uptrend state on the daily chart with 72% confidence. Sharp breakout from the ~$180-$190 base into a new high near ~$230, followed by a pullback/flag back toward the rising short-term averages; price ~$215 holding above EMA50/EMA100 with RSI ~54 cooling.
On the daily timeframe, NVDA has key support at $203 and key resistance at $223. The most likely scenario (bullish) targets $223 and $235, with a revert level at $210.
NVDA (NVIDIA Corporation) is currently classified as uptrend on the daily chart, with 72% confidence. Confirmation requires: Daily close back above $223 with follow-through (2+ closes holding above $223) This would be invalidated by: Daily close below $203 (EMA50) and then failure to quickly reclaim it
The most likely scenario (bullish) targets $223 and $235, with a revert level at $210. The alternative scenario (bearish) targets $195 and $187.
Multi-layer AI agents analyse 200+ stocks across daily, weekly, and monthly timeframes — producing market state classifications, price scenarios with targets, and position entry/exit levels. Daily charts updated every trading day at 6 PM ET. Weekly charts refresh Fridays. Monthly charts refresh on the last trading day of each month. No paywall. No sign-up required.
Built by Foliotrail.
All content on this website — including charts, analysis, price targets, support/resistance levels, and position zones — is generated entirely by AI and provided for educational and informational purposes only.
This is not financial advice. NEXUSNOIR VENTURES SL (the operator of this website) is not a registered investment adviser or broker-dealer. You should not make investment decisions based solely on this information. Always do your own research and consult a qualified financial advisor.
By continuing, you acknowledge that you have read and agree to our full disclaimer & terms of use and privacy policy.