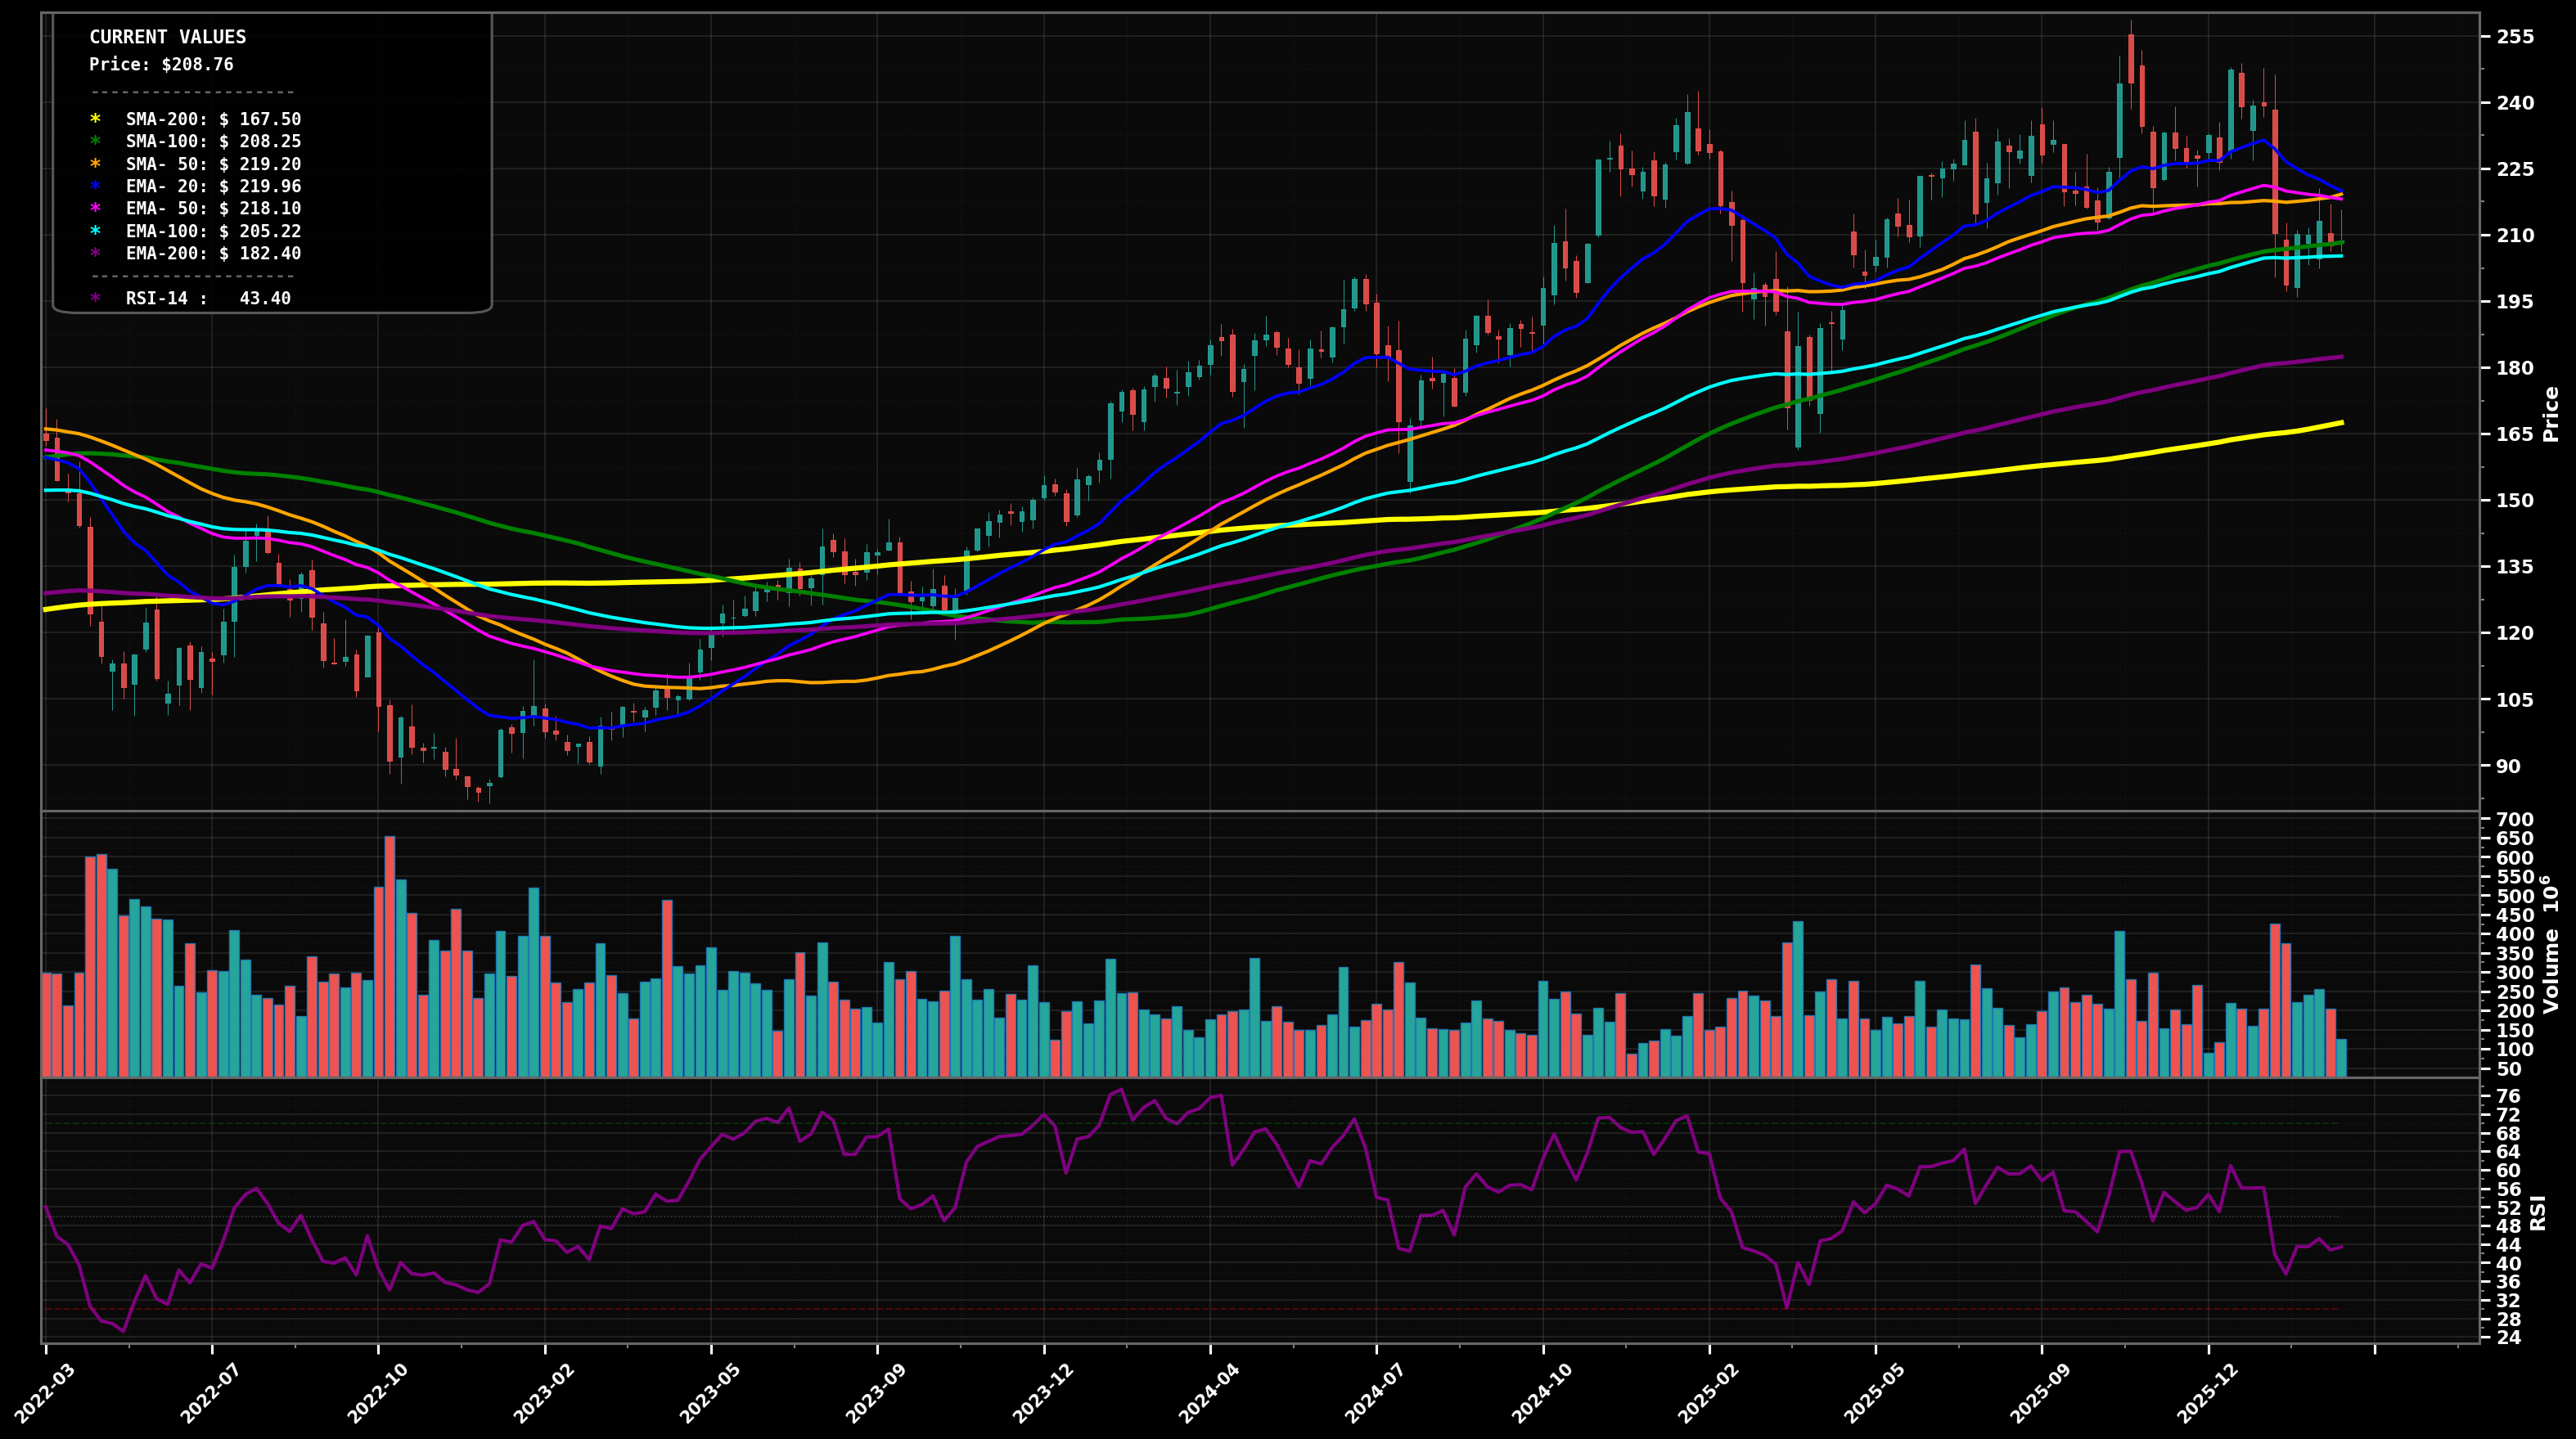
As of May 22, 2026, AMZN (Amazon.com, Inc.) is in a uptrend state on the weekly chart, with a confidence level of 74%. Key support is at $240 and key resistance at $270. Weekly uptrend intact; sharp rally to new swing high near $270 followed by small pullback/inside-type consolidation around $266 while holding above rising EMA50/EMA100 and above the prior breakout area.
Bullish continuation: current pullback resolves as a shallow Wave 4 consolidation above the breakout zone, then price attempts a Wave 5 push to marginal new highs; first resistance is the prior peak area, then an extension leg if momentum/volume expands.
Deeper corrective reset: a failed immediate breakout leads to a multi-week pullback toward the rising weekly EMA50/SMA50 cluster (mean reversion) consistent with a Wave 4 that retraces ~38.2% of the latest impulse; buyers likely defend that zone if the larger trend remains intact.
Weekly close back above $270
Weekly close below $240
Start on retest of the breakout/round-number support ($240–$255); add at EMA50/SMA50 confluence (~$228–$235); heavy add near EMA100/SMA100 confluence (~$212–$216) assuming no weekly close breakdown.
Trim into upside extensions beyond the prior high ($270) where price likely gets stretched vs EMA50/EMA100; increase trimming on large Fibonacci extension zones, and fully exit only if a multi-year valuation/price extension occurs well above trend MAs.
As of May 22, 2026, AMZN (Amazon.com, Inc.) is in a uptrend state on the weekly chart with 74% confidence. Weekly uptrend intact; sharp rally to new swing high near $270 followed by small pullback/inside-type consolidation around $266 while holding above rising EMA50/EMA100 and above the prior breakout area.
On the weekly timeframe, AMZN has key support at $240 and key resistance at $270. The most likely scenario (bullish) targets $270 and $285, with a revert level at $255.
AMZN (Amazon.com, Inc.) is currently classified as uptrend on the weekly chart, with 74% confidence. Confirmation requires: Weekly close back above $270 This would be invalidated by: Weekly close below $240
The most likely scenario (bullish) targets $270 and $285, with a revert level at $255. The alternative scenario (bearish) targets $228 and $214.
Multi-layer AI agents analyse 200+ stocks across daily, weekly, and monthly timeframes — producing market state classifications, price scenarios with targets, and position entry/exit levels. Daily charts updated every trading day at 6 PM ET. Weekly charts refresh Fridays. Monthly charts refresh on the last trading day of each month. No paywall. No sign-up required.
Built by Foliotrail.
All content on this website — including charts, analysis, price targets, support/resistance levels, and position zones — is generated entirely by AI and provided for educational and informational purposes only.
This is not financial advice. NEXUSNOIR VENTURES SL (the operator of this website) is not a registered investment adviser or broker-dealer. You should not make investment decisions based solely on this information. Always do your own research and consult a qualified financial advisor.
By continuing, you acknowledge that you have read and agree to our full disclaimer & terms of use and privacy policy.