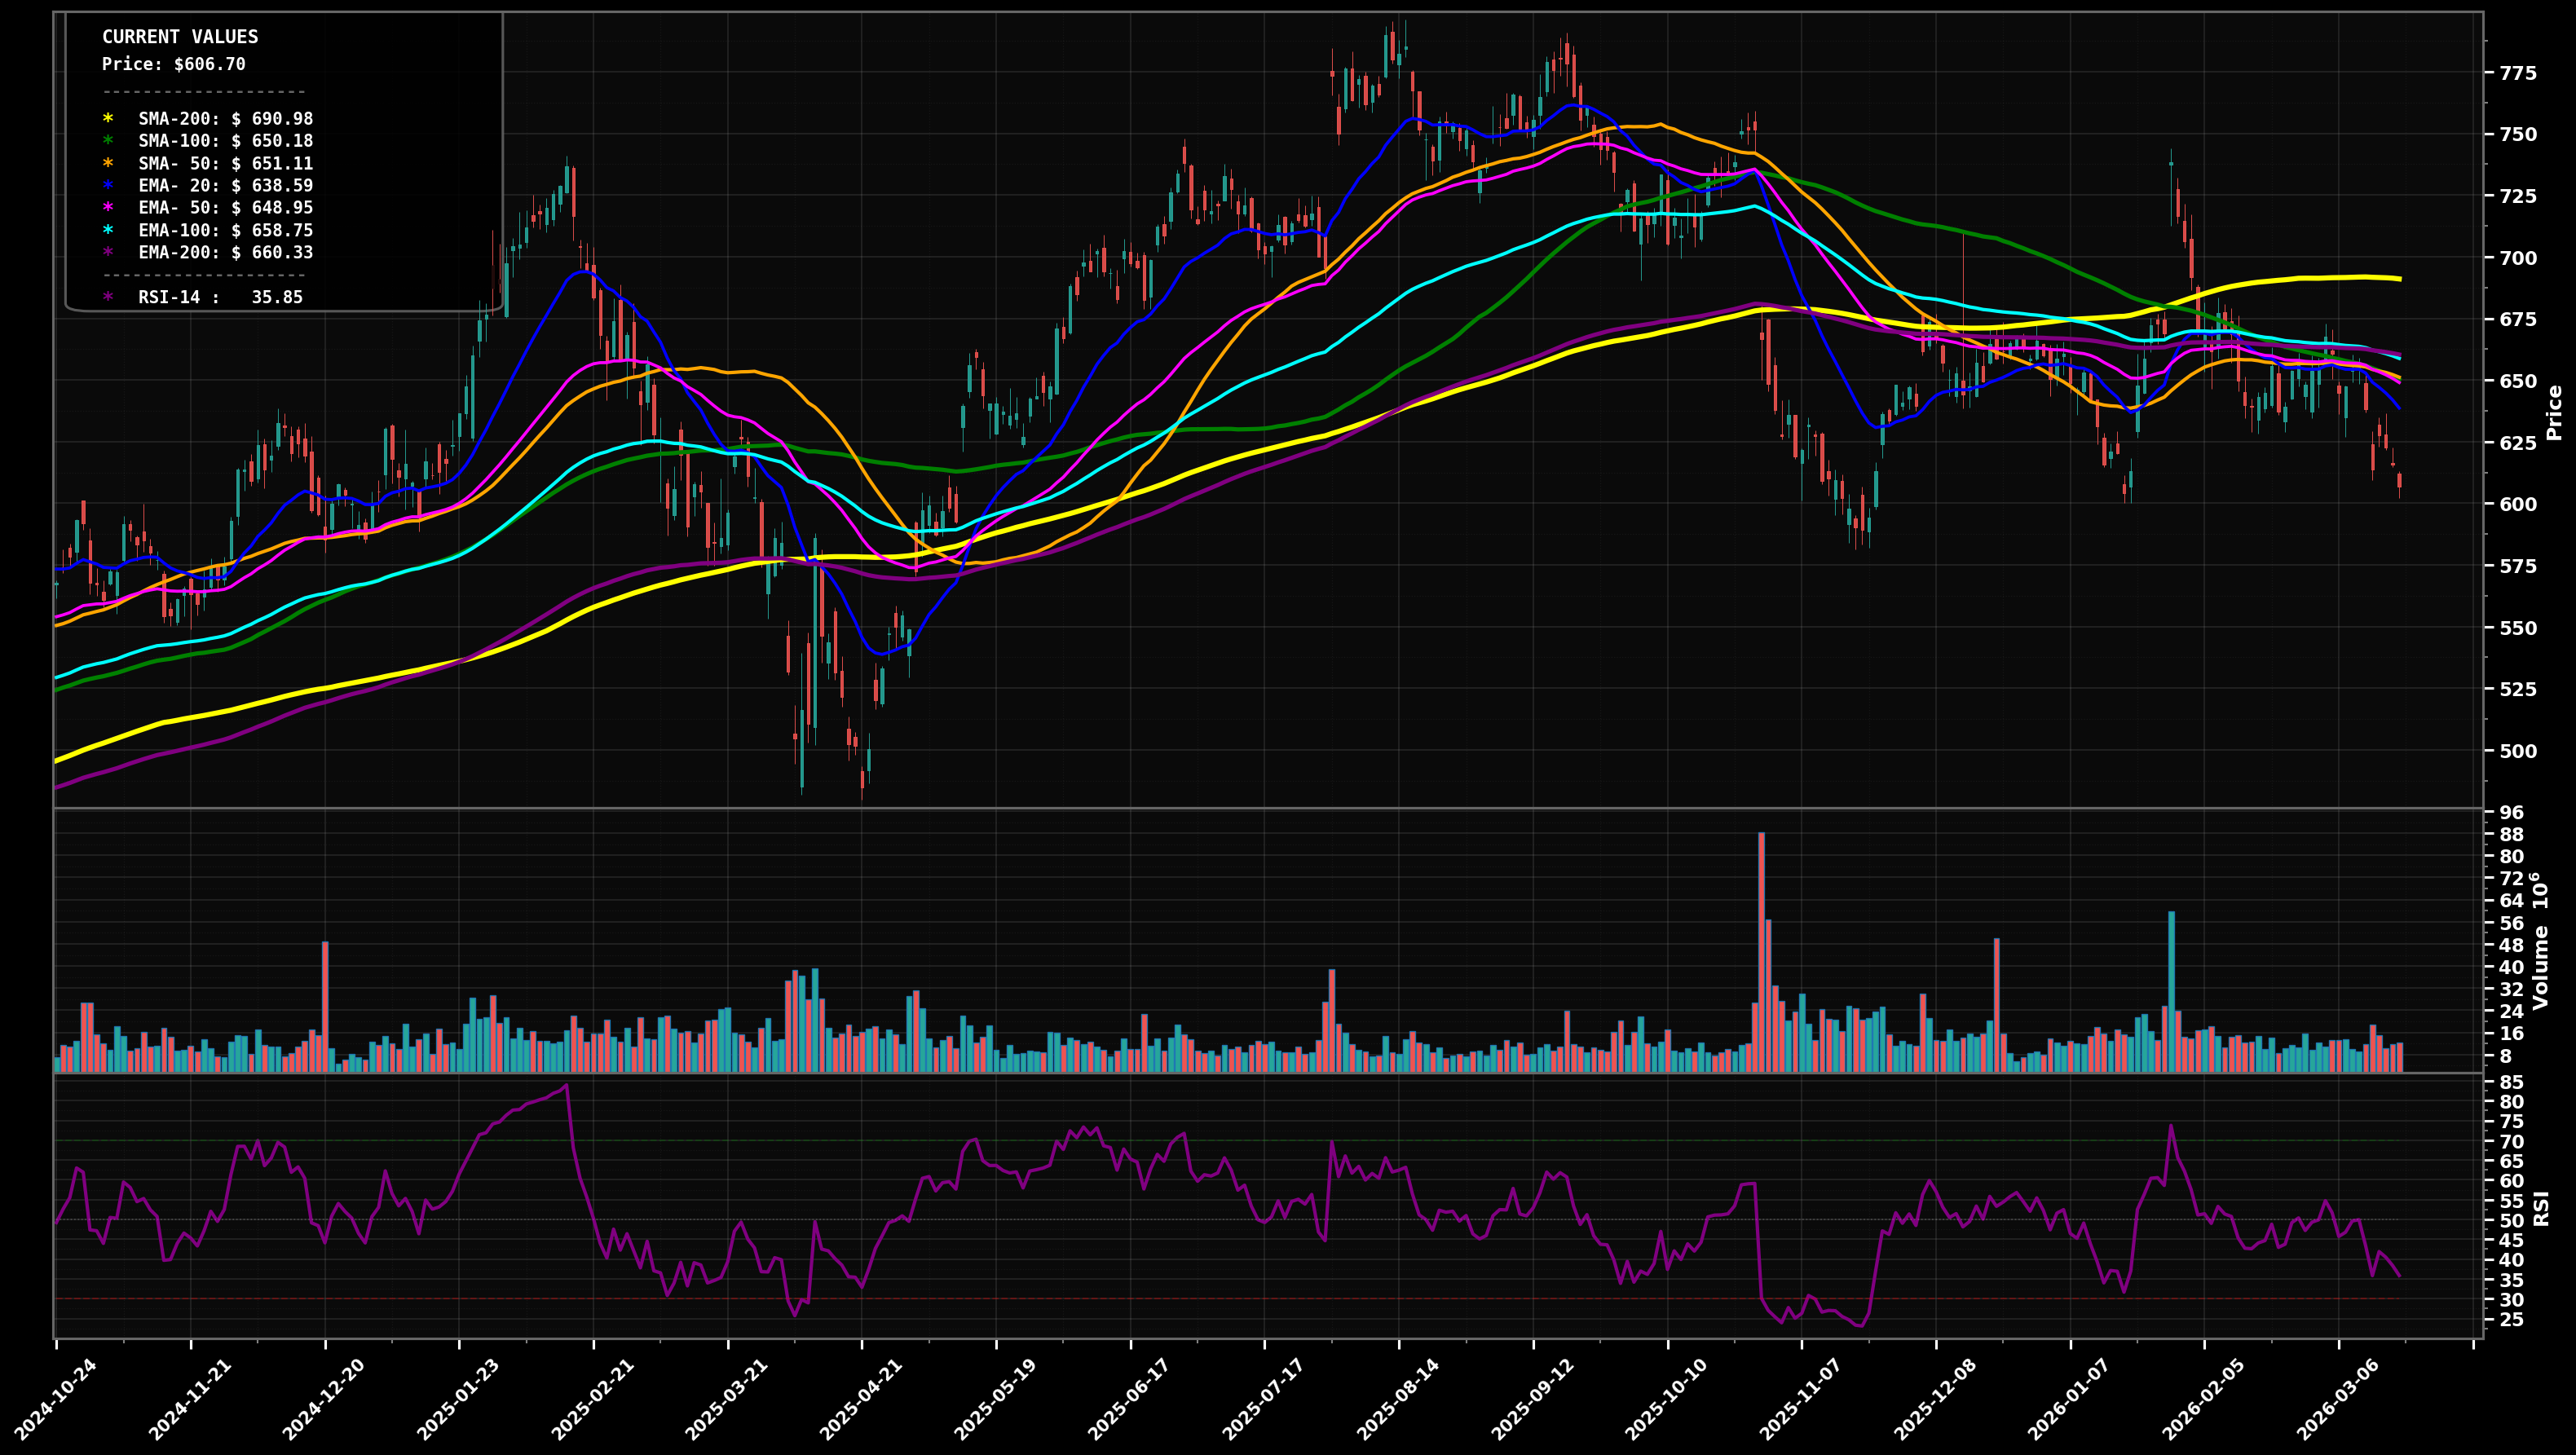
As of May 22, 2026, META (Meta Platforms Inc Class A) is in a downtrend state on the daily chart, with a confidence level of 68%. Key support is at $600 and key resistance at $636. Price at $610.42 is consolidating below the cluster of EMA50 ($625) / EMA100 ($636) / EMA200 ($646) and under SMA100 ($637) & SMA200 ($669); bounce attempts keep failing near $630-$650.
Base-to-bear continuation: lose $600, sweep the recent swing low zone, then attempt a reflex bounce back into the moving-average cluster (Elliott: likely still in a corrective/impulsive leg down; fib magnet = prior demand around the ~$585-$560 pocket).
Bottoming attempt via higher low: hold $600, reclaim EMA50 (~$625) and then EMA100 (~$636); that would favor an Elliott Wave view of a completed 5-down/ABC and start of a new upswing toward the prior breakdown shelf.
Daily close below $600 followed by a break under $585
2+ daily closes back above $636 (EMA100) with follow-through toward $646+
Scale near pivot support ($600), add into next demand shelf ($585 area), heavy add into prior capitulation/wick zone (~$560) if it holds (risk defined by a clean breakdown).
Trim into major overhead MAs (SMA200 ~$669) and prior supply zones ($700-$750); close if price becomes stretched back toward the old peak extension area ($775+), where reversal risk historically rises.
As of May 22, 2026, META (Meta Platforms Inc Class A) is in a downtrend state on the daily chart with 68% confidence. Price at $610.42 is consolidating below the cluster of EMA50 ($625) / EMA100 ($636) / EMA200 ($646) and under SMA100 ($637) & SMA200 ($669); bounce attempts keep failing near $630-$650.
On the daily timeframe, META has key support at $600 and key resistance at $636. The most likely scenario (bearish) targets $585 and $560, with a revert level at $615.
META (Meta Platforms Inc Class A) is currently classified as downtrend on the daily chart, with 68% confidence. Confirmation requires: Daily close below $600 followed by a break under $585 This would be invalidated by: 2+ daily closes back above $636 (EMA100) with follow-through toward $646+
The most likely scenario (bearish) targets $585 and $560, with a revert level at $615. The alternative scenario (bullish) targets $625 and $650.
Multi-layer AI agents analyse 200+ stocks across daily, weekly, and monthly timeframes — producing market state classifications, price scenarios with targets, and position entry/exit levels. Daily charts updated every trading day at 6 PM ET. Weekly charts refresh Fridays. Monthly charts refresh on the last trading day of each month. No paywall. No sign-up required.
Built by Foliotrail.
All content on this website — including charts, analysis, price targets, support/resistance levels, and position zones — is generated entirely by AI and provided for educational and informational purposes only.
This is not financial advice. NEXUSNOIR VENTURES SL (the operator of this website) is not a registered investment adviser or broker-dealer. You should not make investment decisions based solely on this information. Always do your own research and consult a qualified financial advisor.
By continuing, you acknowledge that you have read and agree to our full disclaimer & terms of use and privacy policy.