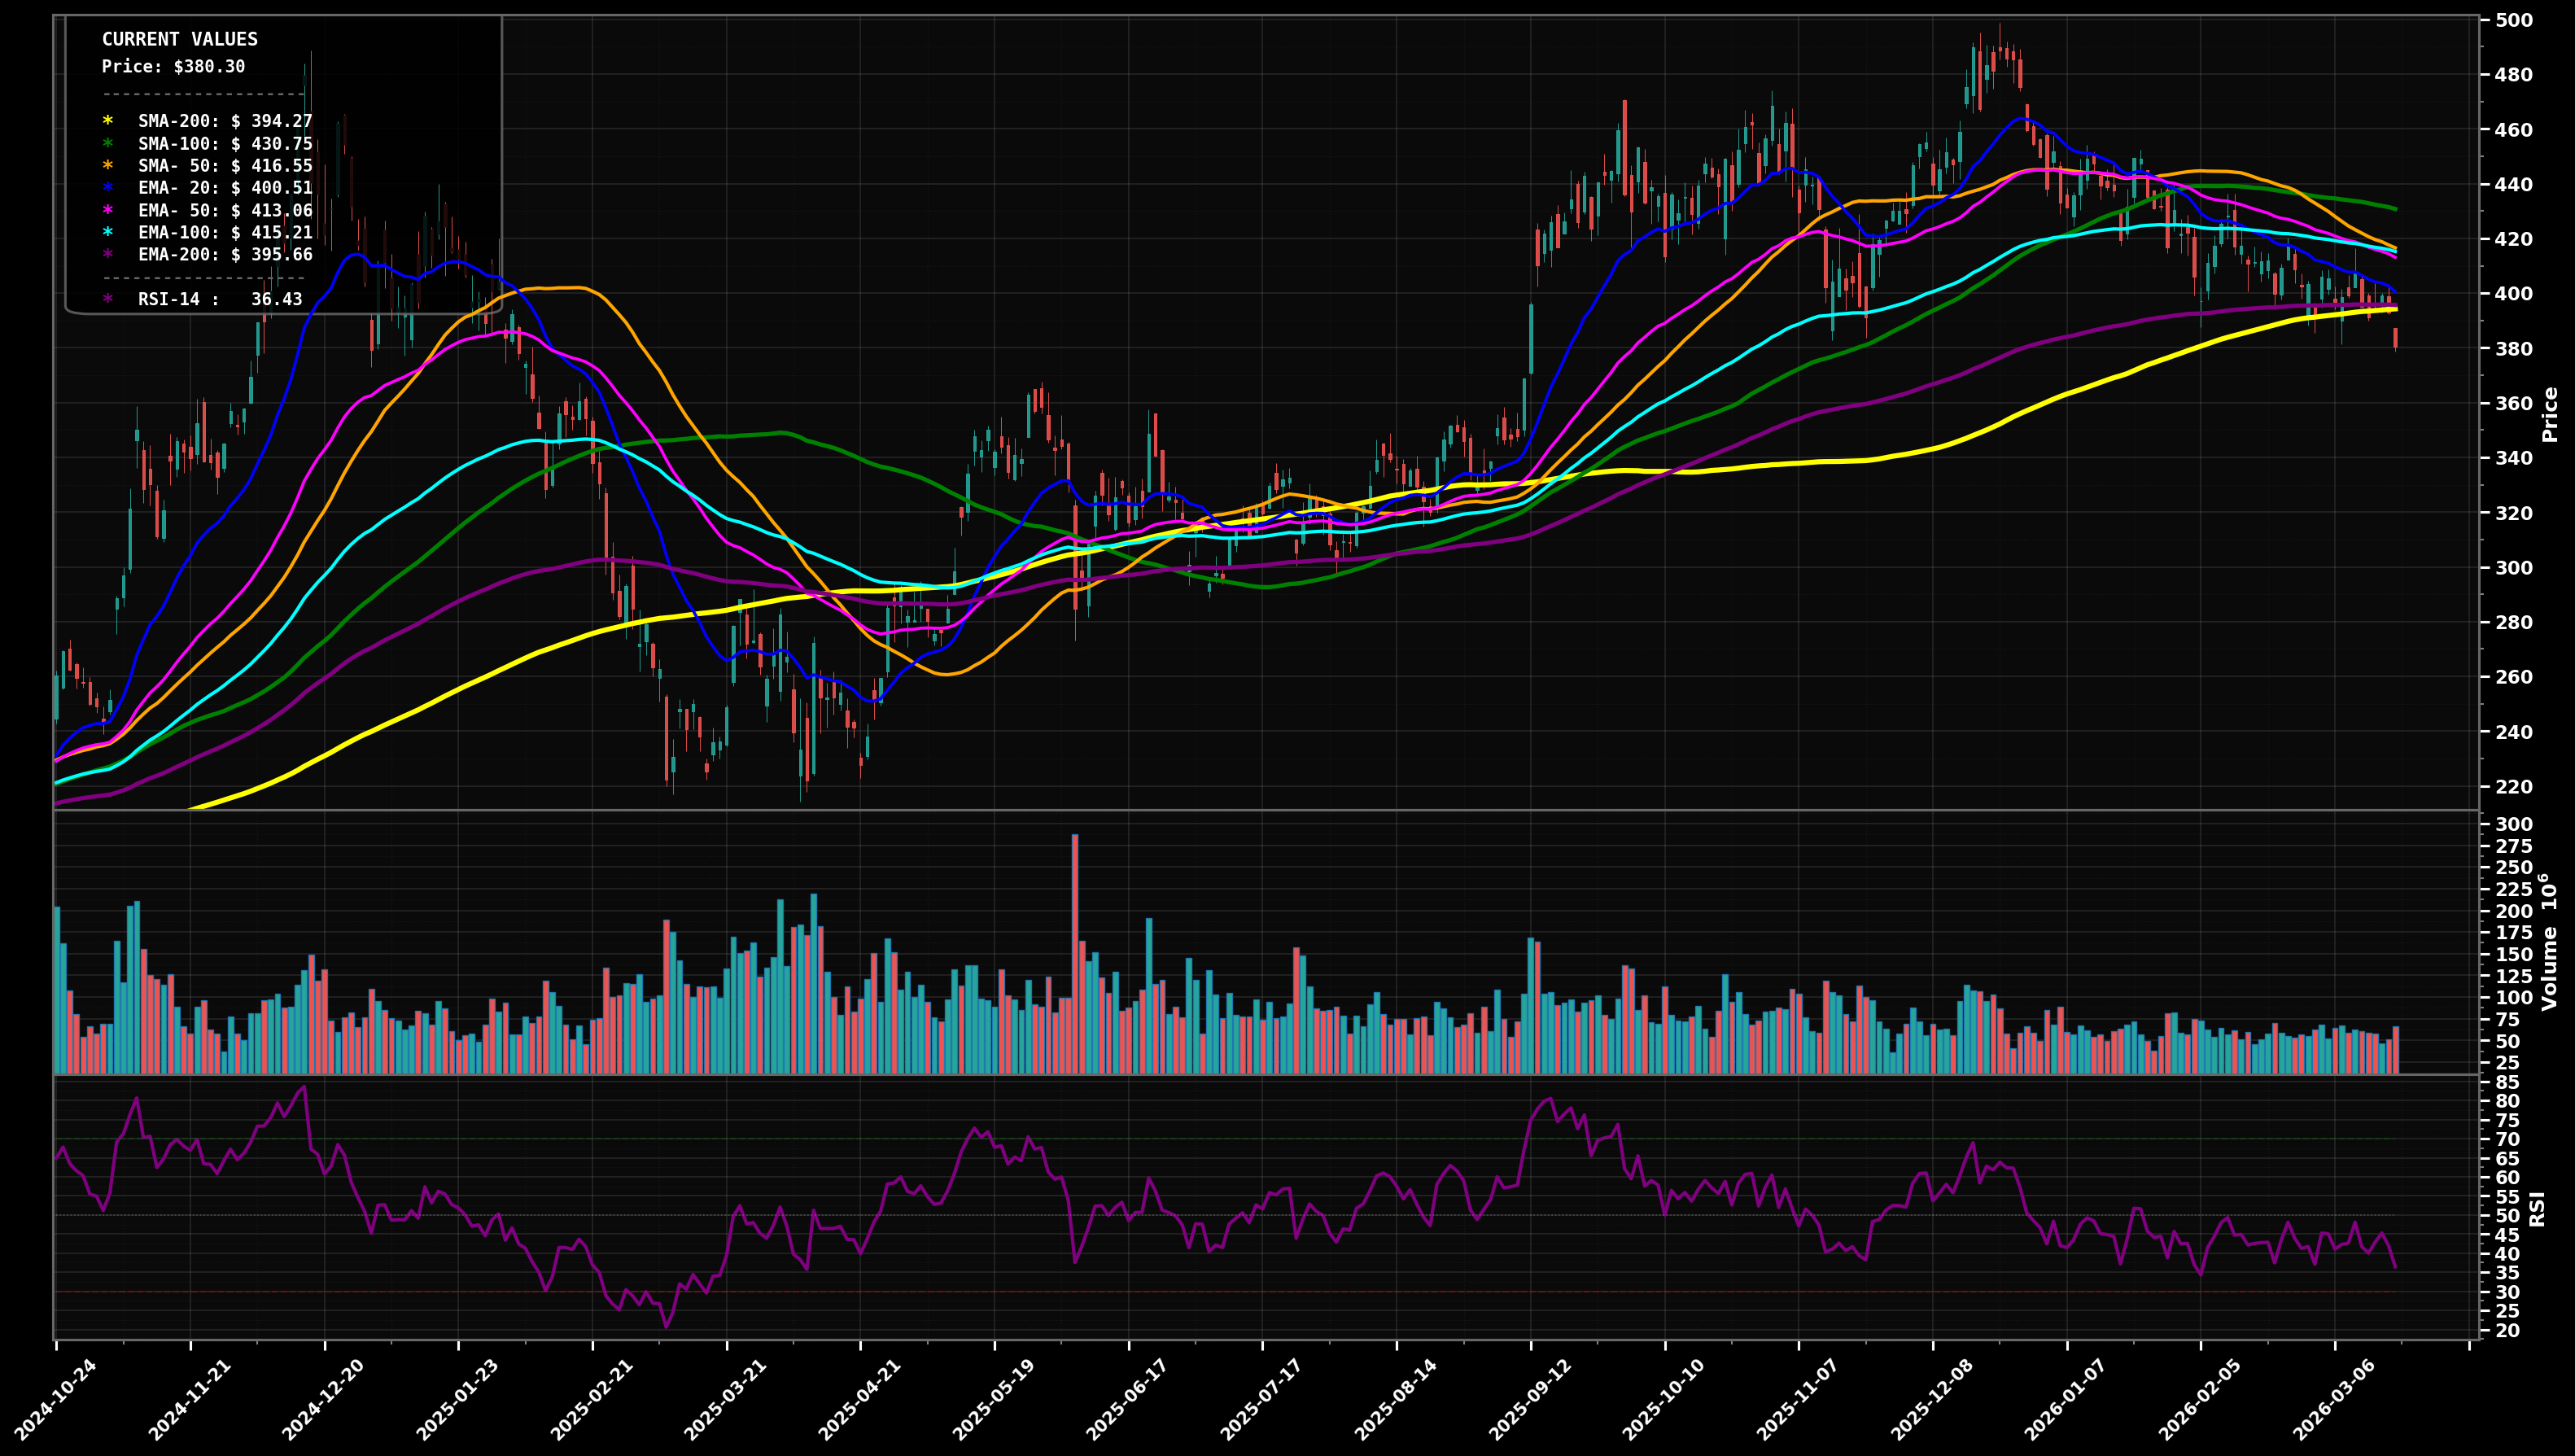
As of May 22, 2026, TSLA (Tesla, Inc.) is in a breakout reversal state on the daily chart, with a confidence level of 63%. Key support is at $410 and key resistance at $450. Price at ~$425.93 is rebounding from the recent ~$380–$390 pullback zone and is now back above the key medium MAs (EMA50/EMA100) with RSI ~58, but is pushing into a dense MA/overhead supply area around $430–$450.
Bullish continuation: price digests near $430–$450 (MA cluster/overhead supply) then breaks higher; Elliott view: this rebound is likely an impulsive leg off the recent low (early Wave 3 or Wave C), with a shallow Wave 2/4-type pullback holding above reclaimed EMAs; Fib-wise, a push through the prior consolidation likely targets the next extension zone.
Bearish rejection: failure at the $440–$450 supply zone leads to a pullback that retests the reclaimed EMA50/100 area; Elliott view: rebound was a corrective Wave B/2 and price rolls into Wave C/3 down; Fib-wise, a retrace toward the prior base/support band becomes likely.
2+ daily closes above $440 while holding above $410
Daily close back below $400
Start near reclaimed EMA50/100 and former pivot area; add on deeper pullback to the MA cluster/base; heavy add near the swing low support band where invalidation risk is clear.
Trim into prior swing-high/extension zones where price would be stretched above rising MAs; scale out more aggressively on further extensions consistent with late-cycle/Wave 5 or large Fib extensions.
As of May 22, 2026, TSLA (Tesla, Inc.) is in a breakout reversal state on the daily chart with 63% confidence. Price at ~$425.93 is rebounding from the recent ~$380–$390 pullback zone and is now back above the key medium MAs (EMA50/EMA100) with RSI ~58, but is pushing into a dense MA/overhead supply area around $430–$450.
On the daily timeframe, TSLA has key support at $410 and key resistance at $450. The most likely scenario (bullish) targets $450 and $485, with a revert level at $415.
TSLA (Tesla, Inc.) is currently classified as breakout reversal on the daily chart, with 63% confidence. Confirmation requires: 2+ daily closes above $440 while holding above $410 This would be invalidated by: Daily close back below $400
The most likely scenario (bullish) targets $450 and $485, with a revert level at $415. The alternative scenario (bearish) targets $400 and $365.
Multi-layer AI agents analyse 200+ stocks across daily, weekly, and monthly timeframes — producing market state classifications, price scenarios with targets, and position entry/exit levels. Daily charts updated every trading day at 6 PM ET. Weekly charts refresh Fridays. Monthly charts refresh on the last trading day of each month. No paywall. No sign-up required.
Built by Foliotrail.
All content on this website — including charts, analysis, price targets, support/resistance levels, and position zones — is generated entirely by AI and provided for educational and informational purposes only.
This is not financial advice. NEXUSNOIR VENTURES SL (the operator of this website) is not a registered investment adviser or broker-dealer. You should not make investment decisions based solely on this information. Always do your own research and consult a qualified financial advisor.
By continuing, you acknowledge that you have read and agree to our full disclaimer & terms of use and privacy policy.