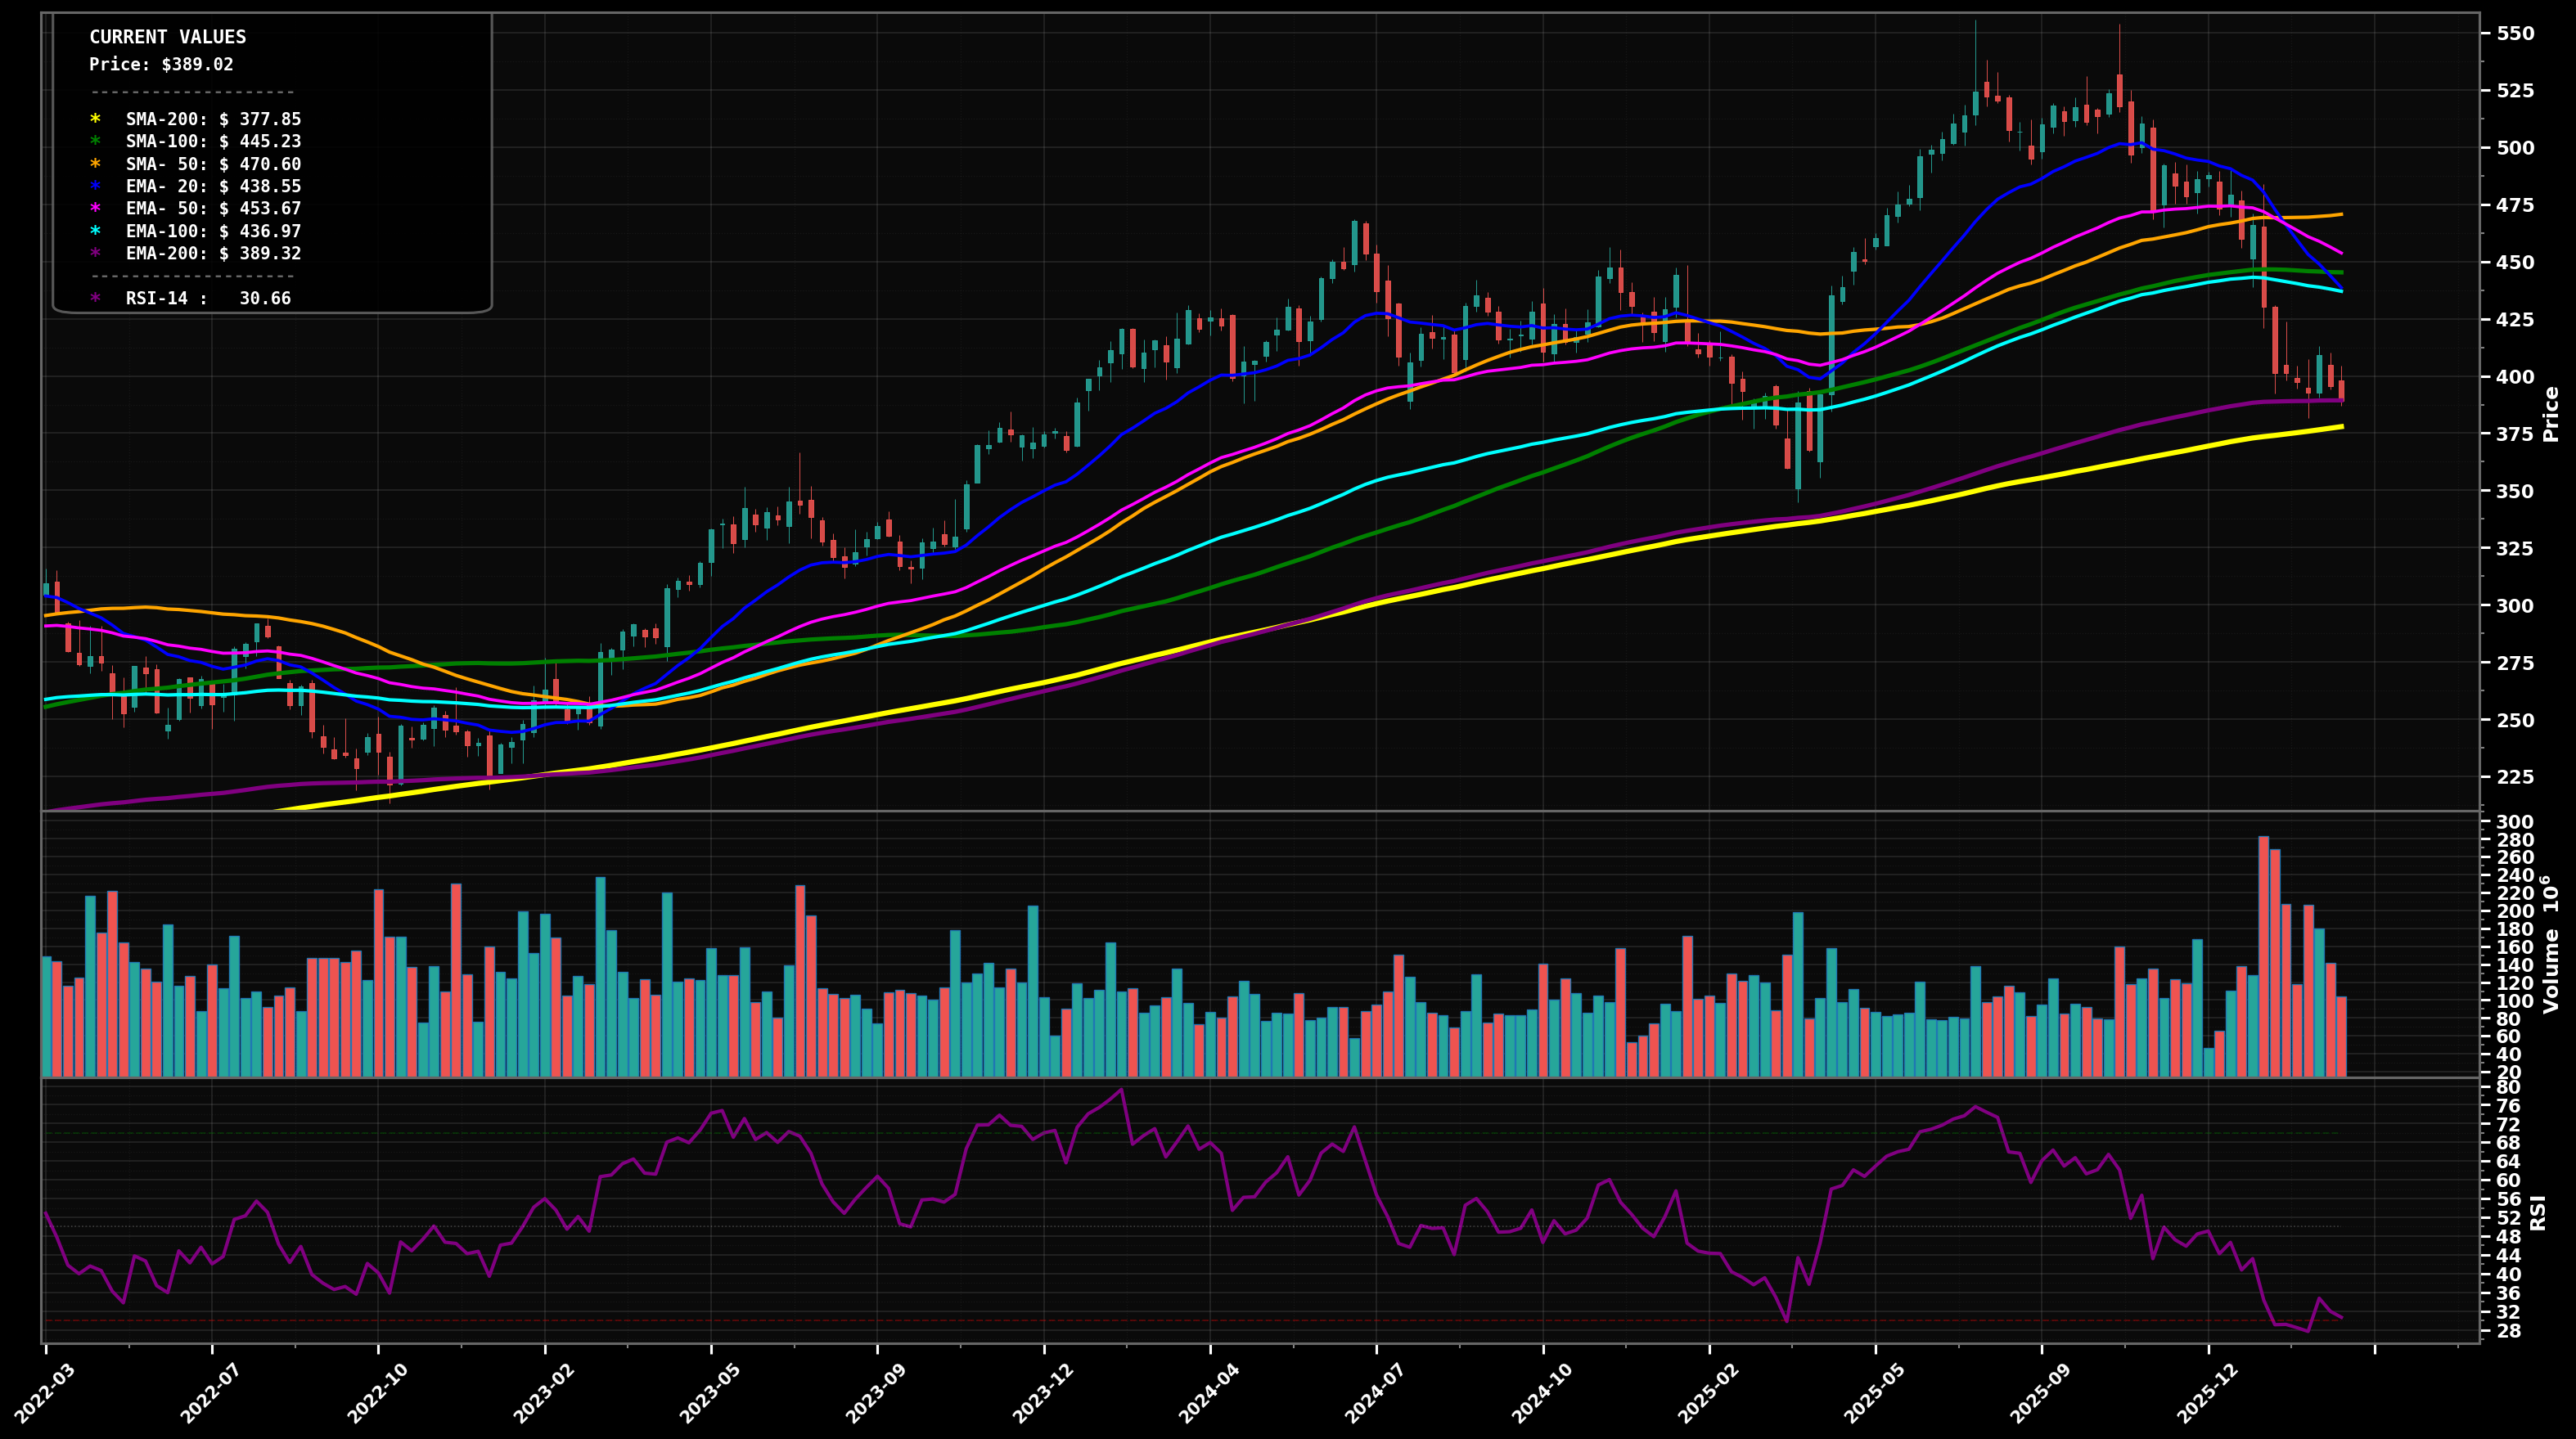
As of May 22, 2026, MSFT (Microsoft Corp.) is in a bottoming attempt state on the weekly chart, with a confidence level of 62%. Key support is at $391 and key resistance at $438. Sharp selloff from ~$525 into ~$360 then rebound; now consolidating around $418 with price still below EMA50 ($438) and EMA100 ($431).
Base-build above EMA200, then grind up to retest EMA50/EMA100 cluster; if reclaimed, rotation toward the broken breakdown area.
Failed bounce: rejection at EMA50/EMA100 leads to another leg down toward EMA200; if that breaks, revisit the prior swing low zone.
Weekly close(s) above $438 (EMA50) for 2+ weeks.
Weekly close below $391 (EMA200) reopens the breakdown risk.
Layer bids around EMA200/support ($391) and the post-selloff range; heavy add only on a retest/undercut of the ~$360 swing-low zone.
Trim into the MA ceiling and prior breakdown supply ($466-$500), more into the prior peak zone ($500-$525), and close on a retest/extension beyond the old highs where upside becomes more stretched.
As of May 22, 2026, MSFT (Microsoft Corp.) is in a bottoming attempt state on the weekly chart with 62% confidence. Sharp selloff from ~$525 into ~$360 then rebound; now consolidating around $418 with price still below EMA50 ($438) and EMA100 ($431).
On the weekly timeframe, MSFT has key support at $391 and key resistance at $438. The most likely scenario (bullish) targets $438 and $466, with a revert level at $410.
MSFT (Microsoft Corp.) is currently classified as bottoming attempt on the weekly chart, with 62% confidence. Confirmation requires: Weekly close(s) above $438 (EMA50) for 2+ weeks. This would be invalidated by: Weekly close below $391 (EMA200) reopens the breakdown risk.
The most likely scenario (bullish) targets $438 and $466, with a revert level at $410. The alternative scenario (bearish) targets $391 and $360.
Multi-layer AI agents analyse 200+ stocks across daily, weekly, and monthly timeframes — producing market state classifications, price scenarios with targets, and position entry/exit levels. Daily charts updated every trading day at 6 PM ET. Weekly charts refresh Fridays. Monthly charts refresh on the last trading day of each month. No paywall. No sign-up required.
Built by Foliotrail.
All content on this website — including charts, analysis, price targets, support/resistance levels, and position zones — is generated entirely by AI and provided for educational and informational purposes only.
This is not financial advice. NEXUSNOIR VENTURES SL (the operator of this website) is not a registered investment adviser or broker-dealer. You should not make investment decisions based solely on this information. Always do your own research and consult a qualified financial advisor.
By continuing, you acknowledge that you have read and agree to our full disclaimer & terms of use and privacy policy.