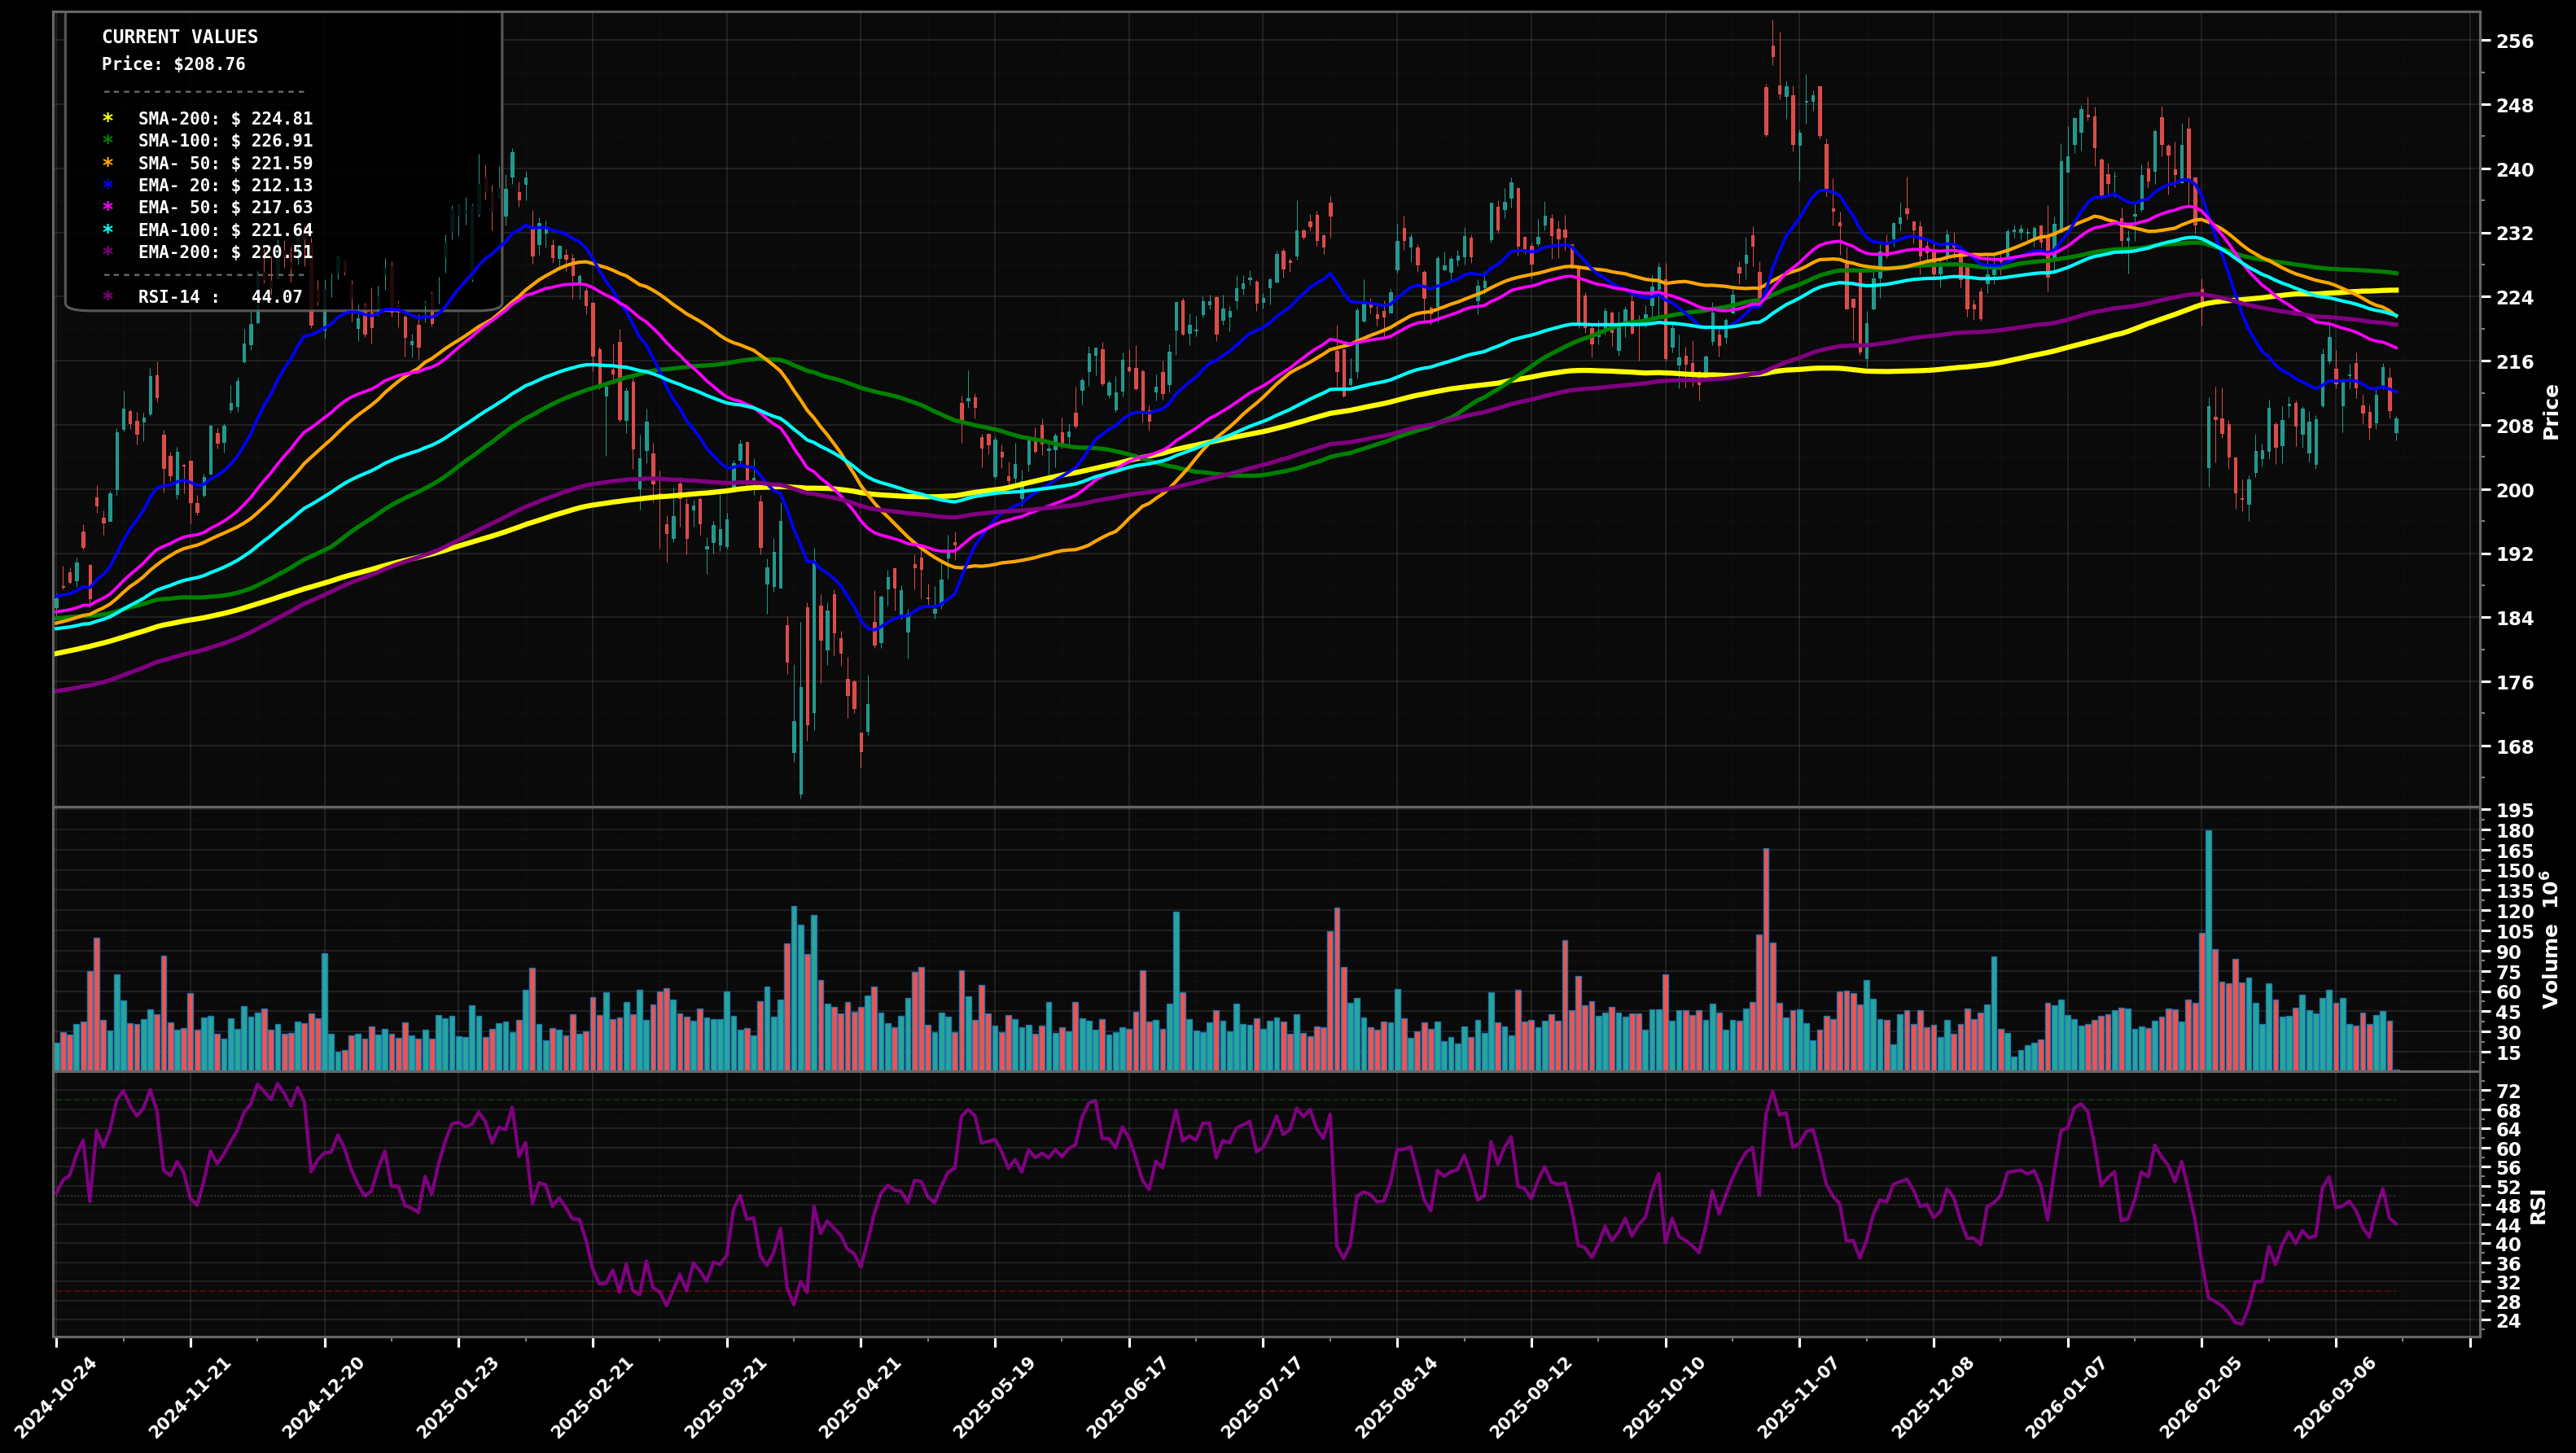
As of May 22, 2026, AMZN (Amazon.com, Inc.) is in a uptrend state on the daily chart, with a confidence level of 67%. Key support is at $249 and key resistance at $275. After a sharp breakout from the $220-$230 base, price pulled back from the ~$275 area and is consolidating above the rising EMA20/EMA50; RSI cooled to ~58.
Bullish continuation: pullback holds above EMA50/SMA50 zone, then pushes back to retest the prior high and attempt a breakout to new highs (Elliott view: wave 4 consolidation followed by wave 5 attempt).
Bearish mean-reversion: failure to reclaim $272-$275 leads to a breakdown below EMA50, rotating to EMA100 and then the major $230-$231 long-term cluster (EMA200/SMA200) (Elliott view: larger degree wave 4 deepening).
Daily close back above $272 with follow-through (2+ closes holding) would confirm trend continuation
Daily close below $249 would weaken the uptrend and raise odds of a deeper mean-reversion toward $239-$231
Start near EMA50/SMA50 support; add at EMA100 confluence; heavy add only at the major EMA200/SMA200 retest where prior breakout base support should matter most.
Trim into likely extension zones above the prior high (possible fib extensions of the breakout leg); increase trimming as price gets farther stretched from the rising long-term MAs and sentiment/RSI typically overheats.
As of May 22, 2026, AMZN (Amazon.com, Inc.) is in a uptrend state on the daily chart with 67% confidence. After a sharp breakout from the $220-$230 base, price pulled back from the ~$275 area and is consolidating above the rising EMA20/EMA50; RSI cooled to ~58.
On the daily timeframe, AMZN has key support at $249 and key resistance at $275. The most likely scenario (bullish) targets $275 and $288, with a revert level at $258.
AMZN (Amazon.com, Inc.) is currently classified as uptrend on the daily chart, with 67% confidence. Confirmation requires: Daily close back above $272 with follow-through (2+ closes holding) would confirm trend continuation This would be invalidated by: Daily close below $249 would weaken the uptrend and raise odds of a deeper mean-reversion toward $239-$231
The most likely scenario (bullish) targets $275 and $288, with a revert level at $258. The alternative scenario (bearish) targets $239 and $231.
Multi-layer AI agents analyse 200+ stocks across daily, weekly, and monthly timeframes — producing market state classifications, price scenarios with targets, and position entry/exit levels. Daily charts updated every trading day at 6 PM ET. Weekly charts refresh Fridays. Monthly charts refresh on the last trading day of each month. No paywall. No sign-up required.
Built by Foliotrail.
All content on this website — including charts, analysis, price targets, support/resistance levels, and position zones — is generated entirely by AI and provided for educational and informational purposes only.
This is not financial advice. NEXUSNOIR VENTURES SL (the operator of this website) is not a registered investment adviser or broker-dealer. You should not make investment decisions based solely on this information. Always do your own research and consult a qualified financial advisor.
By continuing, you acknowledge that you have read and agree to our full disclaimer & terms of use and privacy policy.