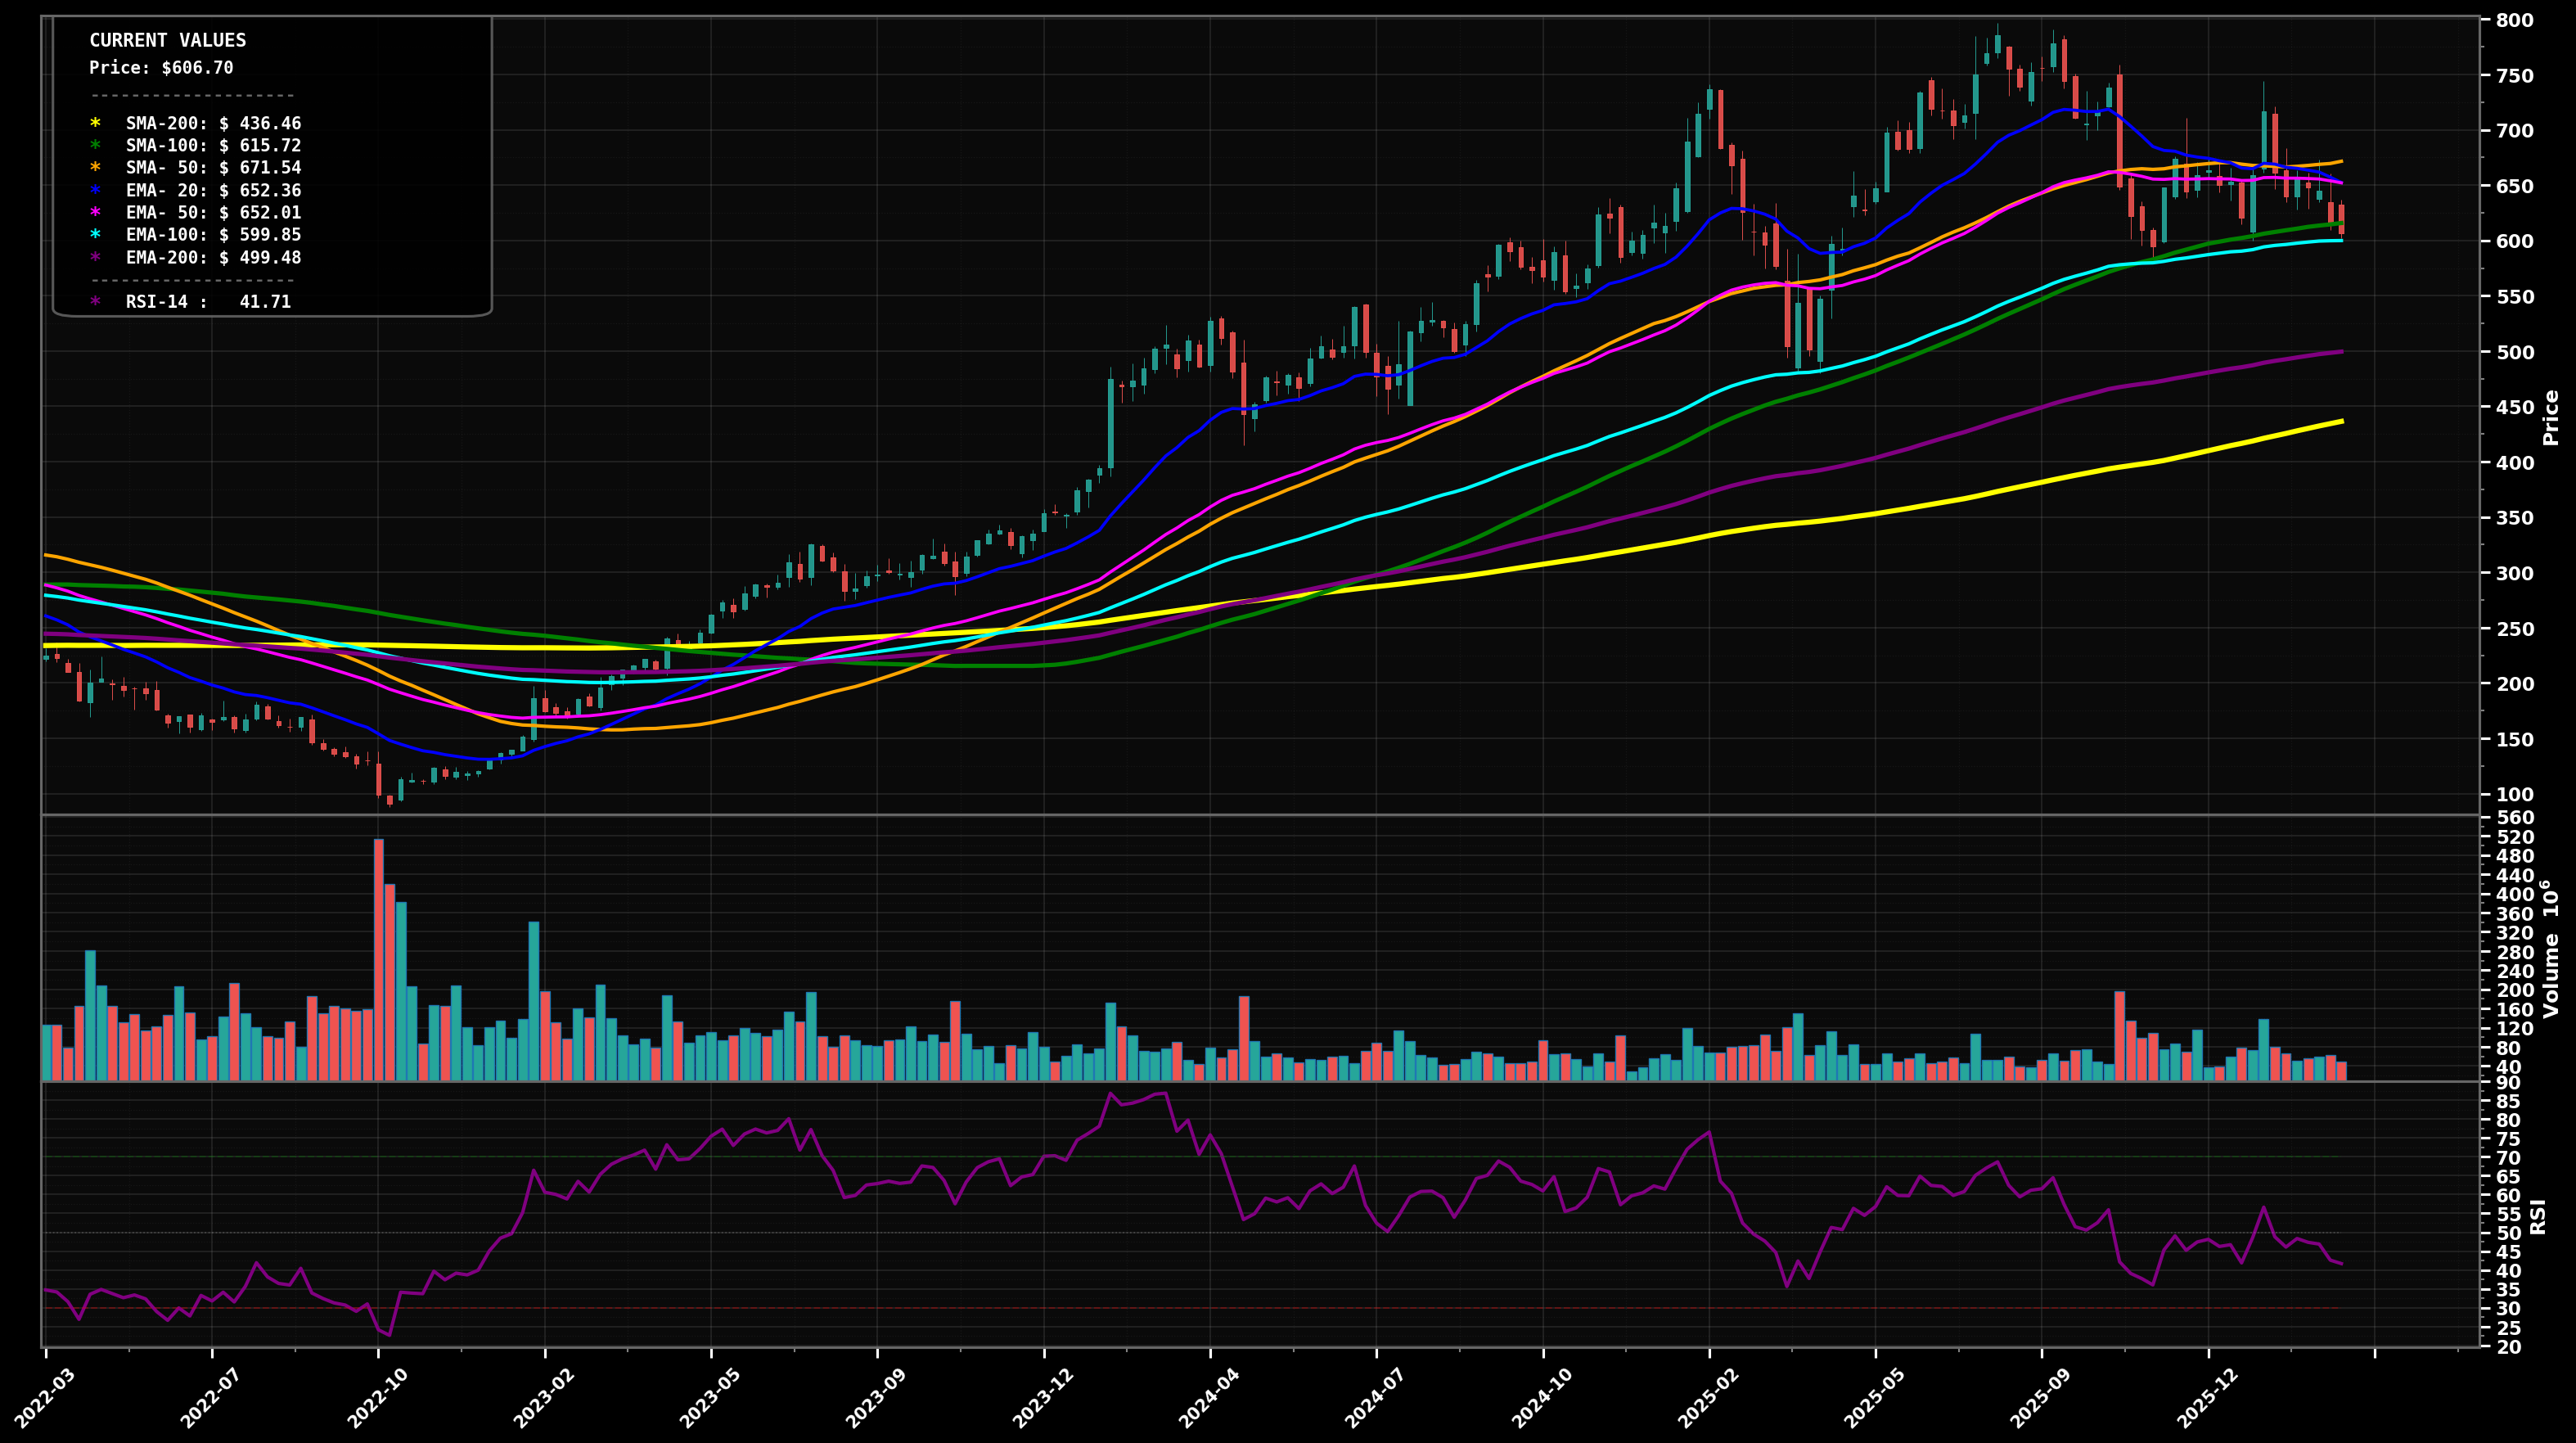
As of May 22, 2026, META (Meta Platforms Inc Class A) is in a choppy range state on the weekly chart, with a confidence level of 62%. Key support is at $600 and key resistance at $630. Weekly price around $610.42 is consolidating below the falling SMA50/SMA100 cluster ($674/$628) while holding above EMA100 (~$602) after a sharp drop-and-rebound; RSI14 ~46 suggests neutral-to-weak momentum.
Base-building above the $600 swing-area/EMA100, then a push to reclaim the $628-$675 moving-average ceiling; if reclaimed, continuation toward prior supply near the $700s is plausible (Elliott: corrective consolidation likely as wave (4) before a final push).
Failure at the $628-$640 band (EMA50/SMA100 zone) leads to a breakdown under EMA100 and a retest of the prior reaction low area; if that gives way, mean-reversion toward the EMA200 (~$510) becomes the magnet (Fib idea: pullback toward ~50–61.8% of the latest upswing).
CHOPPY_RANGE confirmed if price keeps closing between $585 and $675 for 3+ weeks (no breakout hold).
State invalidated on 2 consecutive weekly closes above $675 (bull break) or below $585 (bear break).
Starter near EMA100/$600 support; add on range breakdown to next demand; heavy add near EMA200/major mean-reversion zone if reached.
Trim into prior supply/extension zones; heavier trimming into potential new ATH/upper-channel extension where upside becomes increasingly asymmetric vs mean reversion.
As of May 22, 2026, META (Meta Platforms Inc Class A) is in a choppy range state on the weekly chart with 62% confidence. Weekly price around $610.42 is consolidating below the falling SMA50/SMA100 cluster ($674/$628) while holding above EMA100 (~$602) after a sharp drop-and-rebound; RSI14 ~46 suggests neutral-to-weak momentum.
On the weekly timeframe, META has key support at $600 and key resistance at $630. The most likely scenario (bullish) targets $630 and $675, with a revert level at $605.
META (Meta Platforms Inc Class A) is currently classified as choppy range on the weekly chart, with 62% confidence. Confirmation requires: CHOPPY_RANGE confirmed if price keeps closing between $585 and $675 for 3+ weeks (no breakout hold). This would be invalidated by: State invalidated on 2 consecutive weekly closes above $675 (bull break) or below $585 (bear break).
The most likely scenario (bullish) targets $630 and $675, with a revert level at $605. The alternative scenario (bearish) targets $585 and $510.
Multi-layer AI agents analyse 200+ stocks across daily, weekly, and monthly timeframes — producing market state classifications, price scenarios with targets, and position entry/exit levels. Daily charts updated every trading day at 6 PM ET. Weekly charts refresh Fridays. Monthly charts refresh on the last trading day of each month. No paywall. No sign-up required.
Built by Foliotrail.
All content on this website — including charts, analysis, price targets, support/resistance levels, and position zones — is generated entirely by AI and provided for educational and informational purposes only.
This is not financial advice. NEXUSNOIR VENTURES SL (the operator of this website) is not a registered investment adviser or broker-dealer. You should not make investment decisions based solely on this information. Always do your own research and consult a qualified financial advisor.
By continuing, you acknowledge that you have read and agree to our full disclaimer & terms of use and privacy policy.