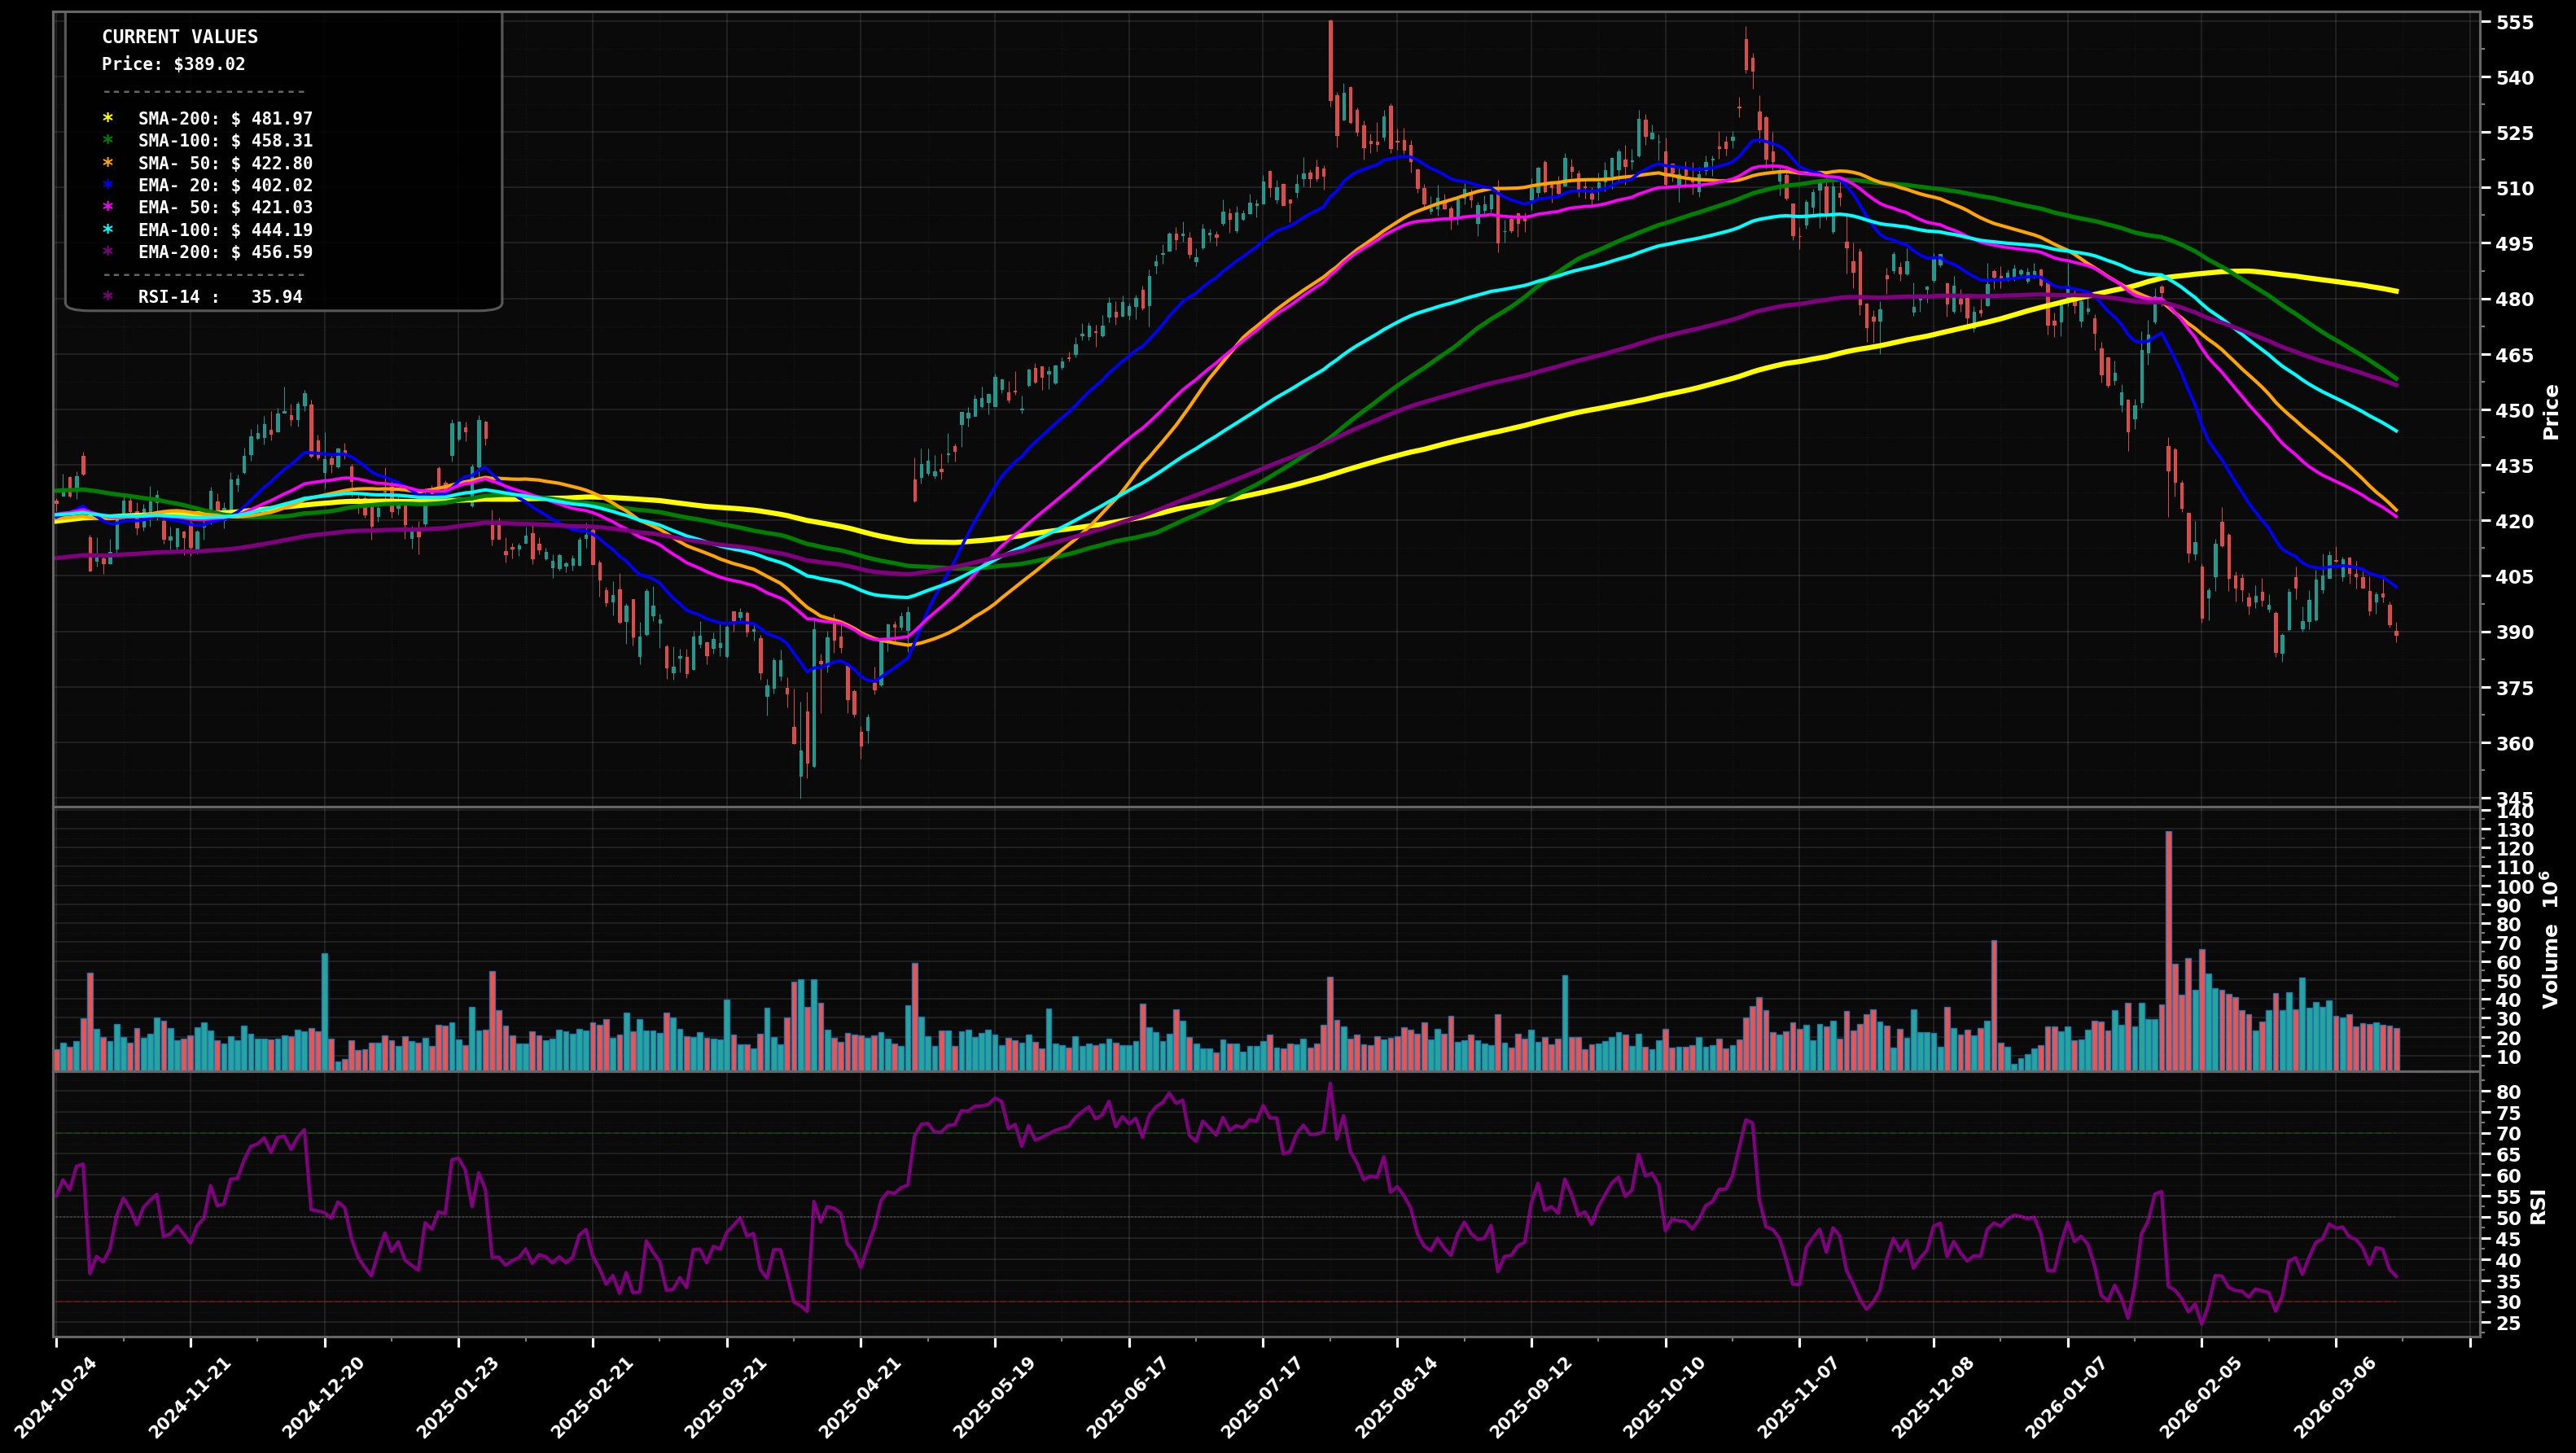
As of May 22, 2026, MSFT (Microsoft Corp.) is in a choppy range state on the daily chart, with a confidence level of 62%. Key support is at $405 and key resistance at $421. Price at $418.50 is chopping just below the $421 EMA100 (cyan) after a rebound from the ~$365 swing low; EMA50 (pink) ~$411 is rising while longer MAs (EMA200 purple ~$437, SMA200 yellow ~$460) overhead cap the move; RSI ~54.
Range resolves upward: hold above EMA50 and push through EMA100; then a grind toward the larger MA cluster with first real test at the prior breakdown zone.
Failure at EMA100/nearby supply leads to a pullback back into the base; if $405 breaks, sellers likely press toward the prior swing-area support.
2+ daily closes above $421 (EMA100) followed by a higher low holding above $411 (EMA50).
Daily close below $400 (loss of reclaimed short-term base/MA support) re-opens the downtrend leg.
Start near EMA50/nearby base support, add on a deeper pullback to round-number support, heavy add only near the prior capitulation/swing-low zone to improve RR if breakdown occurs.
Trim into the EMA200/SMA200 overhead supply first, trim more if price reclaims prior distribution highs, and fully exit into potential late-cycle/extended wave-5 style stretch near prior peak zone.
As of May 22, 2026, MSFT (Microsoft Corp.) is in a choppy range state on the daily chart with 62% confidence. Price at $418.50 is chopping just below the $421 EMA100 (cyan) after a rebound from the ~$365 swing low; EMA50 (pink) ~$411 is rising while longer MAs (EMA200 purple ~$437, SMA200 yellow ~$460) overhead cap the move; RSI ~54.
On the daily timeframe, MSFT has key support at $405 and key resistance at $421. The most likely scenario (bullish) targets $430 and $438, with a revert level at $414.
MSFT (Microsoft Corp.) is currently classified as choppy range on the daily chart, with 62% confidence. Confirmation requires: 2+ daily closes above $421 (EMA100) followed by a higher low holding above $411 (EMA50). This would be invalidated by: Daily close below $400 (loss of reclaimed short-term base/MA support) re-opens the downtrend leg.
The most likely scenario (bullish) targets $430 and $438, with a revert level at $414. The alternative scenario (bearish) targets $405 and $390.
Multi-layer AI agents analyse 200+ stocks across daily, weekly, and monthly timeframes — producing market state classifications, price scenarios with targets, and position entry/exit levels. Daily charts updated every trading day at 6 PM ET. Weekly charts refresh Fridays. Monthly charts refresh on the last trading day of each month. No paywall. No sign-up required.
Built by Foliotrail.
All content on this website — including charts, analysis, price targets, support/resistance levels, and position zones — is generated entirely by AI and provided for educational and informational purposes only.
This is not financial advice. NEXUSNOIR VENTURES SL (the operator of this website) is not a registered investment adviser or broker-dealer. You should not make investment decisions based solely on this information. Always do your own research and consult a qualified financial advisor.
By continuing, you acknowledge that you have read and agree to our full disclaimer & terms of use and privacy policy.