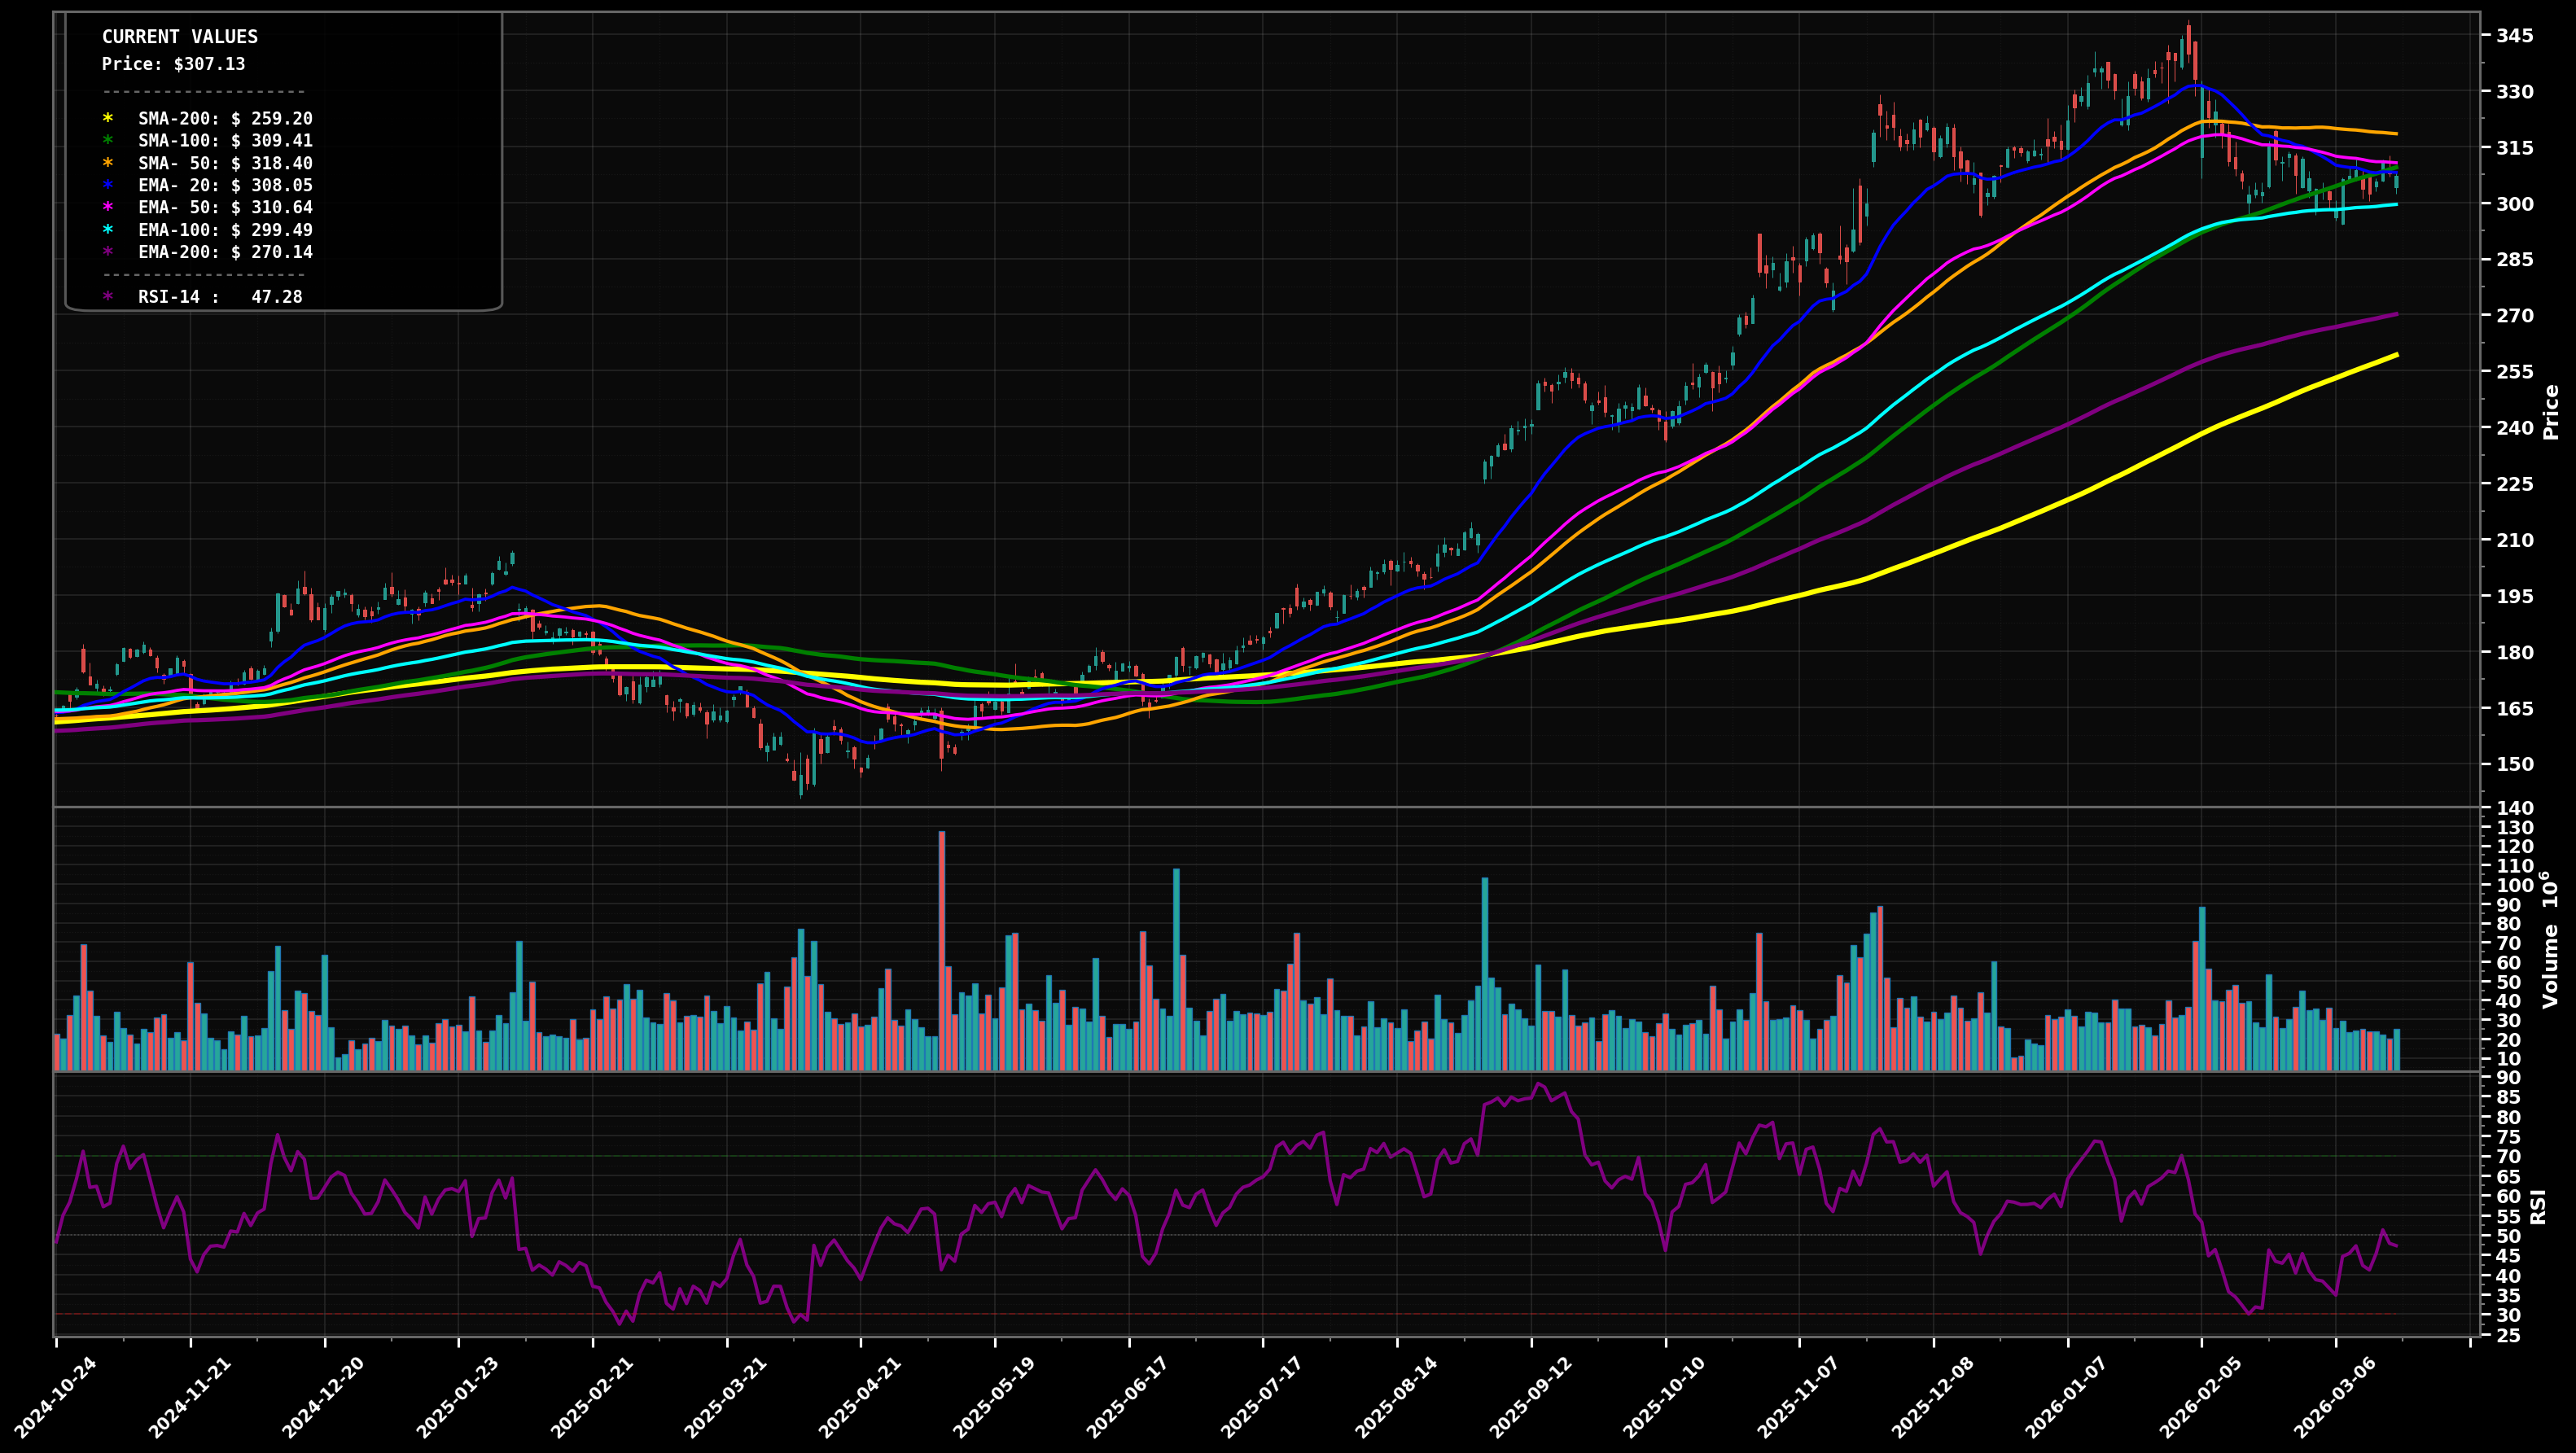
As of May 22, 2026, GOOGL (Alphabet Inc.) is in a uptrend state on the daily chart, with a confidence level of 74%. Key support is at $355 and key resistance at $400. Strong run to a new high near $400 followed by a pullback/consolidation; price is still above EMA50/EMA100 with RSI ~57.
Bullish continuation: pullback finds support around EMA50, then price re-tests the prior high and attempts breakout; Elliott view: likely a Wave 4 pullback after an extended Wave 3 advance, setting up a Wave 5 push.
Deeper correction: price loses EMA50 and mean-reverts toward EMA100/SMA100 cluster; Elliott view: Wave 4 turns into a sharper ABC, with Fib-style retrace toward the 38.2%–50% area of the last impulse.
Daily close back above $400 with follow-through (2+ closes holding).
Daily close below $355 (EMA50) followed by a breakdown below $332 (EMA100).
Layer entries at rising trend support/EMA50 first, then EMA100/SMA100 confluence, then EMA200/SMA200 area as last-resort structural support if a deeper Wave-4/ABC plays out.
Trim into upside extensions above the prior ATH area (likely Wave-5/Fib extensions), increase trimming as price gets more stretched vs EMA50/EMA100, and fully exit into extreme multi-year extension risk.
As of May 22, 2026, GOOGL (Alphabet Inc.) is in a uptrend state on the daily chart with 74% confidence. Strong run to a new high near $400 followed by a pullback/consolidation; price is still above EMA50/EMA100 with RSI ~57.
On the daily timeframe, GOOGL has key support at $355 and key resistance at $400. The most likely scenario (bullish) targets $400 and $420, with a revert level at $372.
GOOGL (Alphabet Inc.) is currently classified as uptrend on the daily chart, with 74% confidence. Confirmation requires: Daily close back above $400 with follow-through (2+ closes holding). This would be invalidated by: Daily close below $355 (EMA50) followed by a breakdown below $332 (EMA100).
The most likely scenario (bullish) targets $400 and $420, with a revert level at $372. The alternative scenario (bearish) targets $332 and $300.
Multi-layer AI agents analyse 200+ stocks across daily, weekly, and monthly timeframes — producing market state classifications, price scenarios with targets, and position entry/exit levels. Daily charts updated every trading day at 6 PM ET. Weekly charts refresh Fridays. Monthly charts refresh on the last trading day of each month. No paywall. No sign-up required.
Built by Foliotrail.
All content on this website — including charts, analysis, price targets, support/resistance levels, and position zones — is generated entirely by AI and provided for educational and informational purposes only.
This is not financial advice. NEXUSNOIR VENTURES SL (the operator of this website) is not a registered investment adviser or broker-dealer. You should not make investment decisions based solely on this information. Always do your own research and consult a qualified financial advisor.
By continuing, you acknowledge that you have read and agree to our full disclaimer & terms of use and privacy policy.