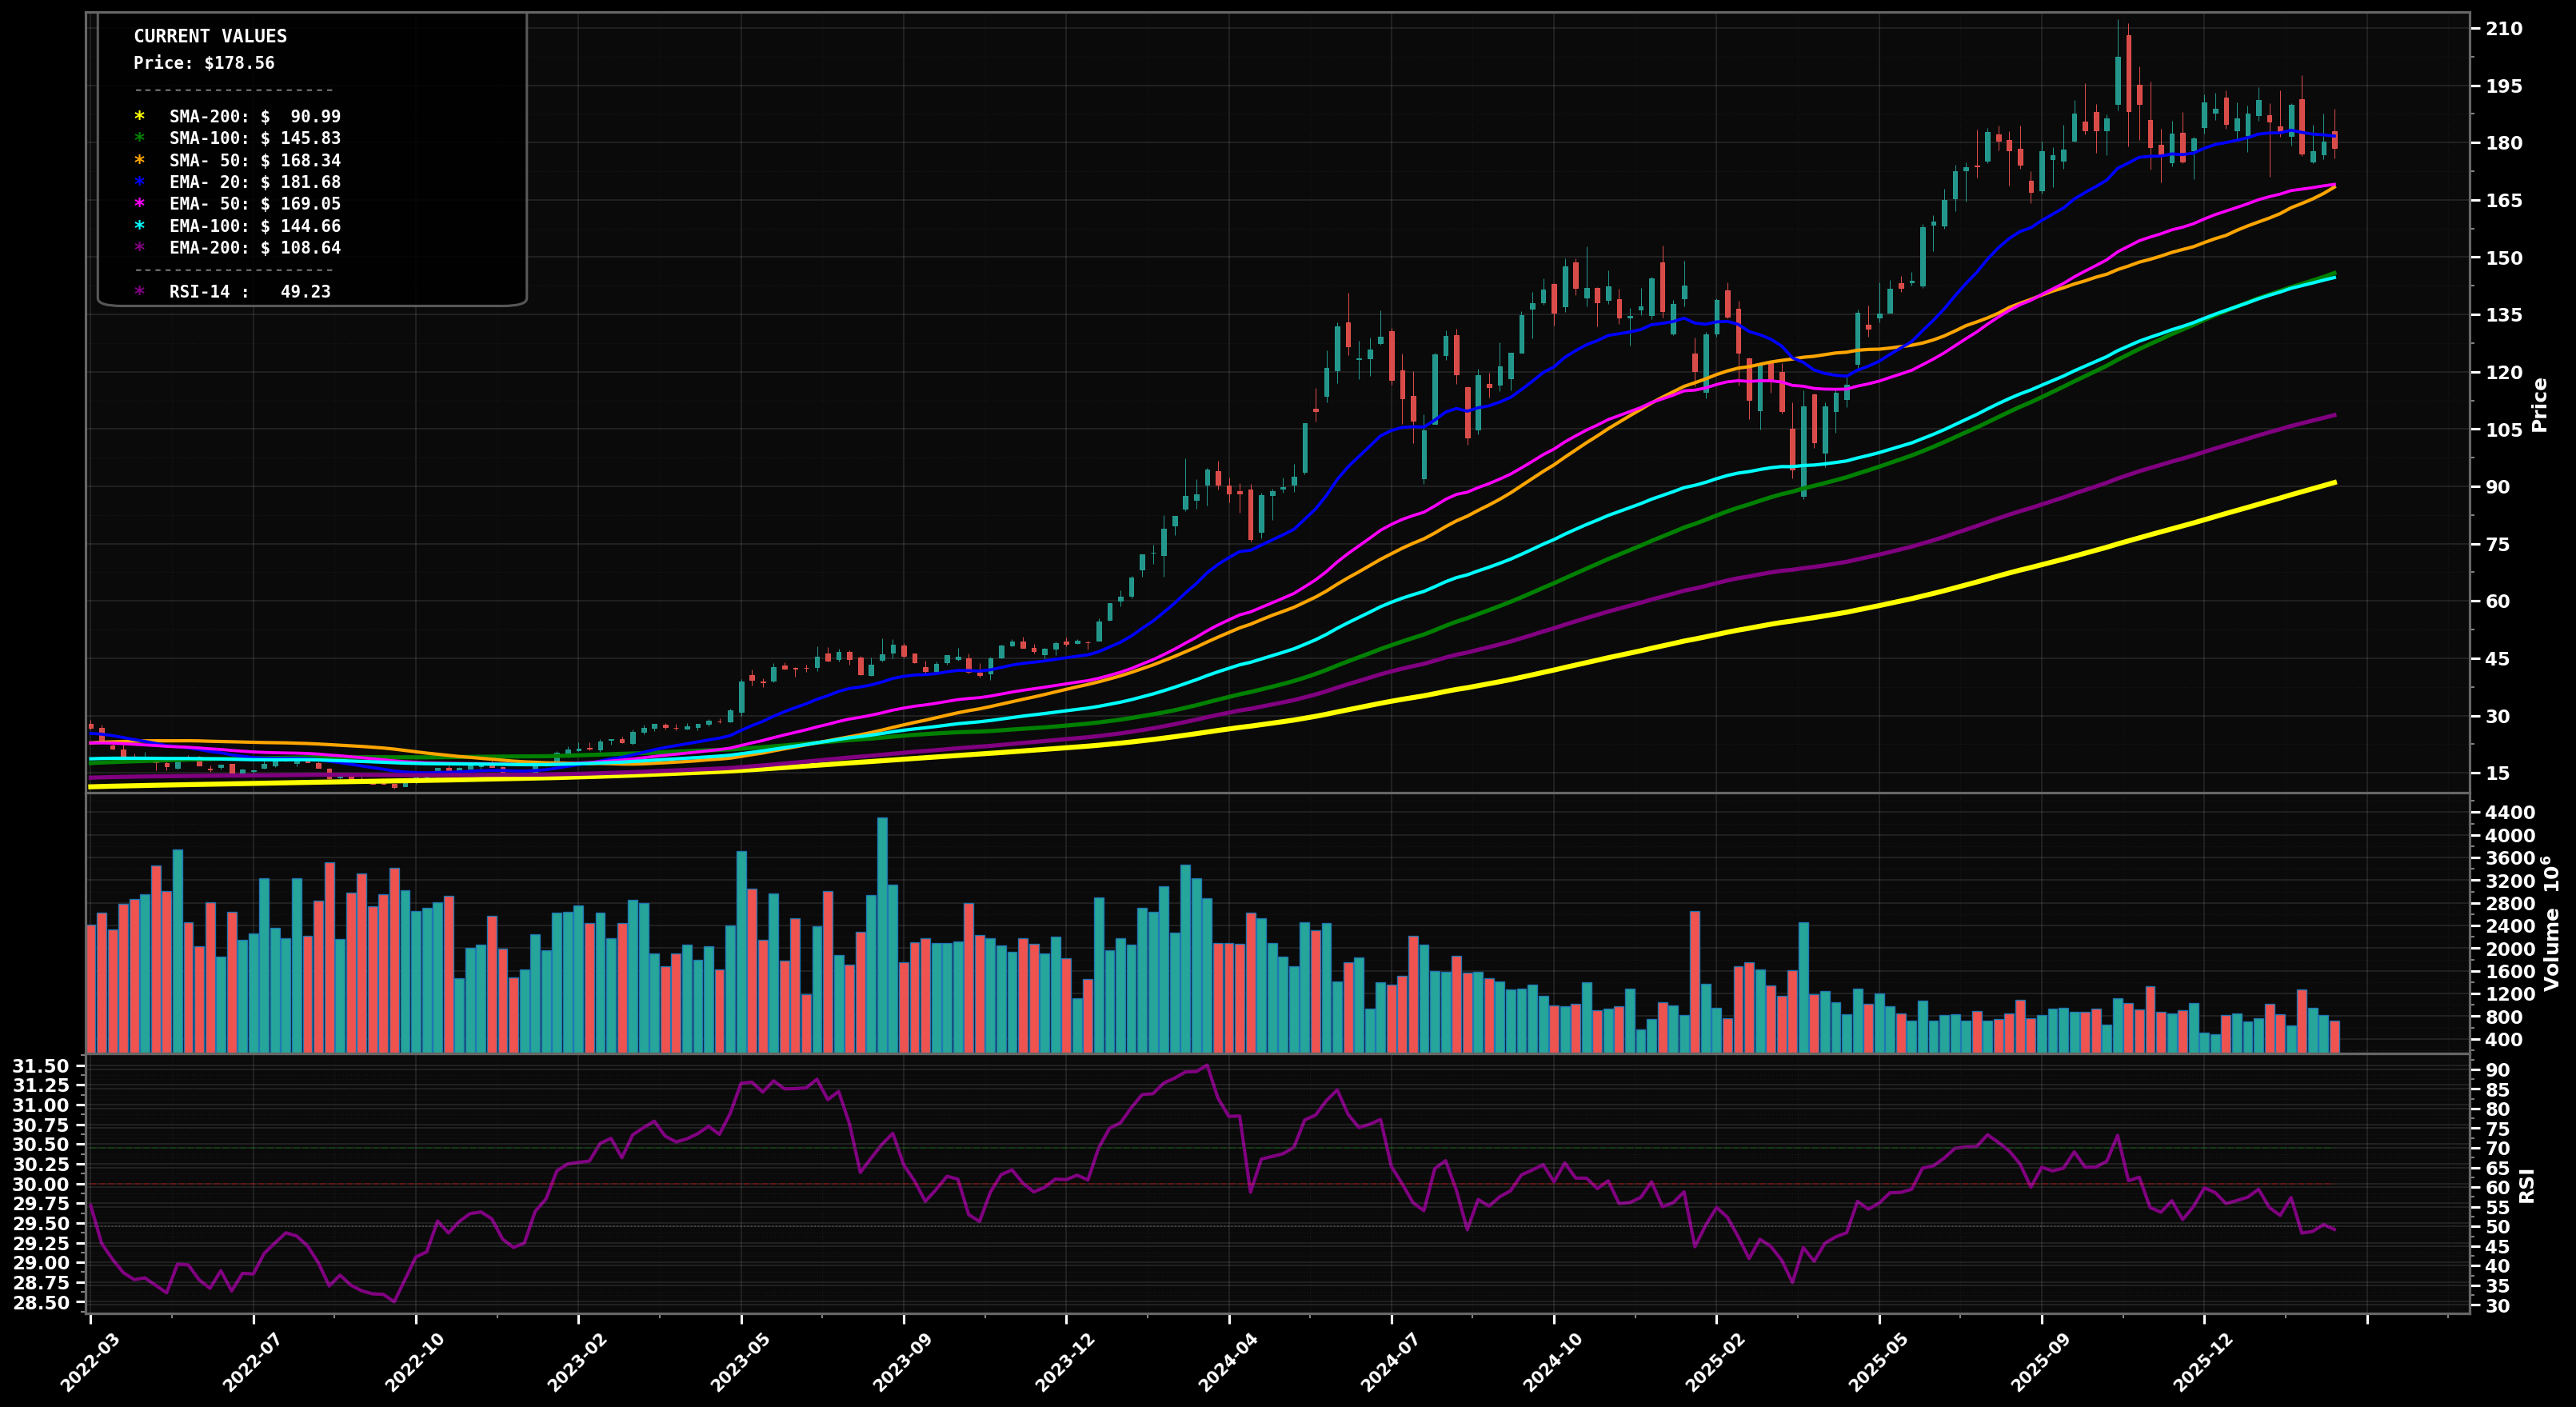
As of May 22, 2026, NVDA (NVIDIA Corporation) is in a uptrend state on the weekly chart, with a confidence level of 78%. Key support is at $200 and key resistance at $230. Weekly breakout to new highs above prior ~$200 area; price ~$215.26 holding well above rising EMA50/EMA100 with RSI14 ~62 (not extreme).
Bullish continuation: breakout holds above $200, then a push toward the next psychological/extension zone; brief consolidation possible but buyers defend rising EMA20/EMA50.
Bearish pullback within uptrend: a mean-reversion dip after the sharp weekly run, retesting the breakout area and/or EMA50; then decide if trend resumes or turns into a wider range.
2+ weekly closes holding above $200
Weekly close below $178
Start near breakout retest ($200) if it holds; add on EMA50 (pink) pullback; heavy add near EMA100/SMA100 confluence (~$154) where trend support is strongest.
Trim into upside extensions/psychological levels after strong impulsive legs (likely Elliott wave 3/5 behavior); heavier trims if price becomes far stretched above EMA50/100 versus historical mean-reversion risk.
As of May 22, 2026, NVDA (NVIDIA Corporation) is in a uptrend state on the weekly chart with 78% confidence. Weekly breakout to new highs above prior ~$200 area; price ~$215.26 holding well above rising EMA50/EMA100 with RSI14 ~62 (not extreme).
On the weekly timeframe, NVDA has key support at $200 and key resistance at $230. The most likely scenario (bullish) targets $230 and $250, with a revert level at $205.
NVDA (NVIDIA Corporation) is currently classified as uptrend on the weekly chart, with 78% confidence. Confirmation requires: 2+ weekly closes holding above $200 This would be invalidated by: Weekly close below $178
The most likely scenario (bullish) targets $230 and $250, with a revert level at $205. The alternative scenario (bearish) targets $200 and $180.
Multi-layer AI agents analyse 200+ stocks across daily, weekly, and monthly timeframes — producing market state classifications, price scenarios with targets, and position entry/exit levels. Daily charts updated every trading day at 6 PM ET. Weekly charts refresh Fridays. Monthly charts refresh on the last trading day of each month. No paywall. No sign-up required.
Built by Foliotrail.
All content on this website — including charts, analysis, price targets, support/resistance levels, and position zones — is generated entirely by AI and provided for educational and informational purposes only.
This is not financial advice. NEXUSNOIR VENTURES SL (the operator of this website) is not a registered investment adviser or broker-dealer. You should not make investment decisions based solely on this information. Always do your own research and consult a qualified financial advisor.
By continuing, you acknowledge that you have read and agree to our full disclaimer & terms of use and privacy policy.