As of May 22, 2026, GOOGL (Alphabet Inc.) is in a uptrend state on the weekly chart, with a confidence level of 78%. Key support is at $335 and key resistance at $400. Weekly uptrend intact; sharp impulse pushed to new highs near $400, followed by a small pullback/inside consolidation while still well above rising EMA50/EMA100.
Bullish continuation: consolidation holds above the $360-$335 support band (prior breakout + EMA20/near-term trend), then a retest/break of $400 and extension higher (Elliott: late Wave 3 or Wave 5 continuation).
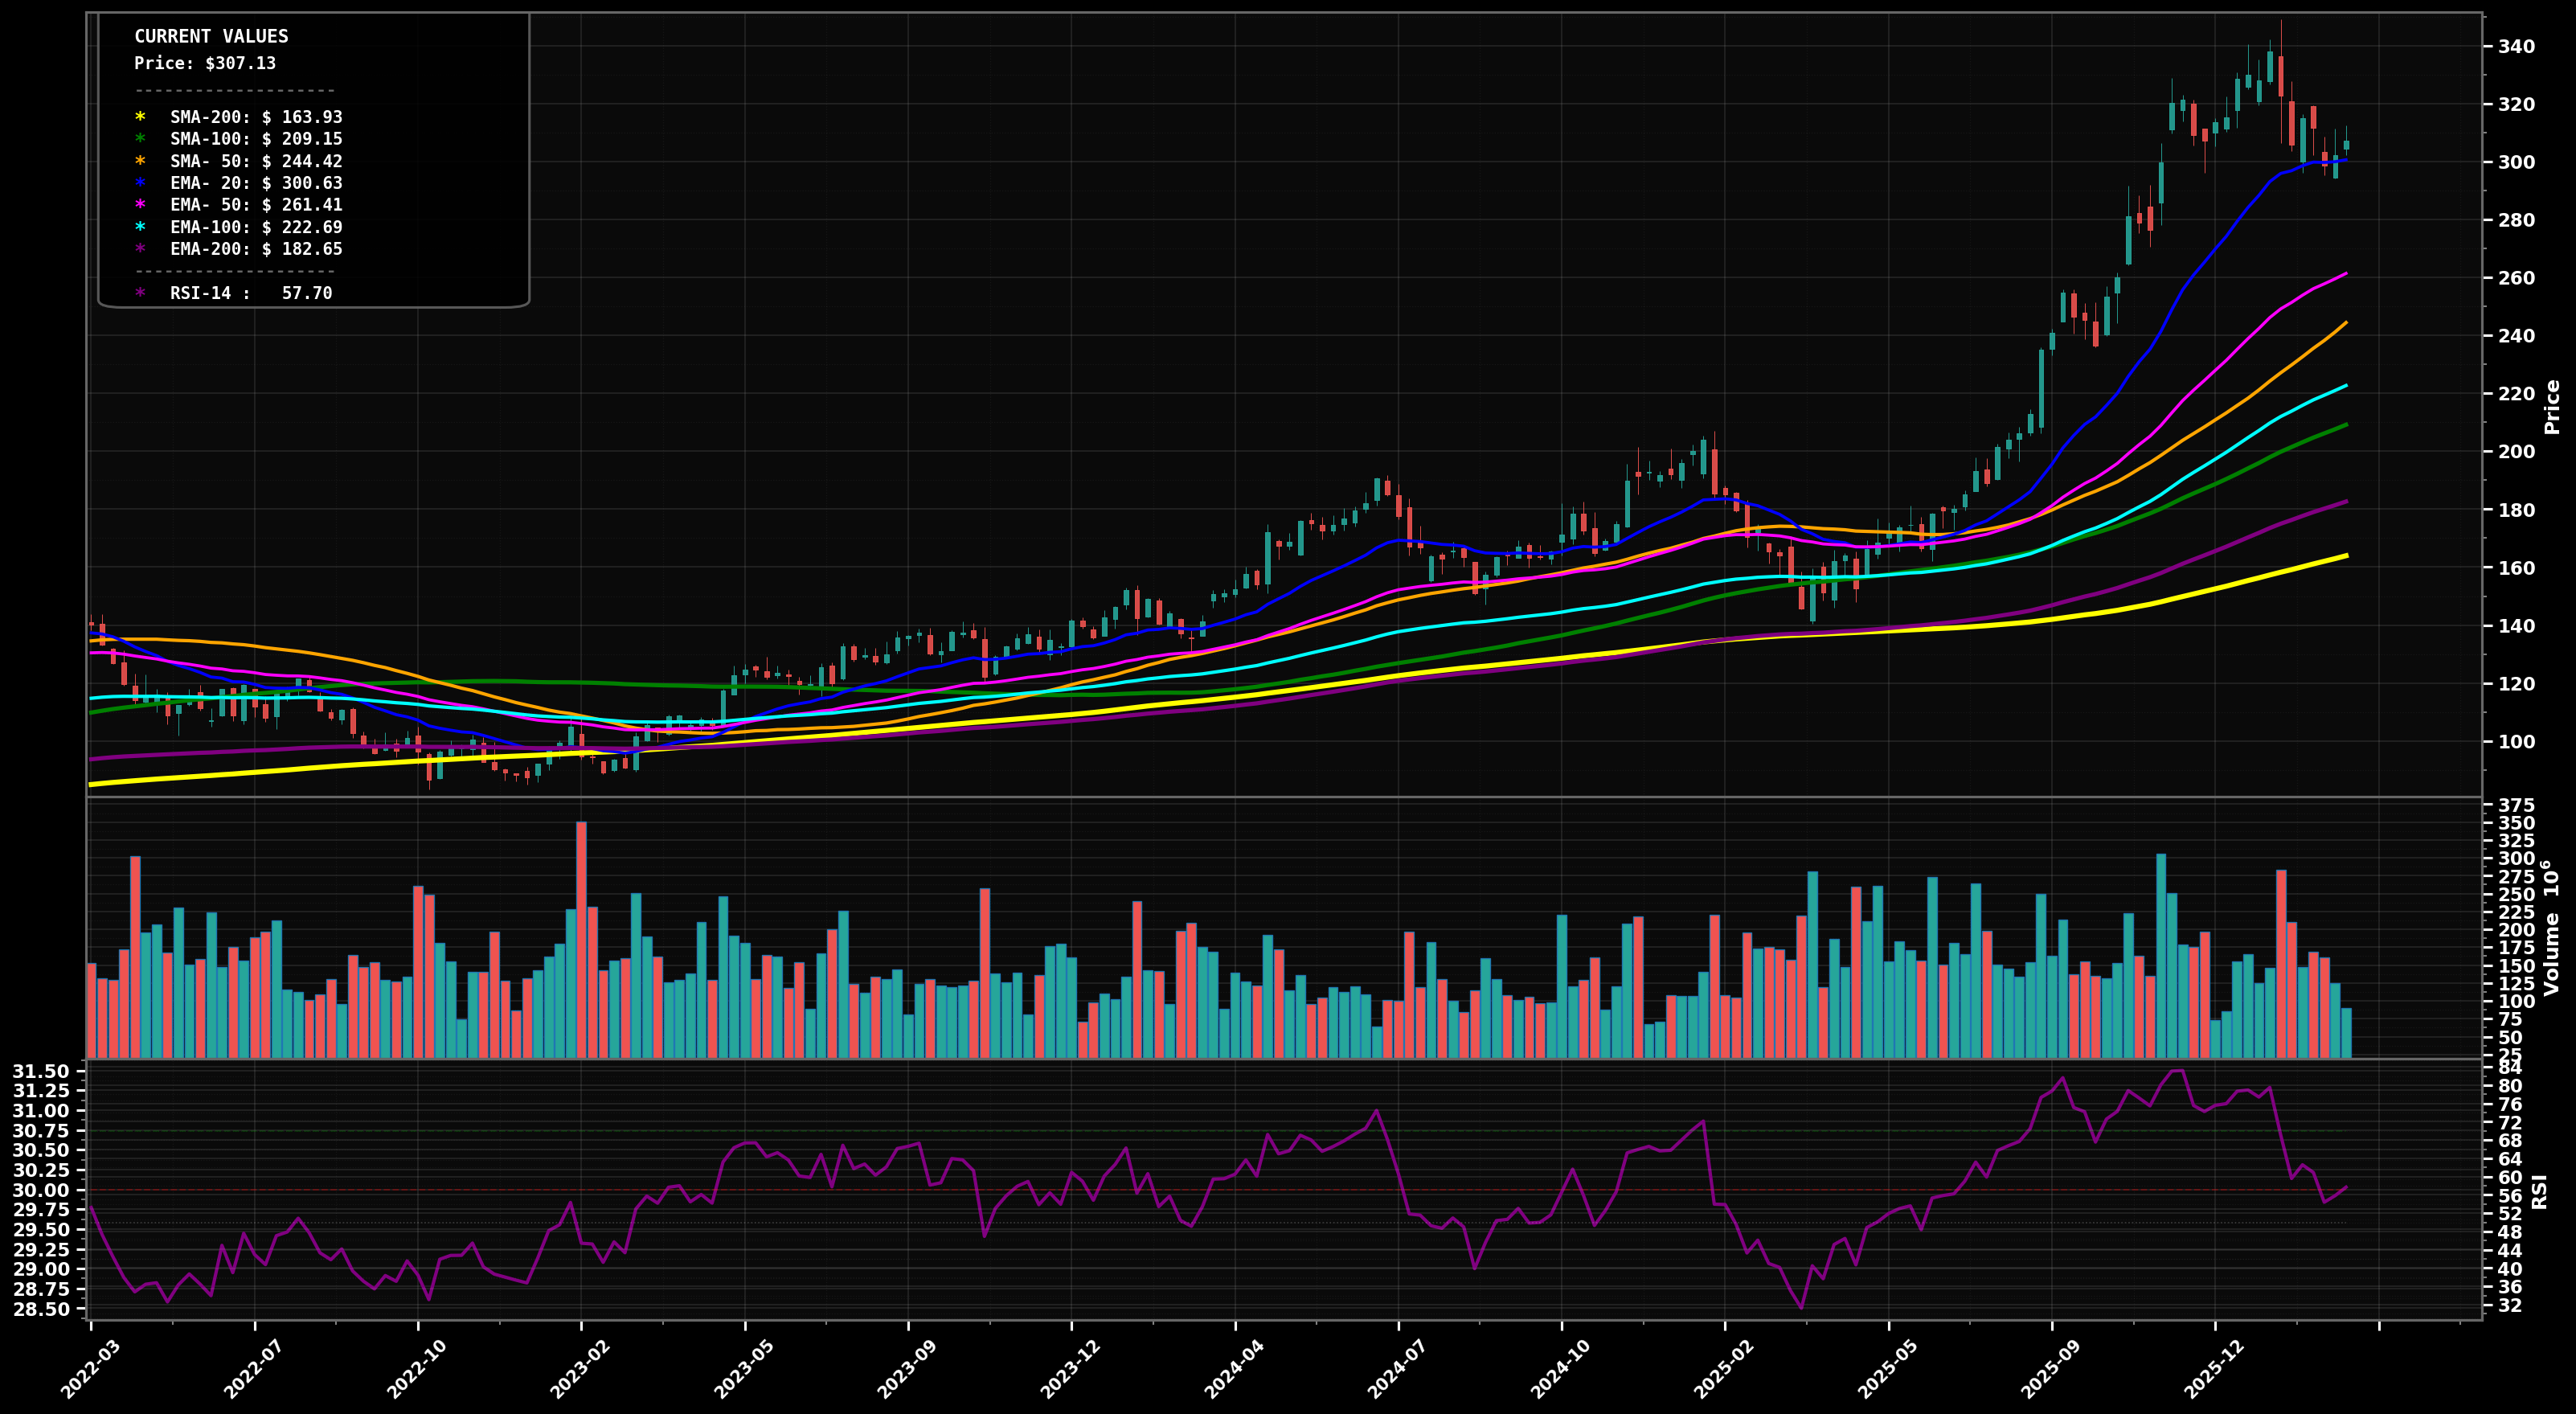
Deeper pullback: rejection near $400 forms a short-term LH and price mean-reverts toward the rising EMA50 (~$289) / prior base, consistent with a Wave 4-type correction (often 23.6%–38.2% retrace of the last impulse).
Weekly close back above $400
Weekly close below $335
Buy-the-dip zones align with swing support ($335), likely fib retrace area into prior breakout/structure ($290-$315), and major dynamic support cluster near EMA100 (~$244) plus prior consolidation ($245-$275).
Trim into repeated extensions above prior ATH ($400) and likely fib extensions; progressively more aggressive de-risking as price stretches farther above rising EMA50/EMA100, where pullback risk typically increases on weekly.
As of May 22, 2026, GOOGL (Alphabet Inc.) is in a uptrend state on the weekly chart with 78% confidence. Weekly uptrend intact; sharp impulse pushed to new highs near $400, followed by a small pullback/inside consolidation while still well above rising EMA50/EMA100.
On the weekly timeframe, GOOGL has key support at $335 and key resistance at $400. The most likely scenario (bullish) targets $400 and $440, with a revert level at $360.
GOOGL (Alphabet Inc.) is currently classified as uptrend on the weekly chart, with 78% confidence. Confirmation requires: Weekly close back above $400 This would be invalidated by: Weekly close below $335
The most likely scenario (bullish) targets $400 and $440, with a revert level at $360. The alternative scenario (bearish) targets $335 and $290.
Multi-layer AI agents analyse 200+ stocks across daily, weekly, and monthly timeframes — producing market state classifications, price scenarios with targets, and position entry/exit levels. Daily charts updated every trading day at 6 PM ET. Weekly charts refresh Fridays. Monthly charts refresh on the last trading day of each month. No paywall. No sign-up required.
Built by Foliotrail.
All content on this website — including charts, analysis, price targets, support/resistance levels, and position zones — is generated entirely by AI and provided for educational and informational purposes only.
This is not financial advice. NEXUSNOIR VENTURES SL (the operator of this website) is not a registered investment adviser or broker-dealer. You should not make investment decisions based solely on this information. Always do your own research and consult a qualified financial advisor.
By continuing, you acknowledge that you have read and agree to our full disclaimer & terms of use and privacy policy.