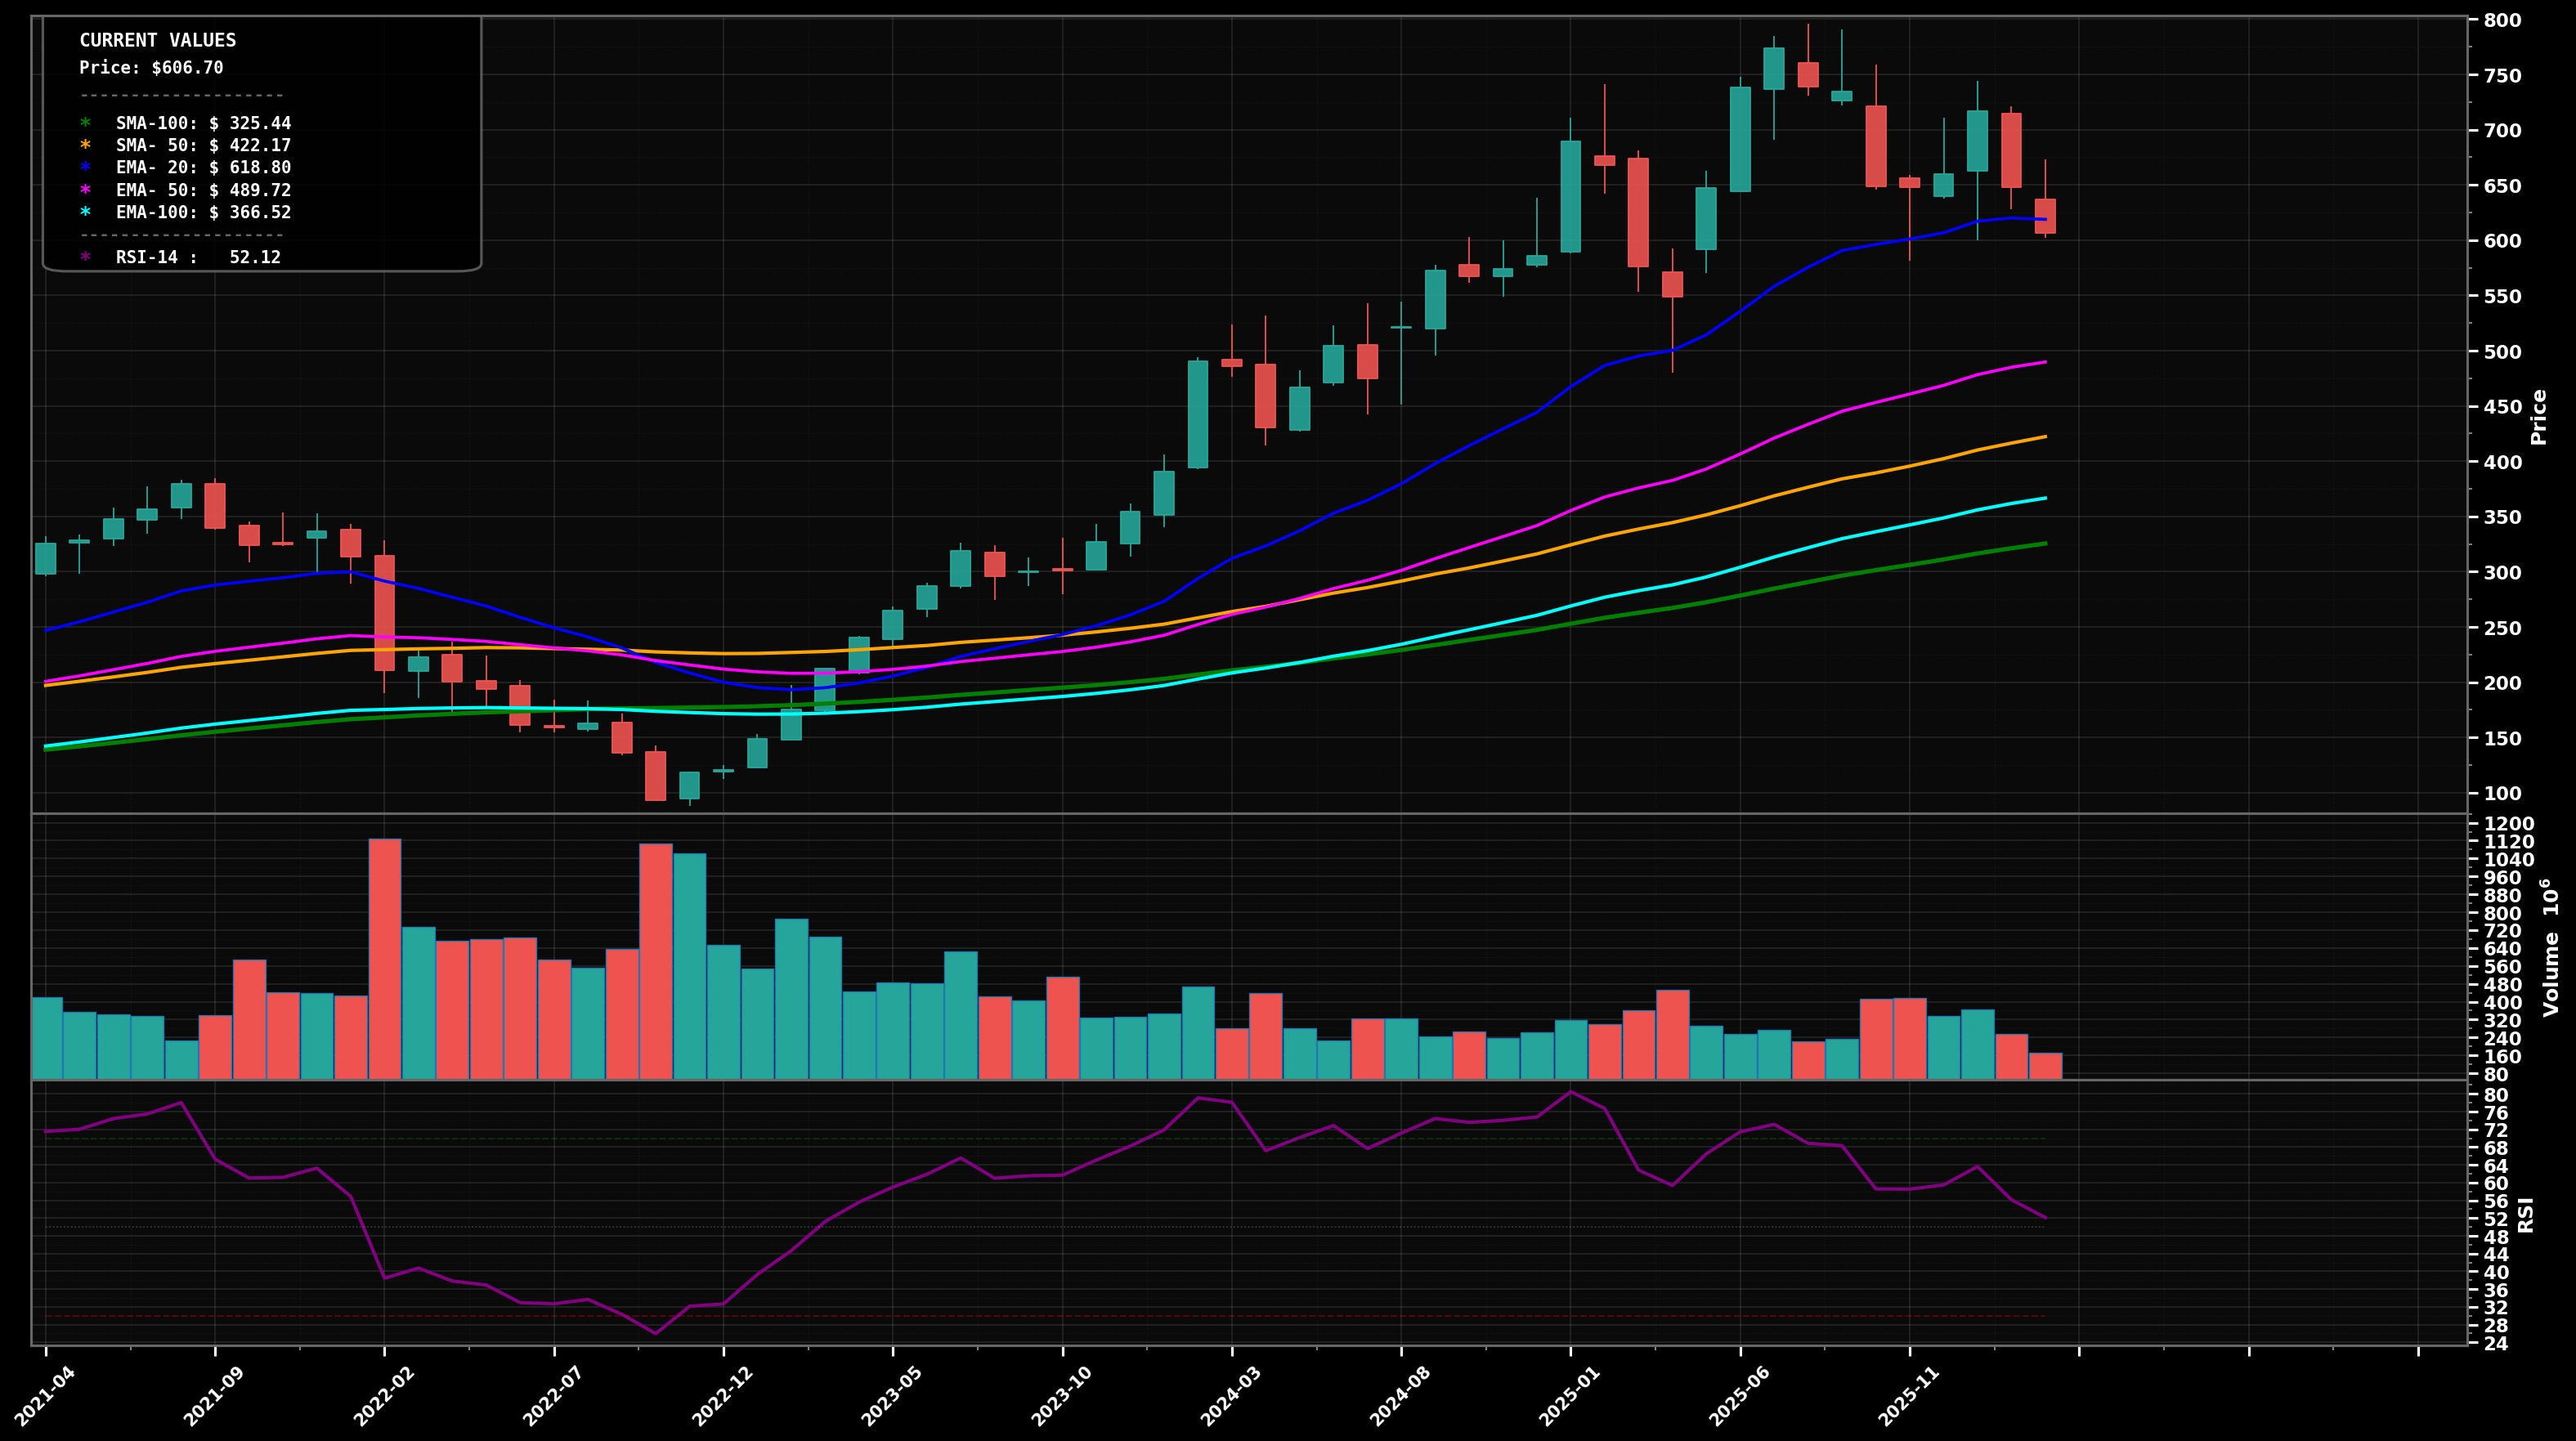
As of May 22, 2026, META (Meta Platforms Inc Class A) is in a choppy range state on the monthly chart, with a confidence level of 58%. Key support is at $560 and key resistance at $650. Monthly pullback from the ~$790 peak; last close near $610 is holding above rising EMA50 (~$498) and well above SMA50 (~$437) while consolidating around the short-term EMA20 (~$615).
Base-building above $560 and reclaim/hold above $650, then a retest of the prior supply zone; fits an Elliott Wave view of a larger uptrend in a Wave 4-type consolidation before a potential final push (Wave 5).
Support fails and the correction deepens toward the rising medium-term averages; this would align with a larger-degree Wave 4 expanding into a deeper Fibonacci retrace of the ~$90->$790 advance (common zones: ~38.2% to 50%).
2+ monthly closes above $650 (with follow-through) would confirm resolution to the upside from this consolidation.
A monthly close below $560 would invalidate the neutral-range read and shift bias toward a deeper corrective leg.
Stagger entries at (1) current swing-support zone (~$560), (2) EMA50 confluence (~$498) if tested, and (3) SMA50 area (~$437) as deeper Fibonacci/MA confluence for a Wave-4 style pullback.
Trim into prior peak/supply (~$740-$790), then reduce more if price extends into clear new ATH expansion; fully exit only on multi-year overextension well above the major rising MAs where mean-reversion risk is highest.
As of May 22, 2026, META (Meta Platforms Inc Class A) is in a choppy range state on the monthly chart with 58% confidence. Monthly pullback from the ~$790 peak; last close near $610 is holding above rising EMA50 (~$498) and well above SMA50 (~$437) while consolidating around the short-term EMA20 (~$615).
On the monthly timeframe, META has key support at $560 and key resistance at $650. The most likely scenario (bullish) targets $650 and $740, with a revert level at $600.
META (Meta Platforms Inc Class A) is currently classified as choppy range on the monthly chart, with 58% confidence. Confirmation requires: 2+ monthly closes above $650 (with follow-through) would confirm resolution to the upside from this consolidation. This would be invalidated by: A monthly close below $560 would invalidate the neutral-range read and shift bias toward a deeper corrective leg.
The most likely scenario (bullish) targets $650 and $740, with a revert level at $600. The alternative scenario (bearish) targets $520 and $440.
Multi-layer AI agents analyse 200+ stocks across daily, weekly, and monthly timeframes — producing market state classifications, price scenarios with targets, and position entry/exit levels. Daily charts updated every trading day at 6 PM ET. Weekly charts refresh Fridays. Monthly charts refresh on the last trading day of each month. No paywall. No sign-up required.
Built by Foliotrail.
All content on this website — including charts, analysis, price targets, support/resistance levels, and position zones — is generated entirely by AI and provided for educational and informational purposes only.
This is not financial advice. NEXUSNOIR VENTURES SL (the operator of this website) is not a registered investment adviser or broker-dealer. You should not make investment decisions based solely on this information. Always do your own research and consult a qualified financial advisor.
By continuing, you acknowledge that you have read and agree to our full disclaimer & terms of use and privacy policy.