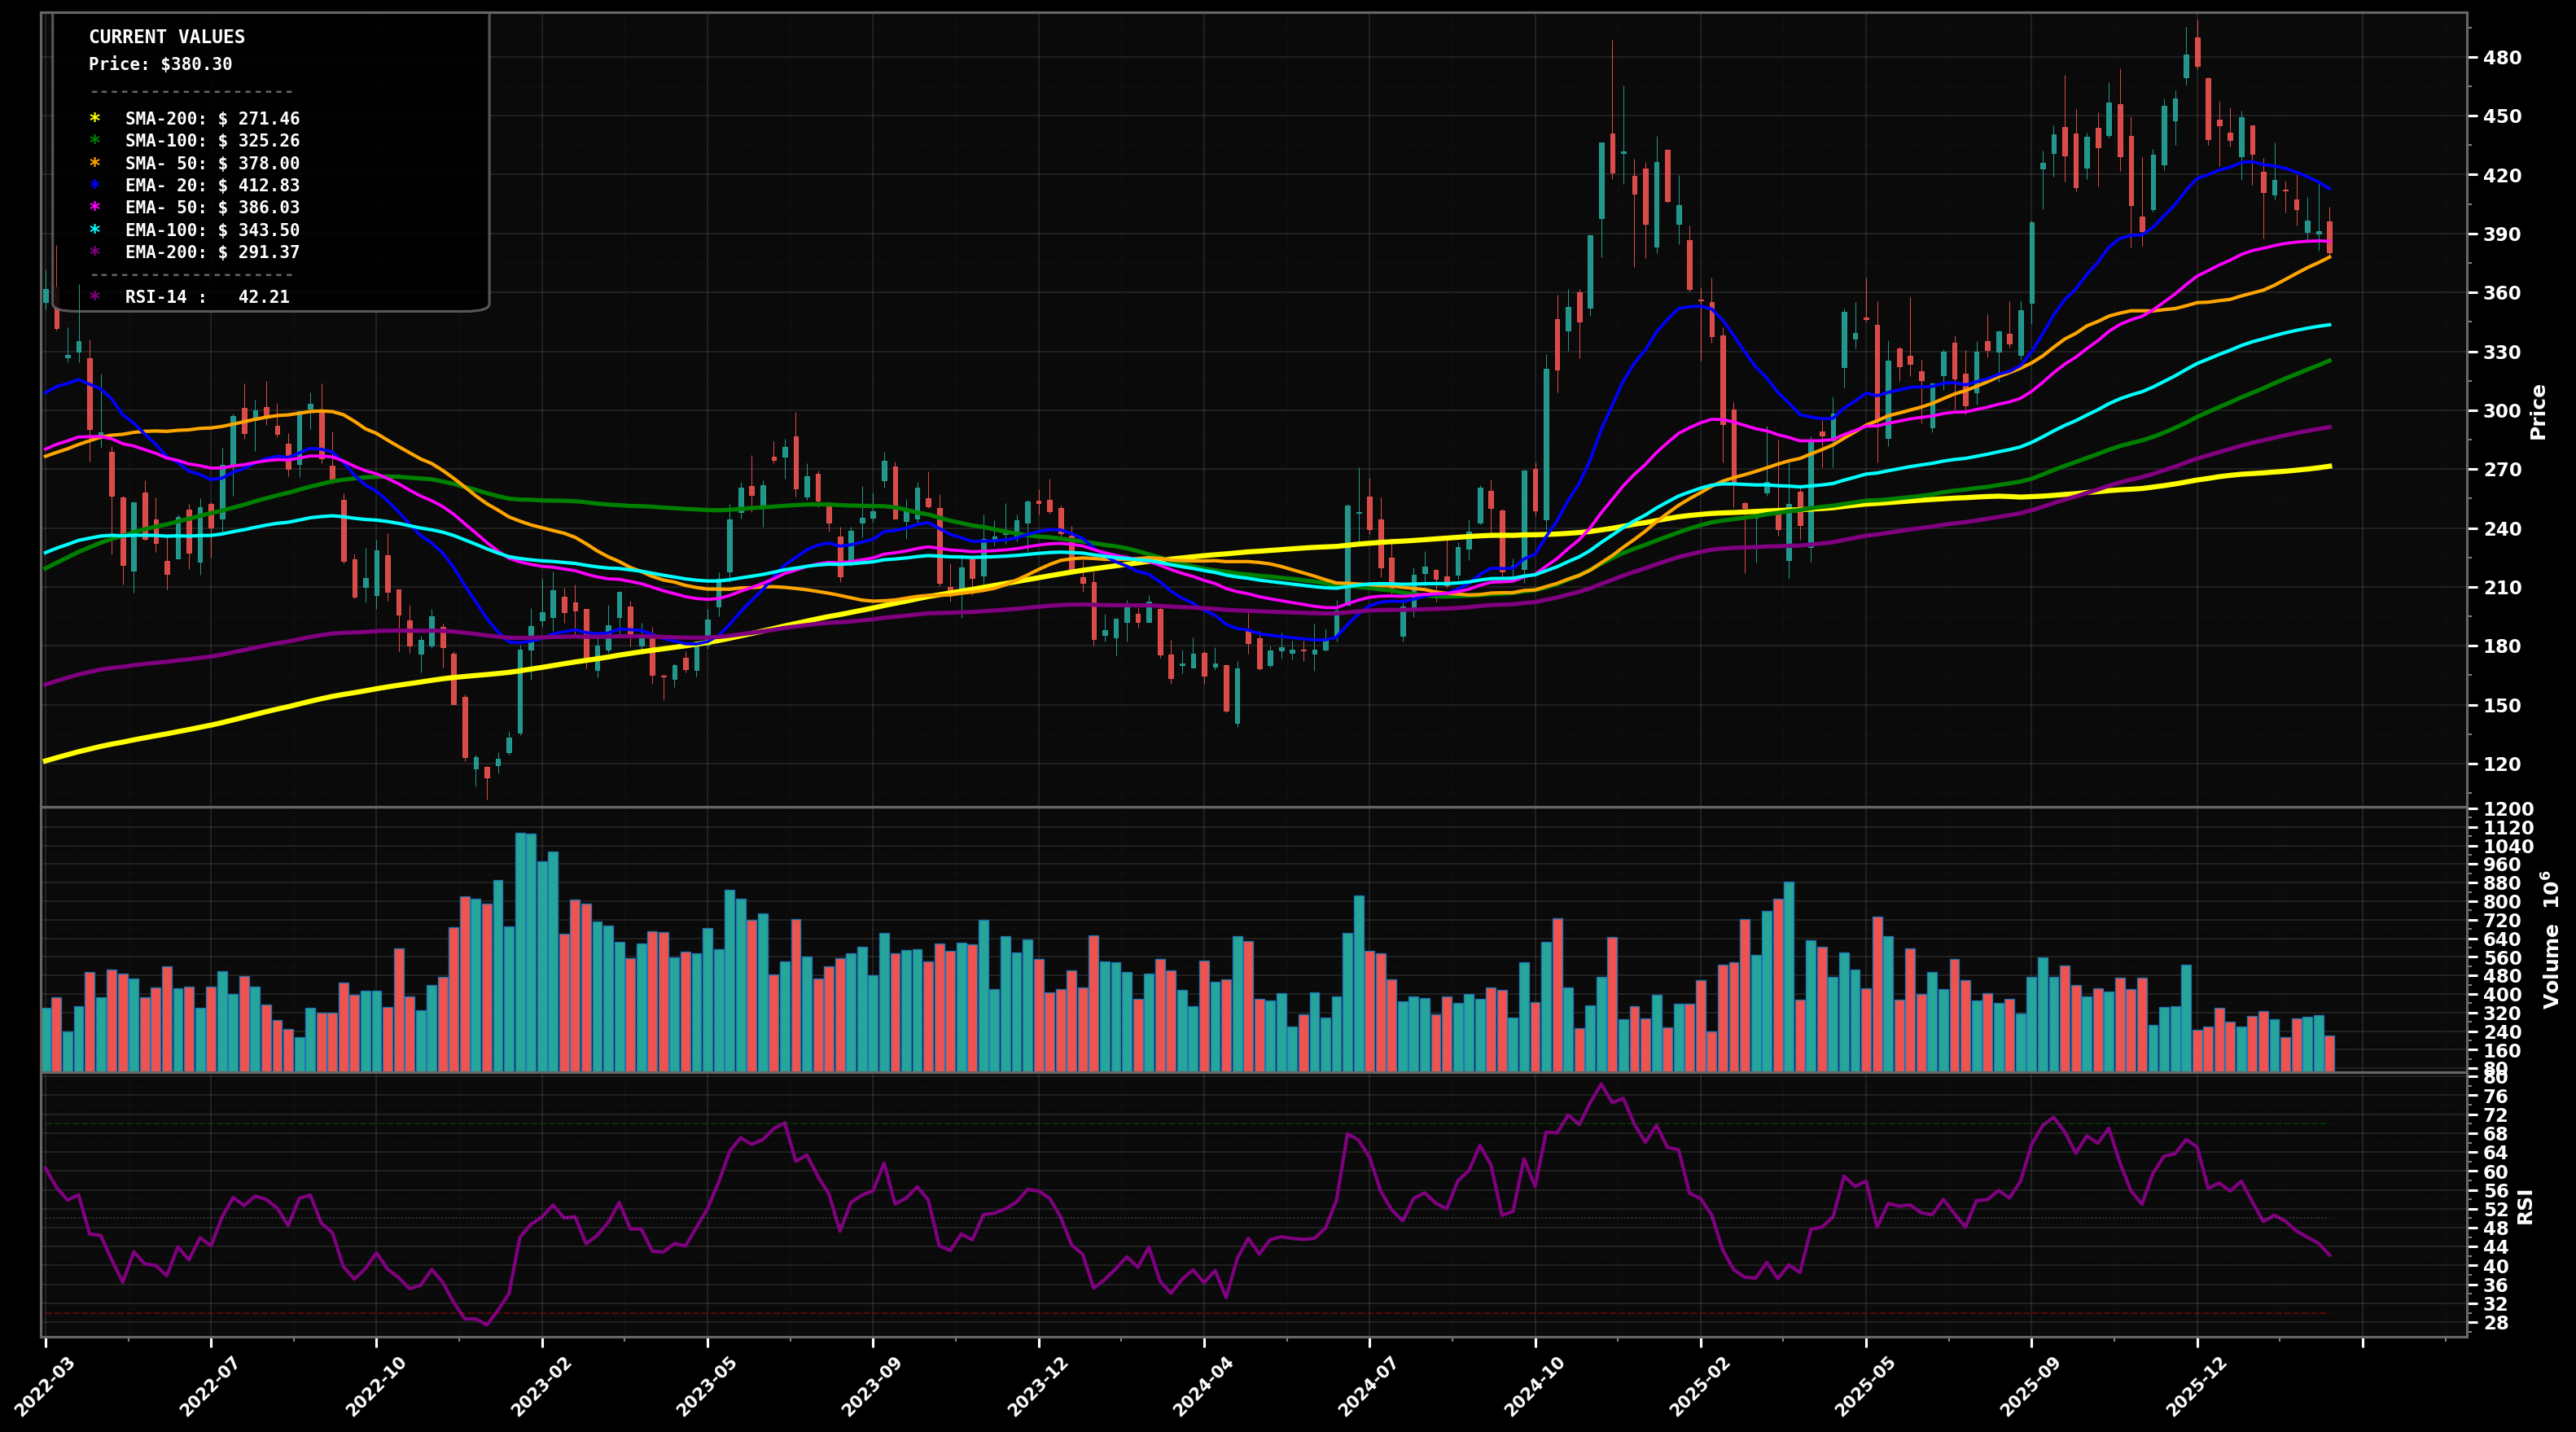
As of May 22, 2026, TSLA (Tesla, Inc.) is in a uptrend state on the weekly chart, with a confidence level of 62%. Key support is at $388 and key resistance at $440. Weekly rebound back above the clustered $390–$405 moving-average zone; momentum improving (RSI ~56) after a prior pullback from the $480s.
Bullish continuation: current bounce is likely wave (3)/(5) resumption after a corrective pullback (wave (2)/(4)) that held above rising EMA50; price grinds higher, retests $440 then pushes toward the prior swing-high supply zone.
Bearish pullback: the rebound fails at $440–$450 (supply/failed breakout), rolls over to retest the moving-average cluster; if $388 breaks on a weekly close, downside mean-reversion expands toward the next MA shelf.
Weekly close above $440 (hold for 2 weeks) to confirm trend continuation toward prior highs
Weekly close below $388 would invalidate the immediate bullish continuation and reopen a deeper pullback risk
Scale near the reclaimed MA cluster ($395–$410), add on EMA50 retest ($372–$388), deploy heavier near EMA100/SMA100 confluence (~$351) where trend often defends on weekly.
Trim into prior ATH supply/extension ($480–$520), trim harder on multi-year extension (Fib-style 1.272–1.618 zone behavior), and fully exit if price becomes extremely stretched vs weekly MAs/long-term trend.
As of May 22, 2026, TSLA (Tesla, Inc.) is in a uptrend state on the weekly chart with 62% confidence. Weekly rebound back above the clustered $390–$405 moving-average zone; momentum improving (RSI ~56) after a prior pullback from the $480s.
On the weekly timeframe, TSLA has key support at $388 and key resistance at $440. The most likely scenario (bullish) targets $440 and $480, with a revert level at $405.
TSLA (Tesla, Inc.) is currently classified as uptrend on the weekly chart, with 62% confidence. Confirmation requires: Weekly close above $440 (hold for 2 weeks) to confirm trend continuation toward prior highs This would be invalidated by: Weekly close below $388 would invalidate the immediate bullish continuation and reopen a deeper pullback risk
The most likely scenario (bullish) targets $440 and $480, with a revert level at $405. The alternative scenario (bearish) targets $388 and $351.
Multi-layer AI agents analyse 200+ stocks across daily, weekly, and monthly timeframes — producing market state classifications, price scenarios with targets, and position entry/exit levels. Daily charts updated every trading day at 6 PM ET. Weekly charts refresh Fridays. Monthly charts refresh on the last trading day of each month. No paywall. No sign-up required.
Built by Foliotrail.
All content on this website — including charts, analysis, price targets, support/resistance levels, and position zones — is generated entirely by AI and provided for educational and informational purposes only.
This is not financial advice. NEXUSNOIR VENTURES SL (the operator of this website) is not a registered investment adviser or broker-dealer. You should not make investment decisions based solely on this information. Always do your own research and consult a qualified financial advisor.
By continuing, you acknowledge that you have read and agree to our full disclaimer & terms of use and privacy policy.