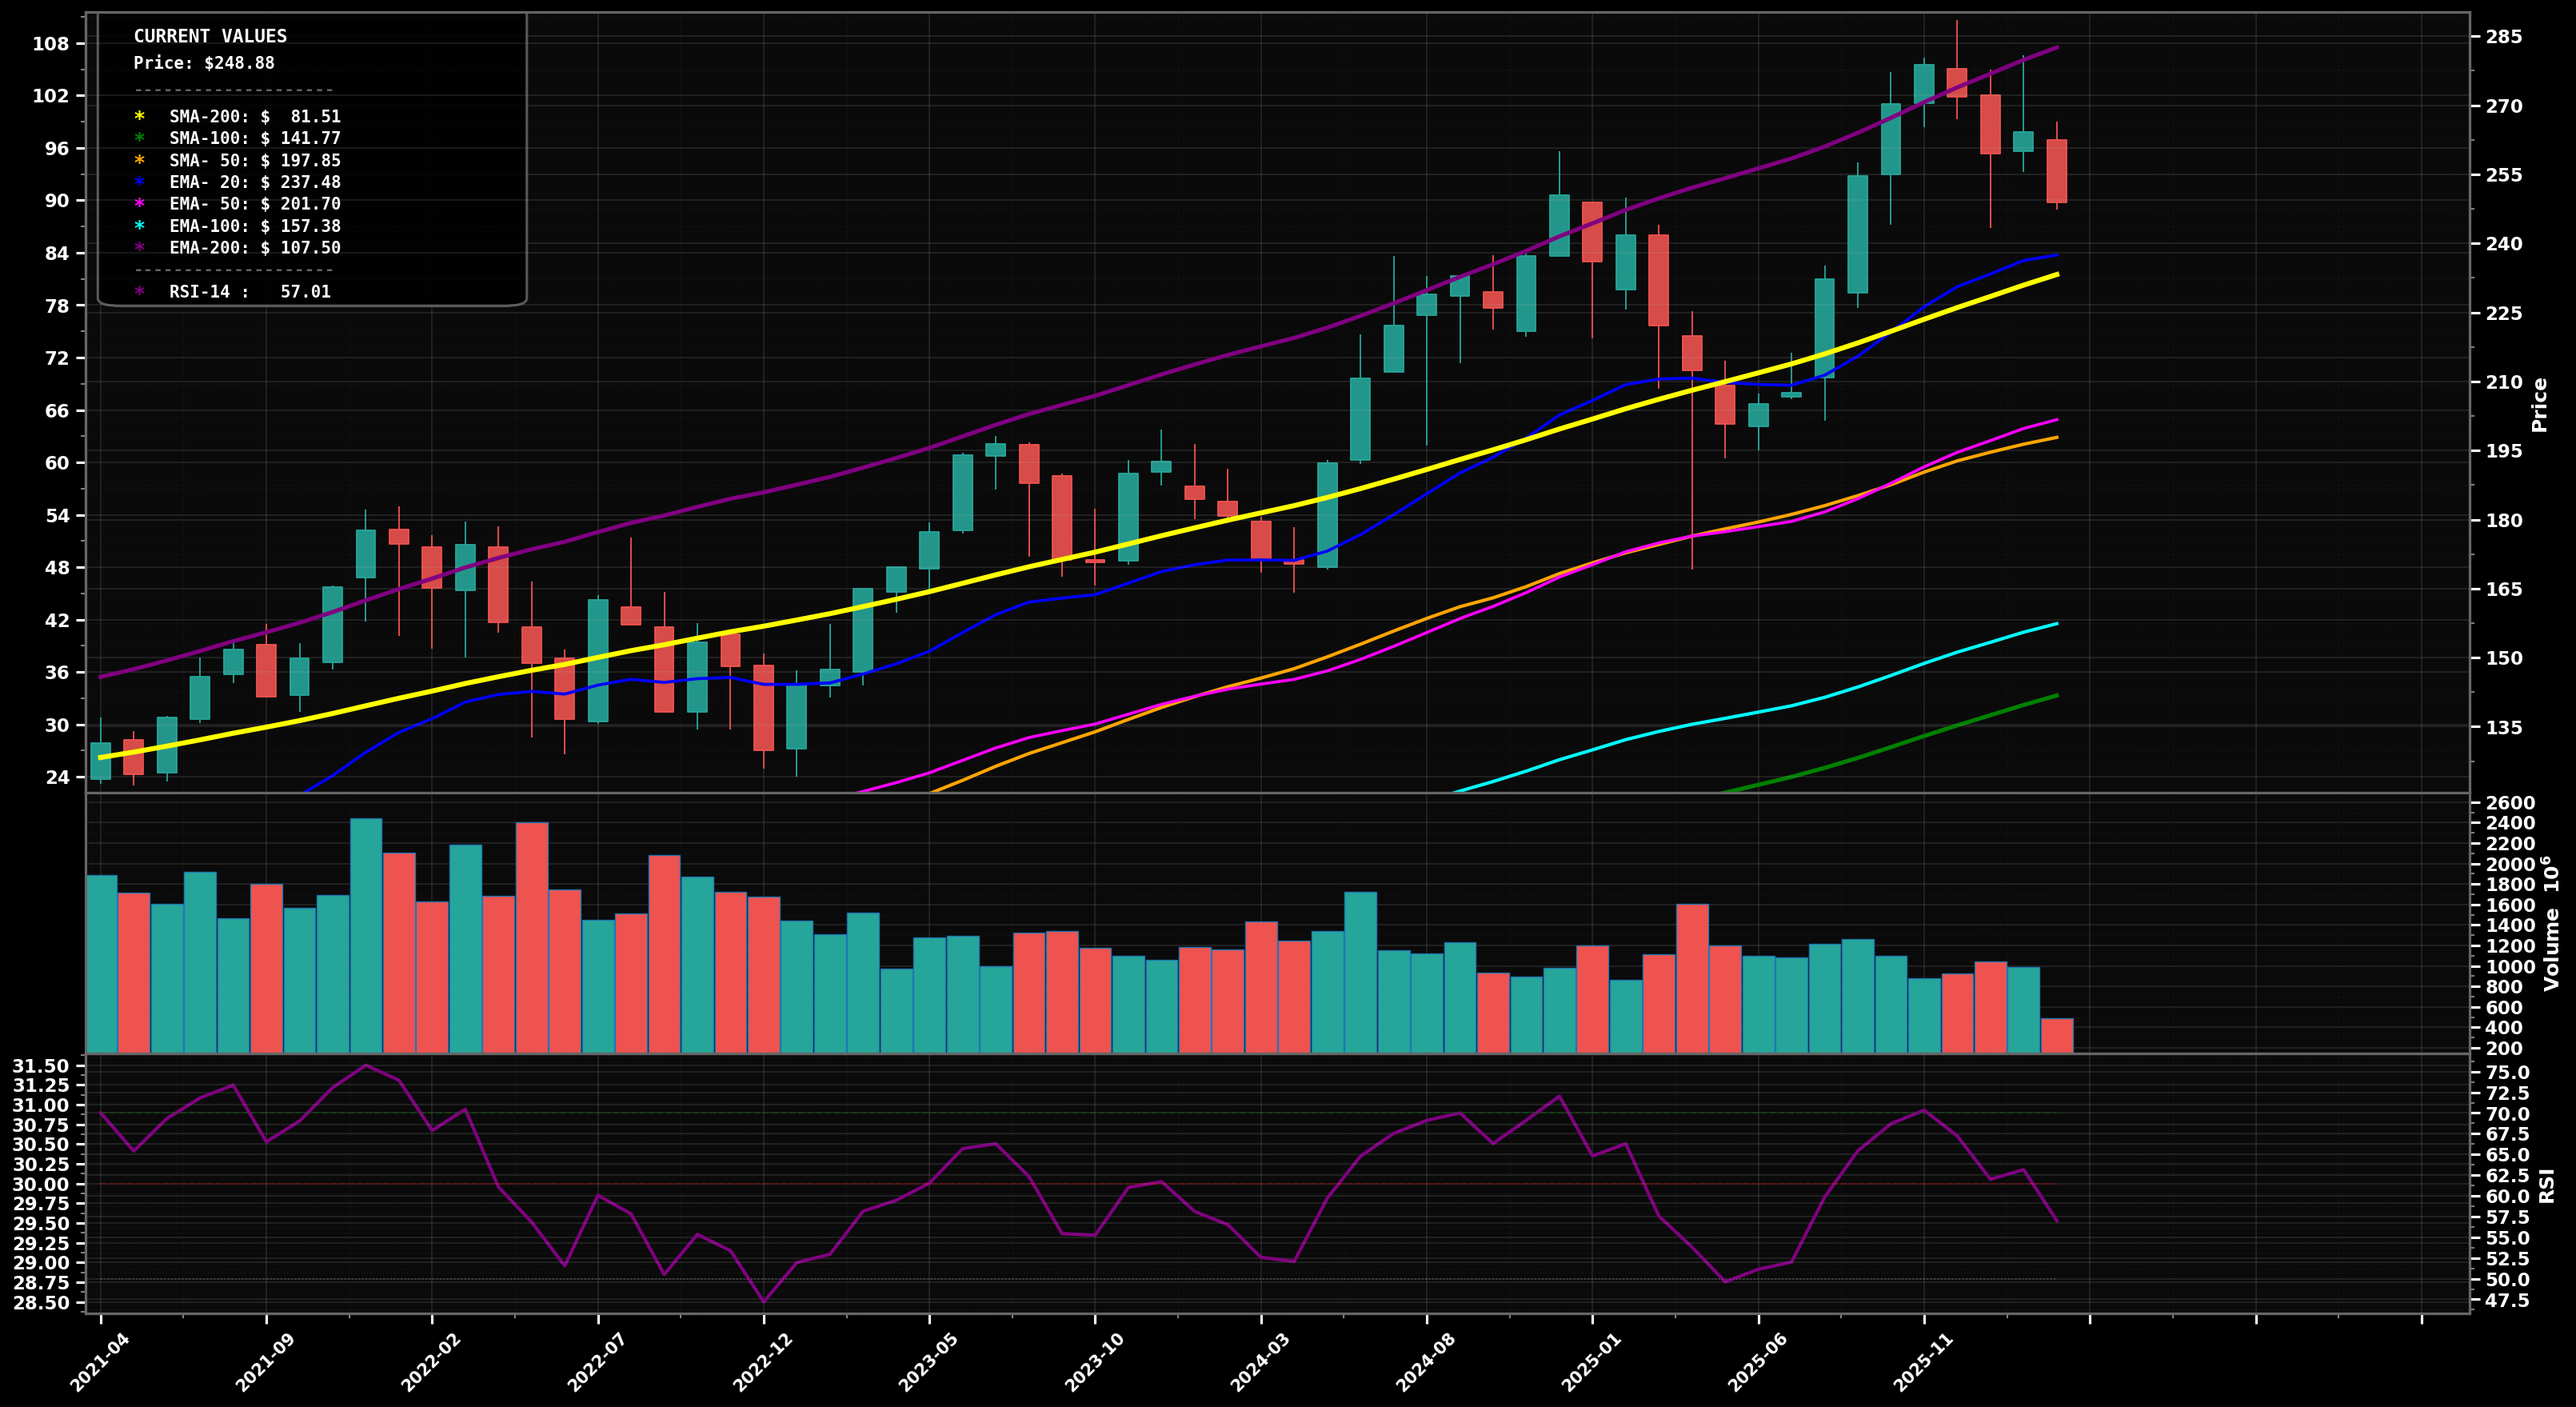
As of May 22, 2026, AAPL (Apple Inc.) is in a uptrend state on the monthly chart, with a confidence level of 78%. Key support is at $285 and key resistance at $310. Monthly candle broke to a new swing high near $309; price is extended above rising EMA50/100 with RSI ~$70 (momentum strong but overbought risk).
Bullish continuation: after a brief digestion/pullback, price holds above the breakout zone and trends to the next fib extension/round-number area; Elliott Wave view: likely in a late Wave 5 extension with smaller-degree pullbacks.
Mean-reversion pullback: overbought monthly RSI + extended distance above EMA50 triggers a deeper retrace toward the rising MA cluster; Elliott Wave alternate: Wave 5 ends and an ABC correction starts toward the 38.2%–50% retrace of the most recent impulse leg.
Hold above $285 on monthly closes (prior breakout/swing area) while EMA50 keeps rising.
Monthly close below $255 (break of last higher-low zone and loss of momentum).
Bias is bullish but stretched: start near prior demand/HL ($255-$270), add on deeper fib/structure support ($225-$240), heavy add only on a trend-reset pullback into the EMA50/SMA50 area (~$205-$215).
Trim into fib-extension/round-number zones as price gets increasingly stretched vs EMA50/100; higher bands imply late-cycle/Wave-5 style extension risk and larger drawdown potential afterward.
As of May 22, 2026, AAPL (Apple Inc.) is in a uptrend state on the monthly chart with 78% confidence. Monthly candle broke to a new swing high near $309; price is extended above rising EMA50/100 with RSI ~$70 (momentum strong but overbought risk).
On the monthly timeframe, AAPL has key support at $285 and key resistance at $310. The most likely scenario (bullish) targets $330 and $360, with a revert level at $285.
AAPL (Apple Inc.) is currently classified as uptrend on the monthly chart, with 78% confidence. Confirmation requires: Hold above $285 on monthly closes (prior breakout/swing area) while EMA50 keeps rising. This would be invalidated by: Monthly close below $255 (break of last higher-low zone and loss of momentum).
The most likely scenario (bullish) targets $330 and $360, with a revert level at $285. The alternative scenario (bearish) targets $255 and $225.
Multi-layer AI agents analyse 200+ stocks across daily, weekly, and monthly timeframes — producing market state classifications, price scenarios with targets, and position entry/exit levels. Daily charts updated every trading day at 6 PM ET. Weekly charts refresh Fridays. Monthly charts refresh on the last trading day of each month. No paywall. No sign-up required.
Built by Foliotrail.
All content on this website — including charts, analysis, price targets, support/resistance levels, and position zones — is generated entirely by AI and provided for educational and informational purposes only.
This is not financial advice. NEXUSNOIR VENTURES SL (the operator of this website) is not a registered investment adviser or broker-dealer. You should not make investment decisions based solely on this information. Always do your own research and consult a qualified financial advisor.
By continuing, you acknowledge that you have read and agree to our full disclaimer & terms of use and privacy policy.