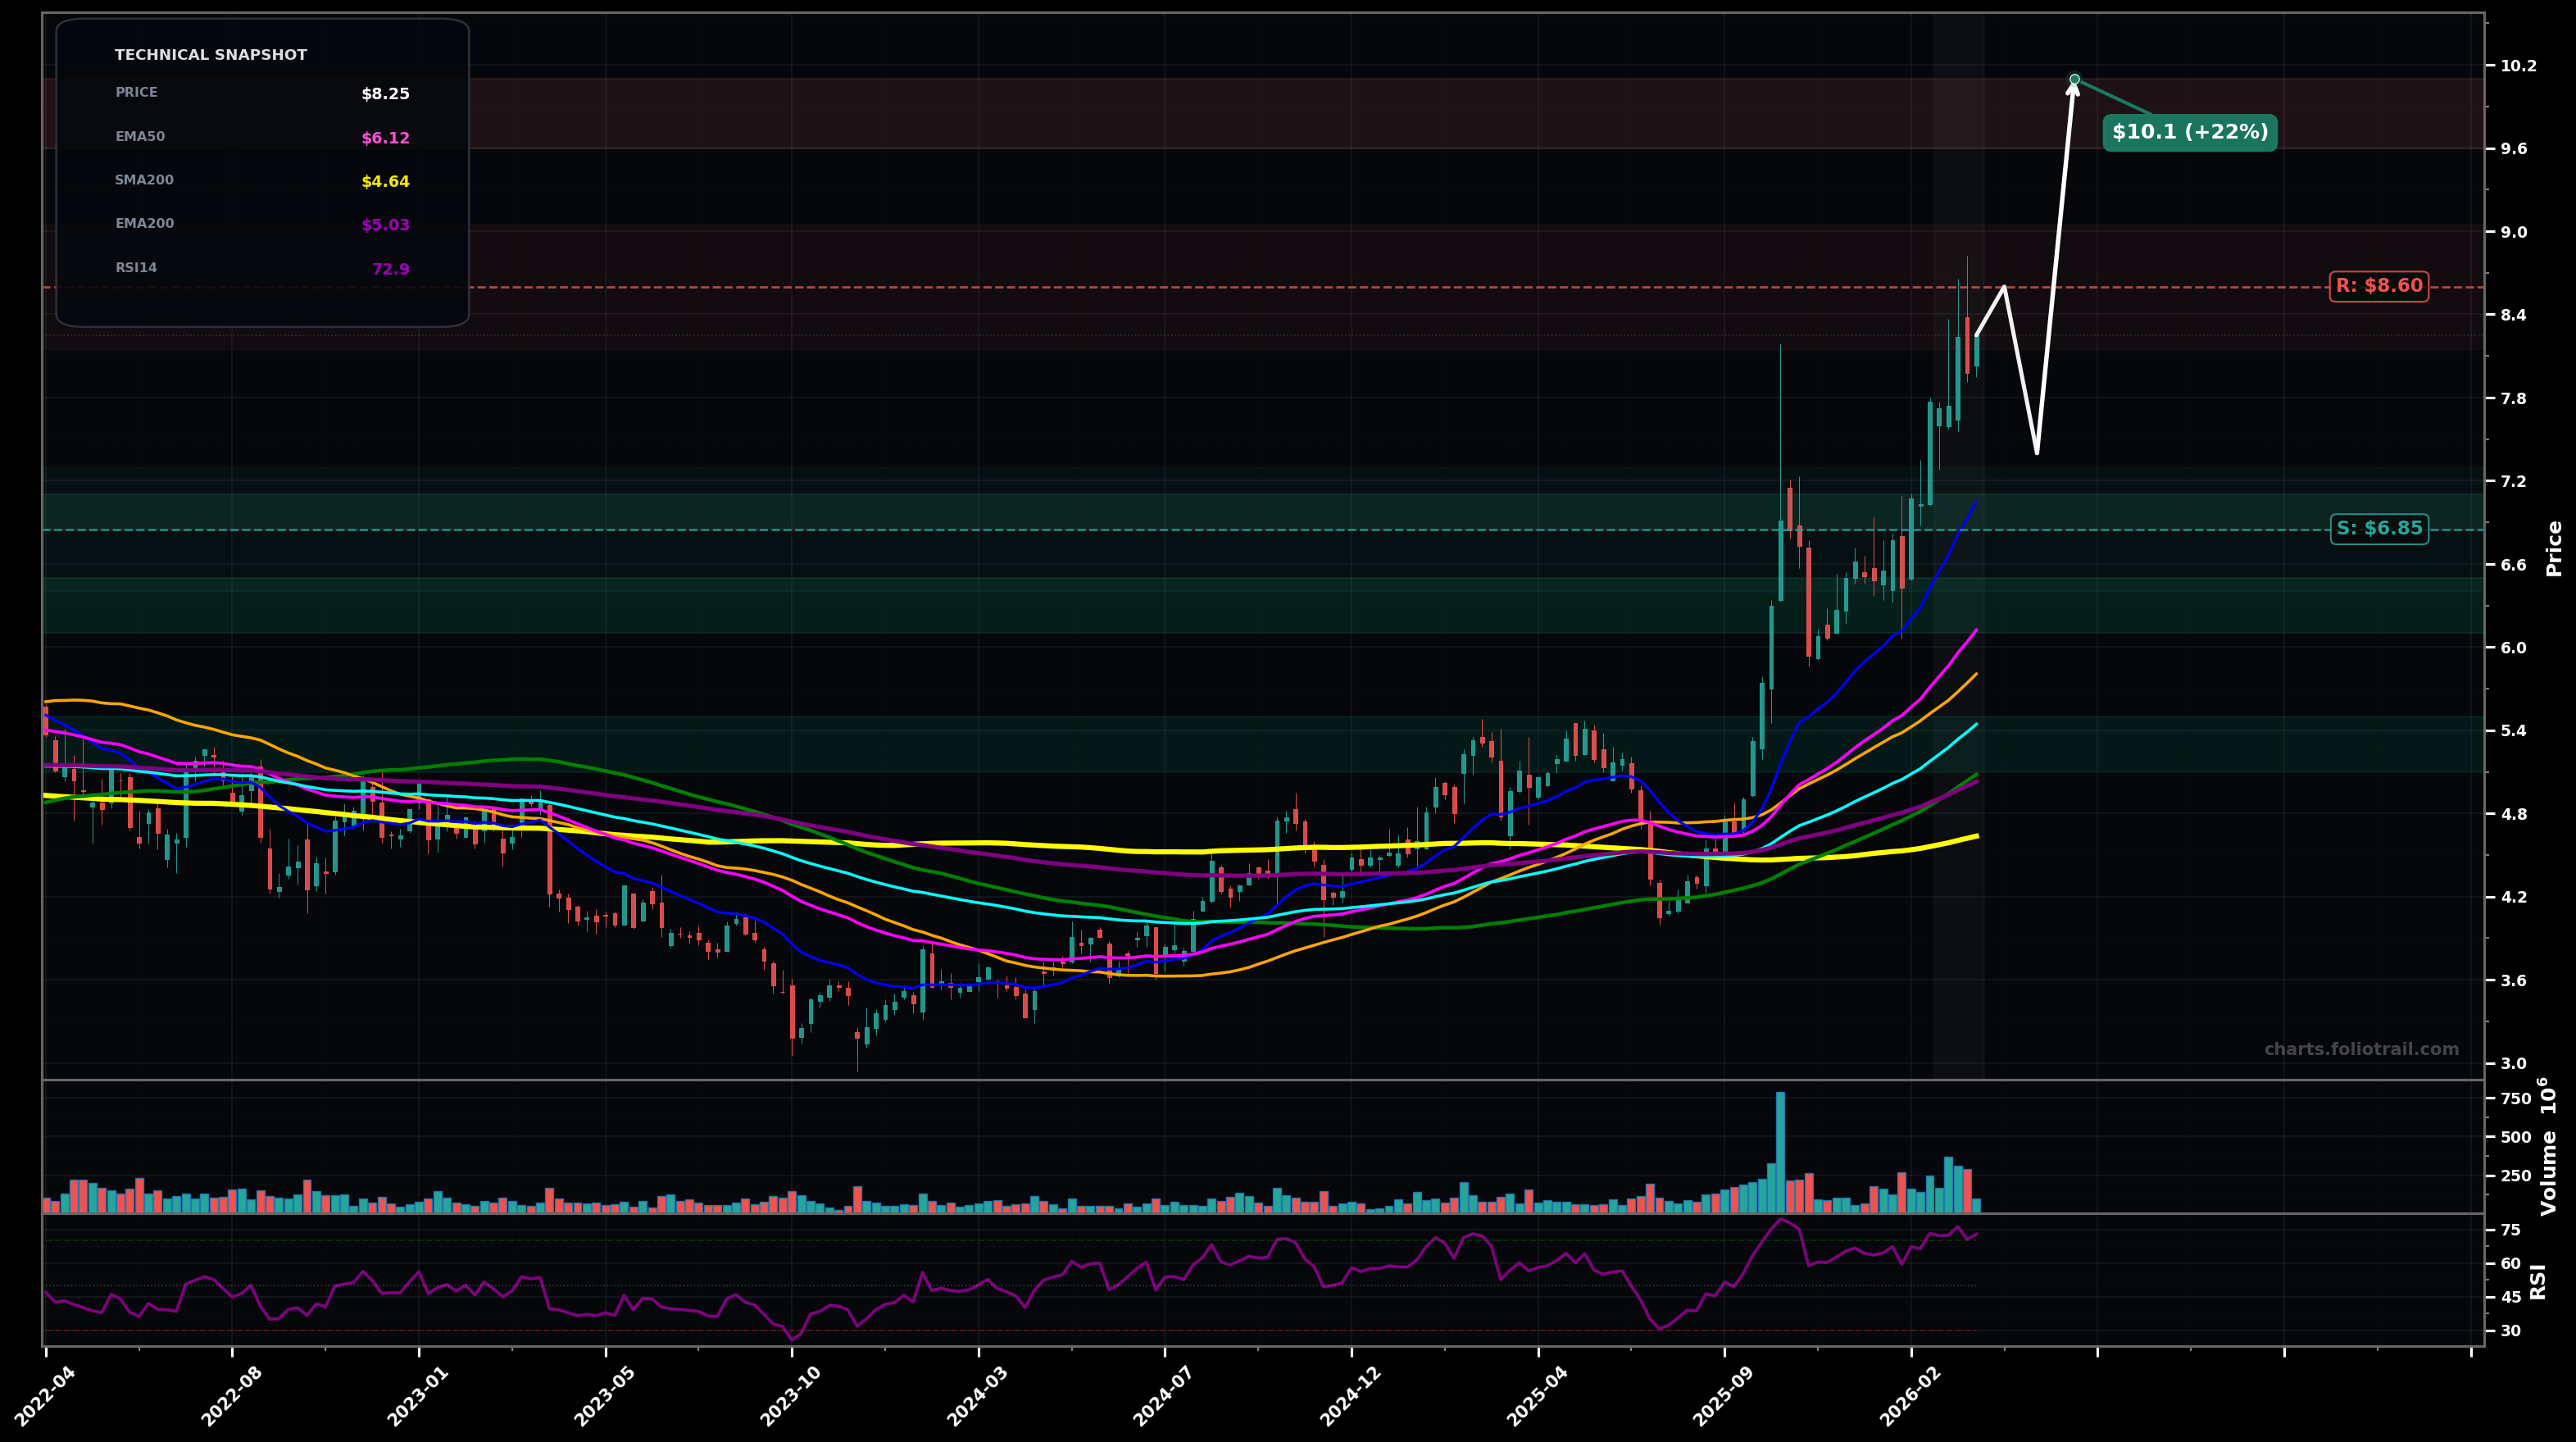
As of June 03, 2026, NOK (Nokia Corporation Sponsored ADR) is in a parabolic state on the weekly chart, with a confidence level of 83%. Key support is at $13.5 and key resistance at $17.2. Vertical HH/HL impulse to ~$17.0 followed by a sharp pullback to ~$15 and quick rebound; price still far above all MAs with RSI ~86 (very stretched).
Bullish continuation but with a likely consolidation: price chops/pulls back toward the breakout shelf and rising short MAs (often Wave 4 pause), then attempts another push to new highs.
Parabolic unwind: a deeper mean-reversion drop into the prior base/impulse origin zone (Fib-style 38.2%–50% retrace of the last leg), then a bounce attempt that may fail into resistance.
Weekly close above $17.20
Weekly close below $13.50
Buy zones mapped to likely post-parabolic mean reversion: prior breakout shelf (~$14-15), then stronger pivot support (~$13.5), then deeper retrace toward the fast-rising EMA20 area (~$11) if volatility expands downward.
Given parabolic extension and RSI extreme, trim into new highs (probable Wave 5 / extension) and scale more aggressively if price goes far beyond prior impulse projections where reversal risk rises sharply.
As of June 03, 2026, NOK (Nokia Corporation Sponsored ADR) is in a parabolic state on the weekly chart with 83% confidence. Vertical HH/HL impulse to ~$17.0 followed by a sharp pullback to ~$15 and quick rebound; price still far above all MAs with RSI ~86 (very stretched).
On the weekly timeframe, NOK has key support at $13.5 and key resistance at $17.2. The most likely scenario (bullish) targets $17.2 and $19.8, with a revert level at $14.8.
NOK (Nokia Corporation Sponsored ADR) is currently classified as parabolic on the weekly chart, with 83% confidence. Confirmation requires: Weekly close above $17.20 This would be invalidated by: Weekly close below $13.50
The most likely scenario (bullish) targets $17.2 and $19.8, with a revert level at $14.8. The alternative scenario (bearish) targets $13.5 and $11.0.
Multi-layer AI agents analyse 200+ stocks across daily, weekly, and monthly timeframes — producing market state classifications, price scenarios with targets, and position entry/exit levels. Daily charts updated every trading day at 6 PM ET. Weekly charts refresh Fridays. Monthly charts refresh on the last trading day of each month. No paywall. No sign-up required.
Built by Foliotrail.
All content on this website — including charts, analysis, price targets, support/resistance levels, and position zones — is generated entirely by AI and provided for educational and informational purposes only.
This is not financial advice. NEXUSNOIR VENTURES SL (the operator of this website) is not a registered investment adviser or broker-dealer. You should not make investment decisions based solely on this information. Always do your own research and consult a qualified financial advisor.
By continuing, you acknowledge that you have read and agree to our full disclaimer & terms of use and privacy policy.