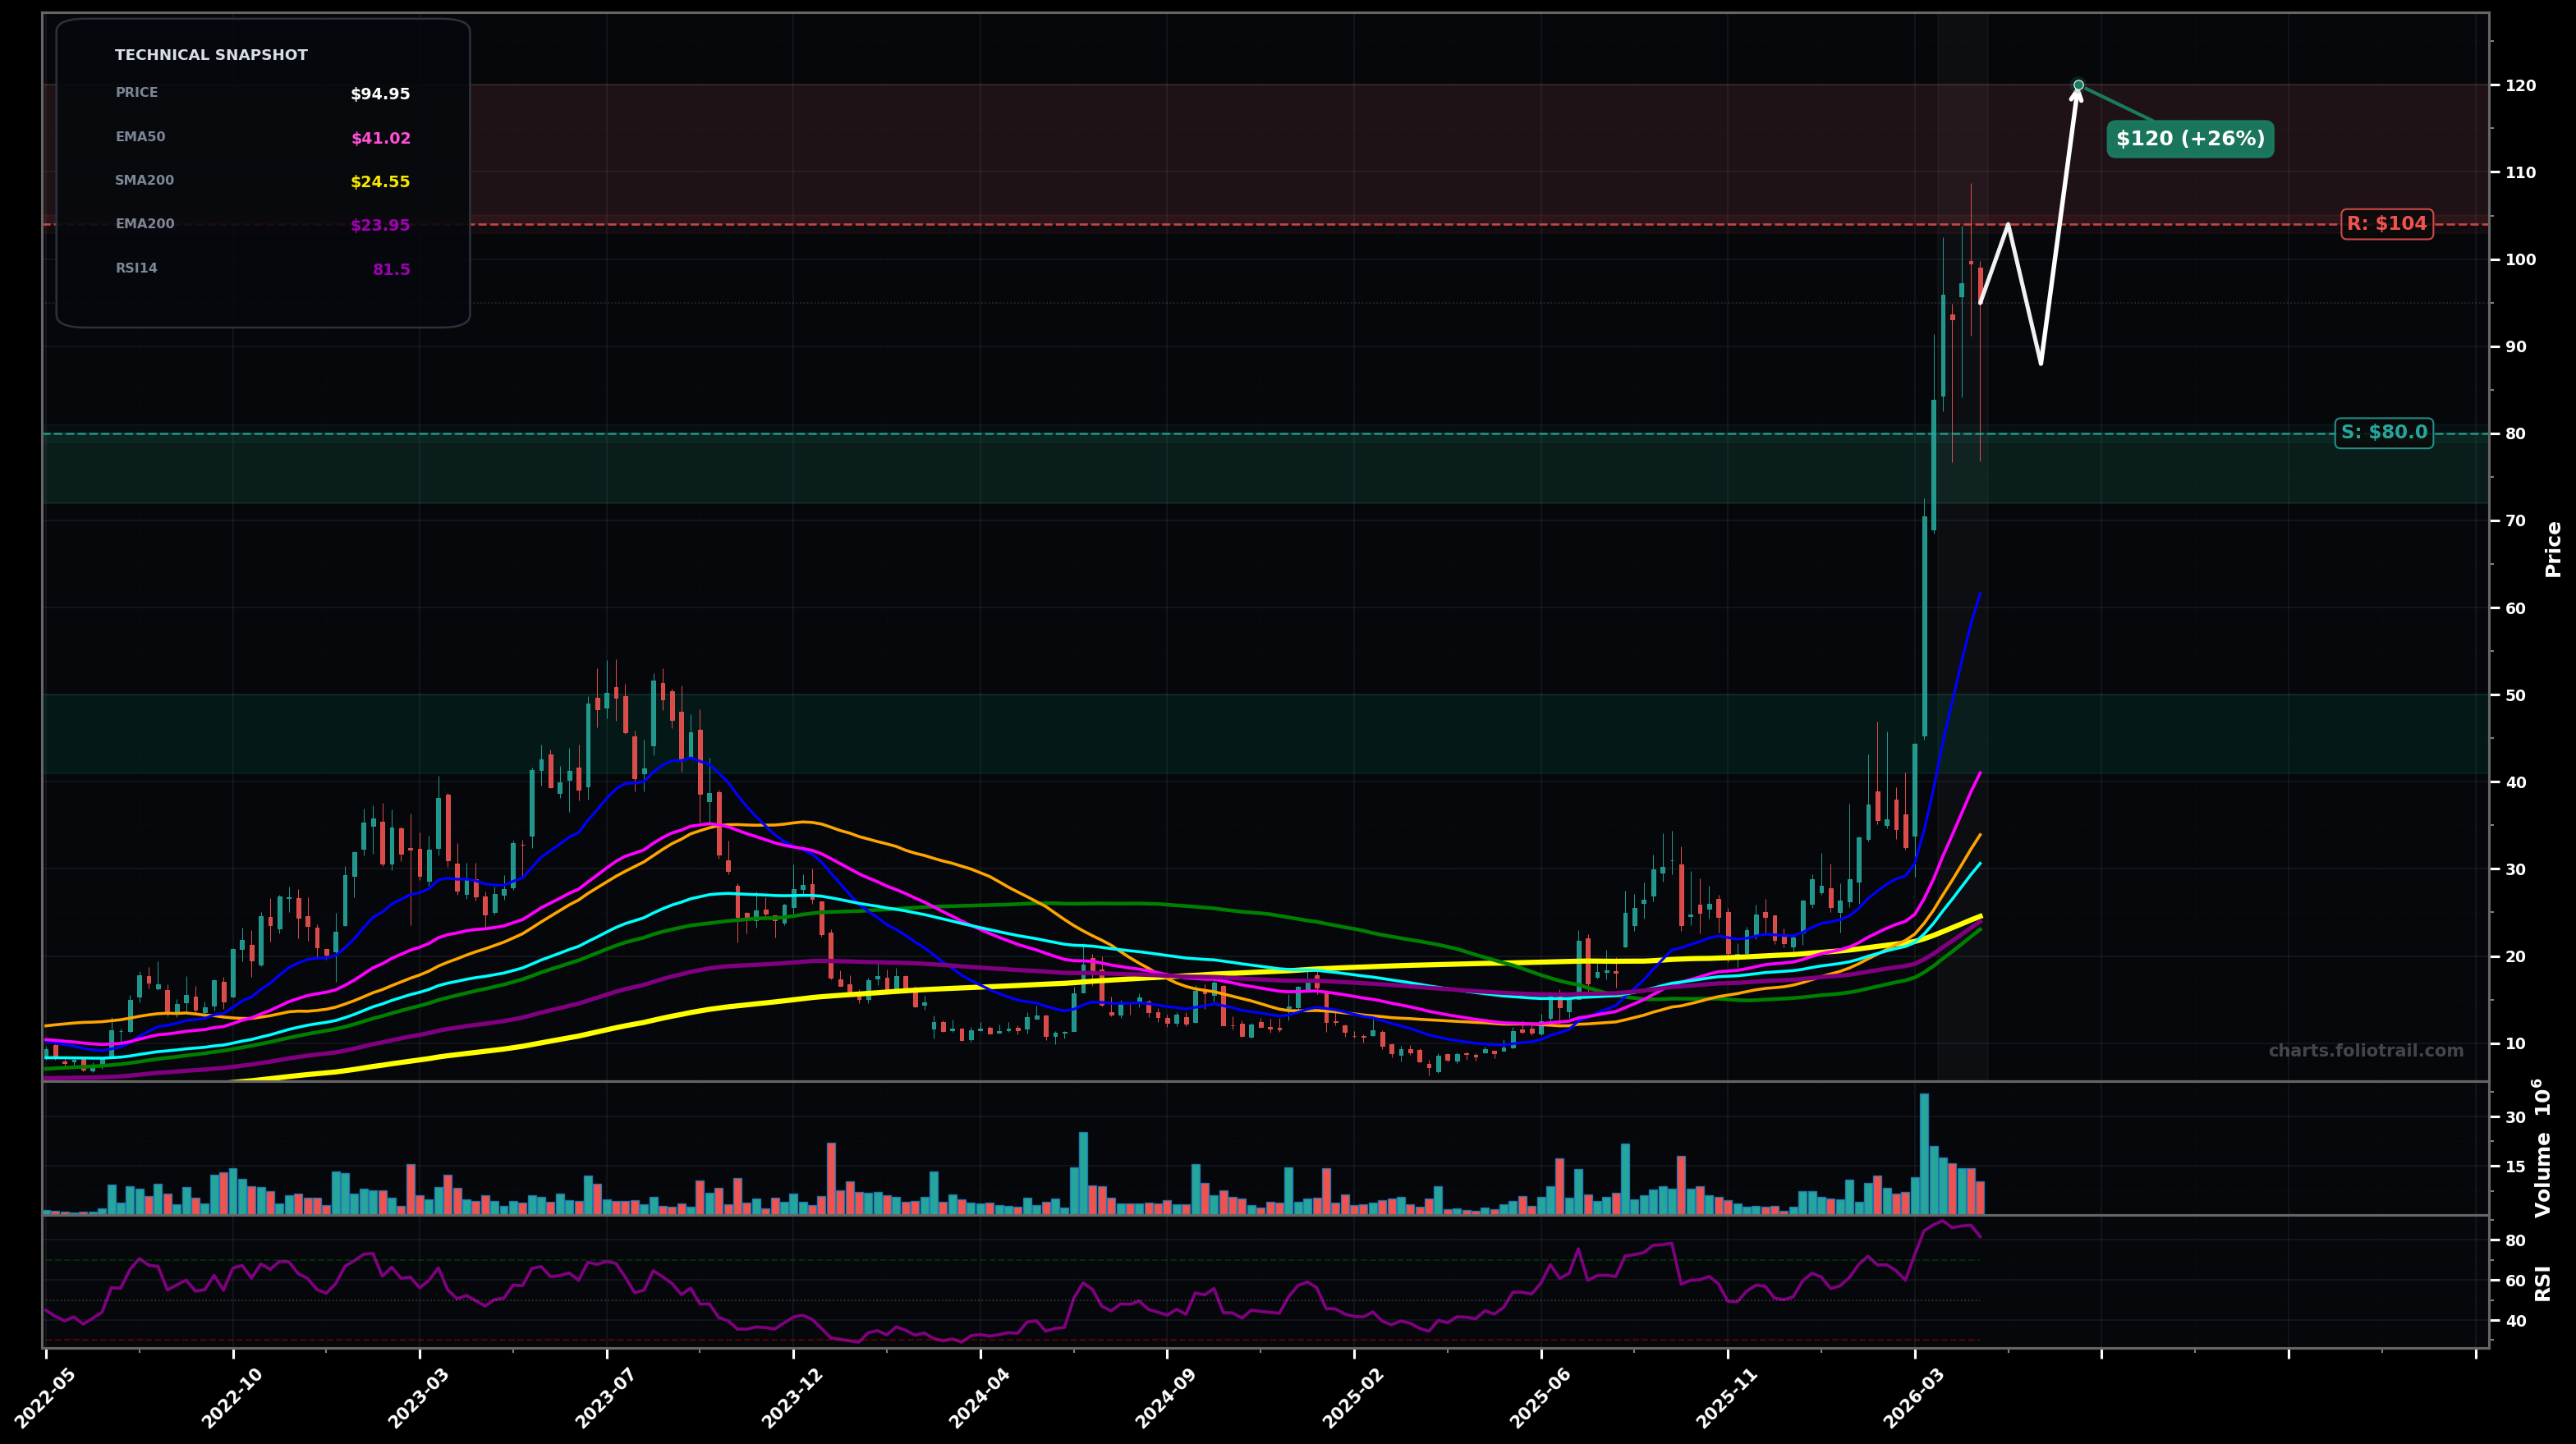
As of May 22, 2026, AEHR (Aehr Test Systems) is in a parabolic state on the weekly chart, with a confidence level of 76%. Key support is at $80.0 and key resistance at $104. Explosive weekly breakout with volume spike into ~$100+ followed by a tight pullback/inside consolidation; price still far above all key MAs, RSI elevated (~81).
Bullish continuation after digestion: holds ~$80–$88, then attempts a breakout back through ~$104; likely Wave 5 extension after a powerful impulse (Elliott: late-stage impulse), with Fib extension targets above the prior pivot.
Mean-reversion / deeper pullback: failure to reclaim highs, then a drop toward the first major trend support cluster (prior breakout zone + fast MA magnet), consistent with a post-blowoff Wave 4 / ABC correction; watch for a higher-low attempt.
Weekly close above $104 would confirm continued parabolic extension.
Weekly close below $80 would invalidate the parabolic continuation and signal a deeper mean-reversion phase.
Buy-the-dip tiers align with: prior breakout/round-number support ($72–$80), then deeper Fib-style retrace zone ($62–$72), with last-resort mean reversion to rising EMA50 (pink ~$41) / prior base area ($41–$50).
Trim into extensions while RSI/price are stretched far above EMA50/100; use $104–$120 as first exhaustion zone, $120–$140 as higher Fib-extension risk area, and $140+ as potential blowoff/mania region if momentum persists.
As of May 22, 2026, AEHR (Aehr Test Systems) is in a parabolic state on the weekly chart with 76% confidence. Explosive weekly breakout with volume spike into ~$100+ followed by a tight pullback/inside consolidation; price still far above all key MAs, RSI elevated (~81).
On the weekly timeframe, AEHR has key support at $80.0 and key resistance at $104. The most likely scenario (bullish) targets $104 and $120, with a revert level at $88.0.
AEHR (Aehr Test Systems) is currently classified as parabolic on the weekly chart, with 76% confidence. Confirmation requires: Weekly close above $104 would confirm continued parabolic extension. This would be invalidated by: Weekly close below $80 would invalidate the parabolic continuation and signal a deeper mean-reversion phase.
The most likely scenario (bullish) targets $104 and $120, with a revert level at $88.0. The alternative scenario (bearish) targets $72.0 and $62.0.
Multi-layer AI agents analyse 200+ stocks across daily, weekly, and monthly timeframes — producing market state classifications, price scenarios with targets, and position entry/exit levels. Daily charts updated every trading day at 6 PM ET. Weekly charts refresh Fridays. Monthly charts refresh on the last trading day of each month. No paywall. No sign-up required.
Built by Foliotrail.
All content on this website — including charts, analysis, price targets, support/resistance levels, and position zones — is generated entirely by AI and provided for educational and informational purposes only.
This is not financial advice. NEXUSNOIR VENTURES SL (the operator of this website) is not a registered investment adviser or broker-dealer. You should not make investment decisions based solely on this information. Always do your own research and consult a qualified financial advisor.
By continuing, you acknowledge that you have read and agree to our full disclaimer & terms of use and privacy policy.