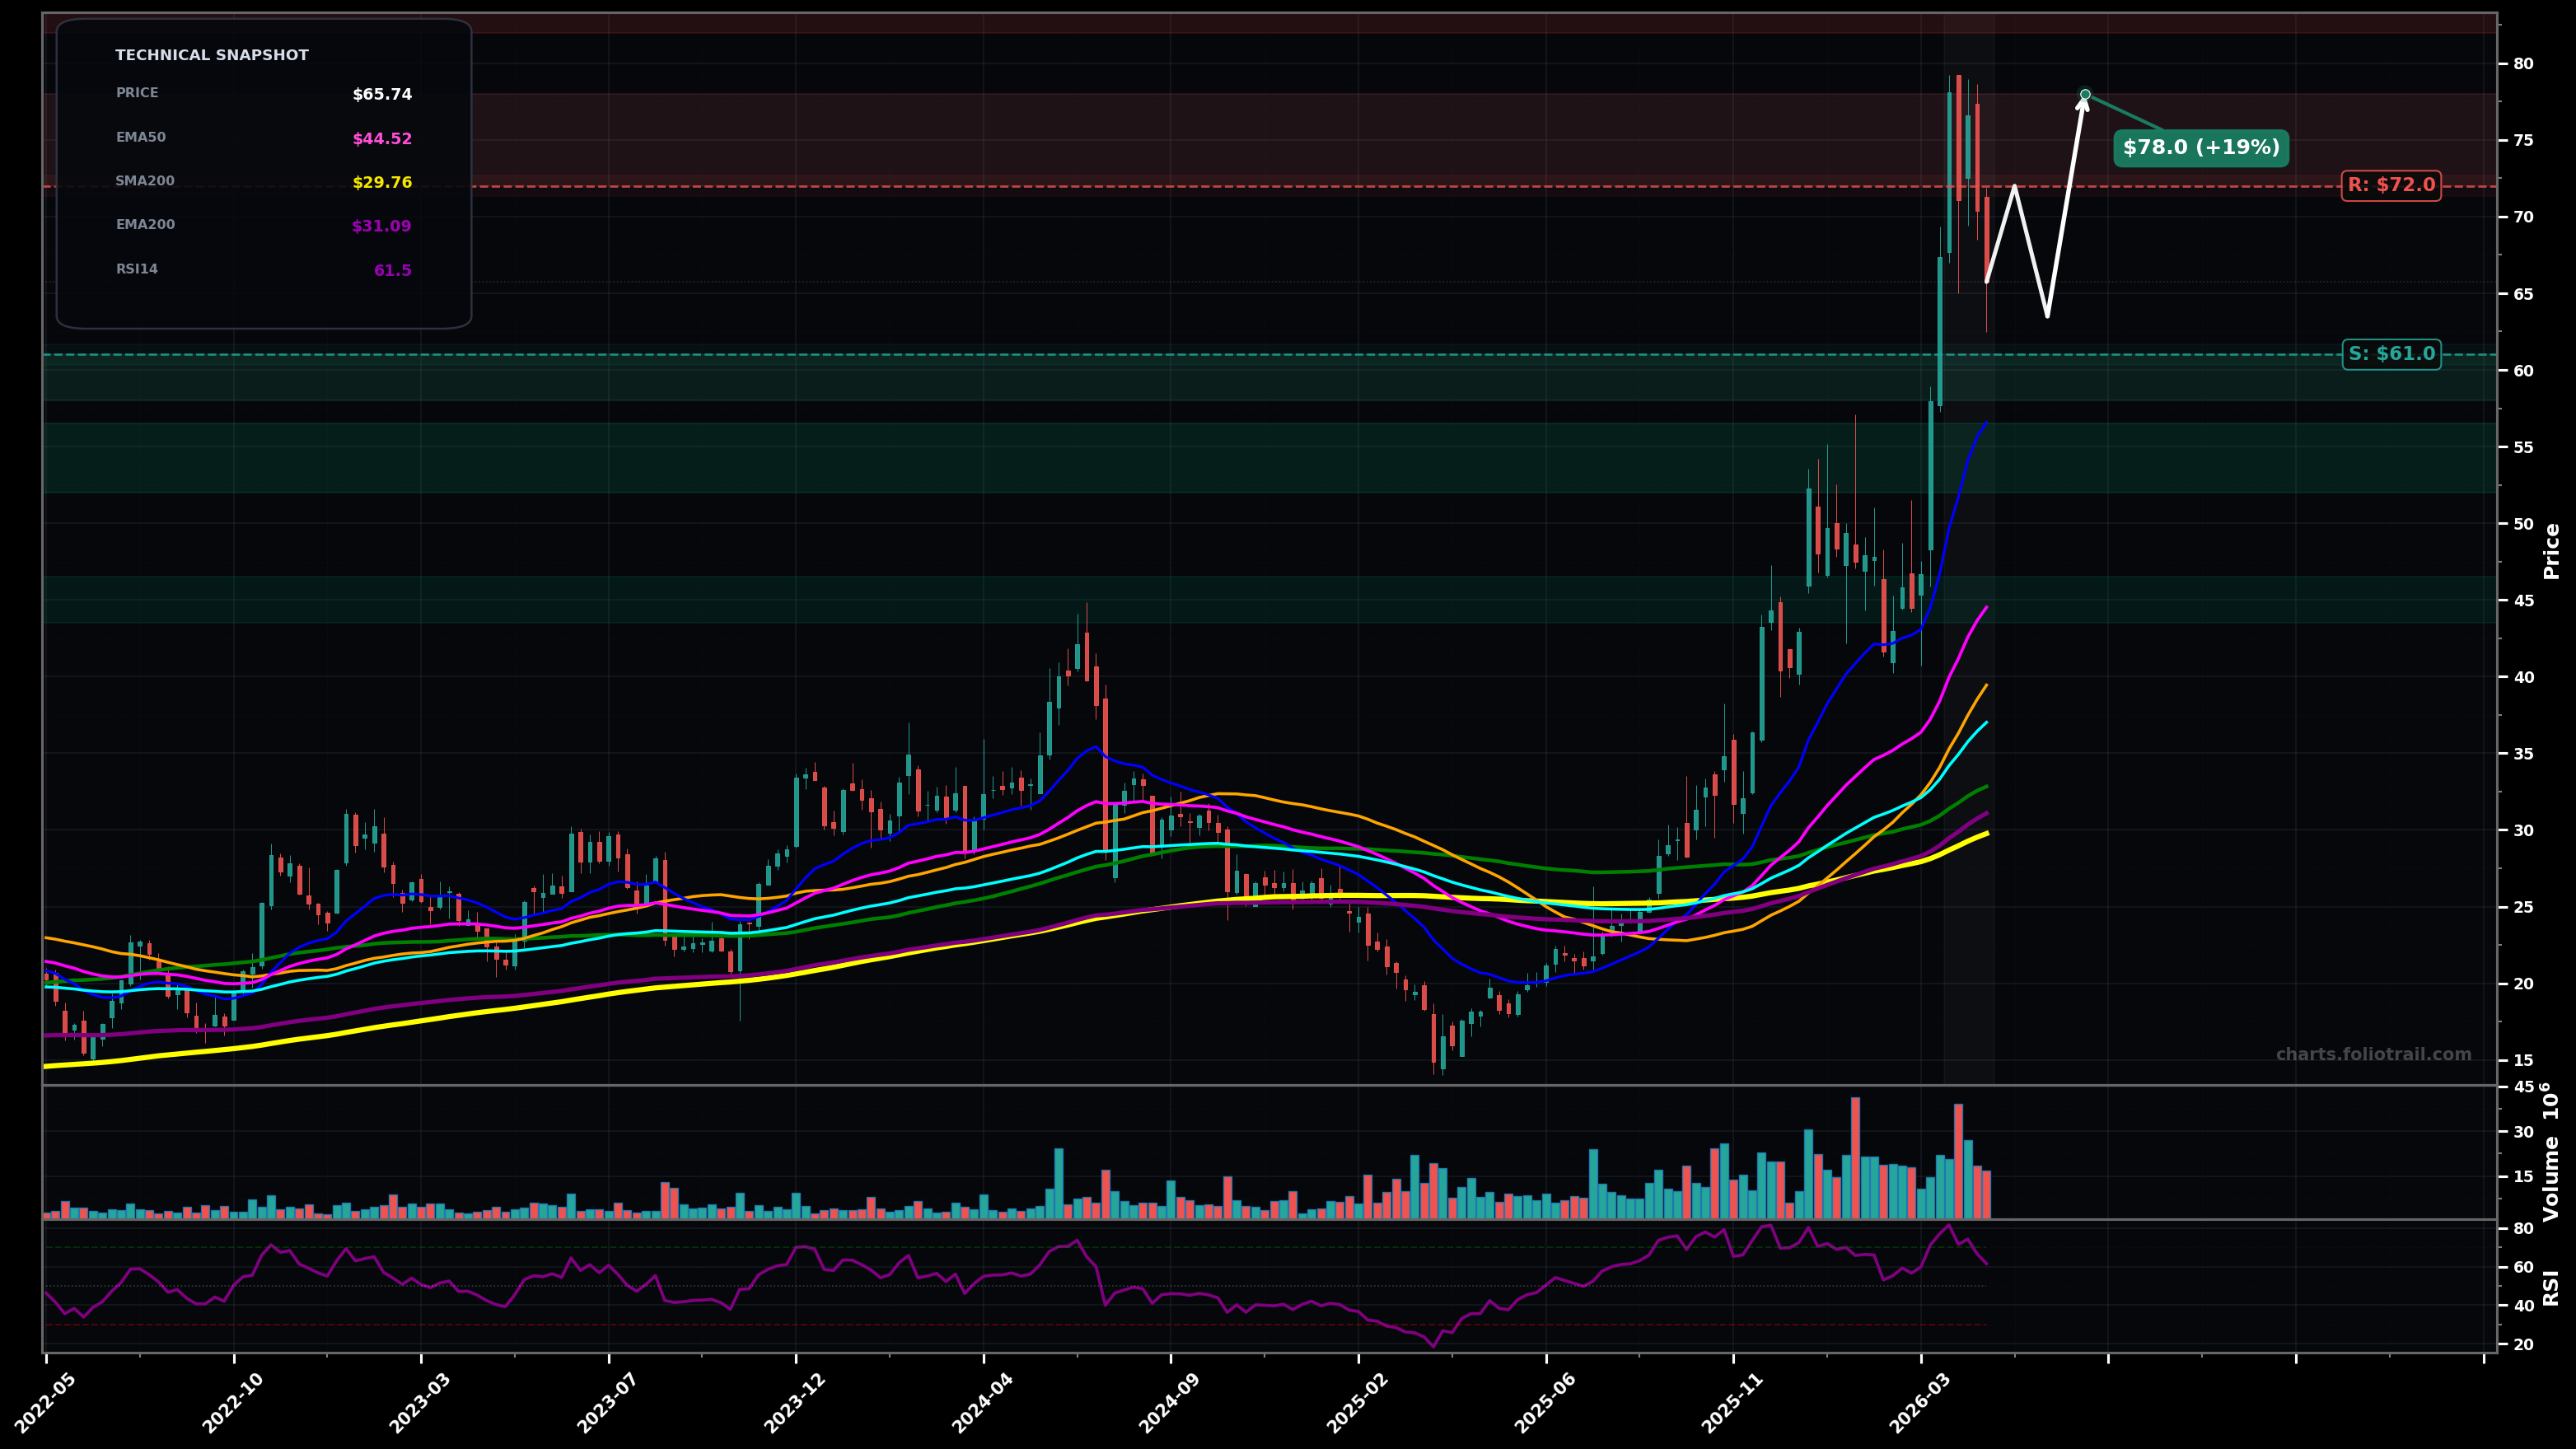
As of May 22, 2026, AMKR (Amkor Technology Inc.) is in a volatility expansion state on the weekly chart, with a confidence level of 72%. Key support is at $61.0 and key resistance at $72.0. After a vertical run to new highs (~$78), price pulled back to ~$65.74 with two heavy weekly red candles; still holding well above rising EMA50/EMA100.
Pullback forms a higher low above ~$61, then a bounce retests ~$72; if absorbed, price grinds back toward the prior high. This is consistent with a Wave 4 pullback after a strong Wave 3 advance, with Wave 5 attempt possible.
Deeper mean-reversion: breakdown below ~$61 triggers a move toward the next demand band near prior base/breakout and fib-style retrace zone; selling could seek the rising EMA20/EMA50 area over time.
Weekly close below $61.00 (loss of the recent swing support) would confirm volatility to the downside.
Weekly close back above $72.00 (reclaim of breakdown area) would invalidate the immediate bearish expansion bias.
Staggered entries around the current swing low support (~$61), then prior breakout/volume shelf (~$52–$56), with a deeper add near EMA50 weekly area (~$44–$46) if volatility expands down.
Trim into overhead supply/ATH retest ($72–$78); heavier trims if a Wave 5 extension pushes into new highs ($82+); fully exit if price becomes extremely stretched versus weekly EMA50/EMA100 with blow-off characteristics.
As of May 22, 2026, AMKR (Amkor Technology Inc.) is in a volatility expansion state on the weekly chart with 72% confidence. After a vertical run to new highs (~$78), price pulled back to ~$65.74 with two heavy weekly red candles; still holding well above rising EMA50/EMA100.
On the weekly timeframe, AMKR has key support at $61.0 and key resistance at $72.0. The most likely scenario (bullish) targets $72.0 and $78.0, with a revert level at $63.5.
AMKR (Amkor Technology Inc.) is currently classified as volatility expansion on the weekly chart, with 72% confidence. Confirmation requires: Weekly close below $61.00 (loss of the recent swing support) would confirm volatility to the downside. This would be invalidated by: Weekly close back above $72.00 (reclaim of breakdown area) would invalidate the immediate bearish expansion bias.
The most likely scenario (bullish) targets $72.0 and $78.0, with a revert level at $63.5. The alternative scenario (bearish) targets $56.5 and $45.0.
Multi-layer AI agents analyse 200+ stocks across daily, weekly, and monthly timeframes — producing market state classifications, price scenarios with targets, and position entry/exit levels. Daily charts updated every trading day at 6 PM ET. Weekly charts refresh Fridays. Monthly charts refresh on the last trading day of each month. No paywall. No sign-up required.
Built by Foliotrail.
All content on this website — including charts, analysis, price targets, support/resistance levels, and position zones — is generated entirely by AI and provided for educational and informational purposes only.
This is not financial advice. NEXUSNOIR VENTURES SL (the operator of this website) is not a registered investment adviser or broker-dealer. You should not make investment decisions based solely on this information. Always do your own research and consult a qualified financial advisor.
By continuing, you acknowledge that you have read and agree to our full disclaimer & terms of use and privacy policy.