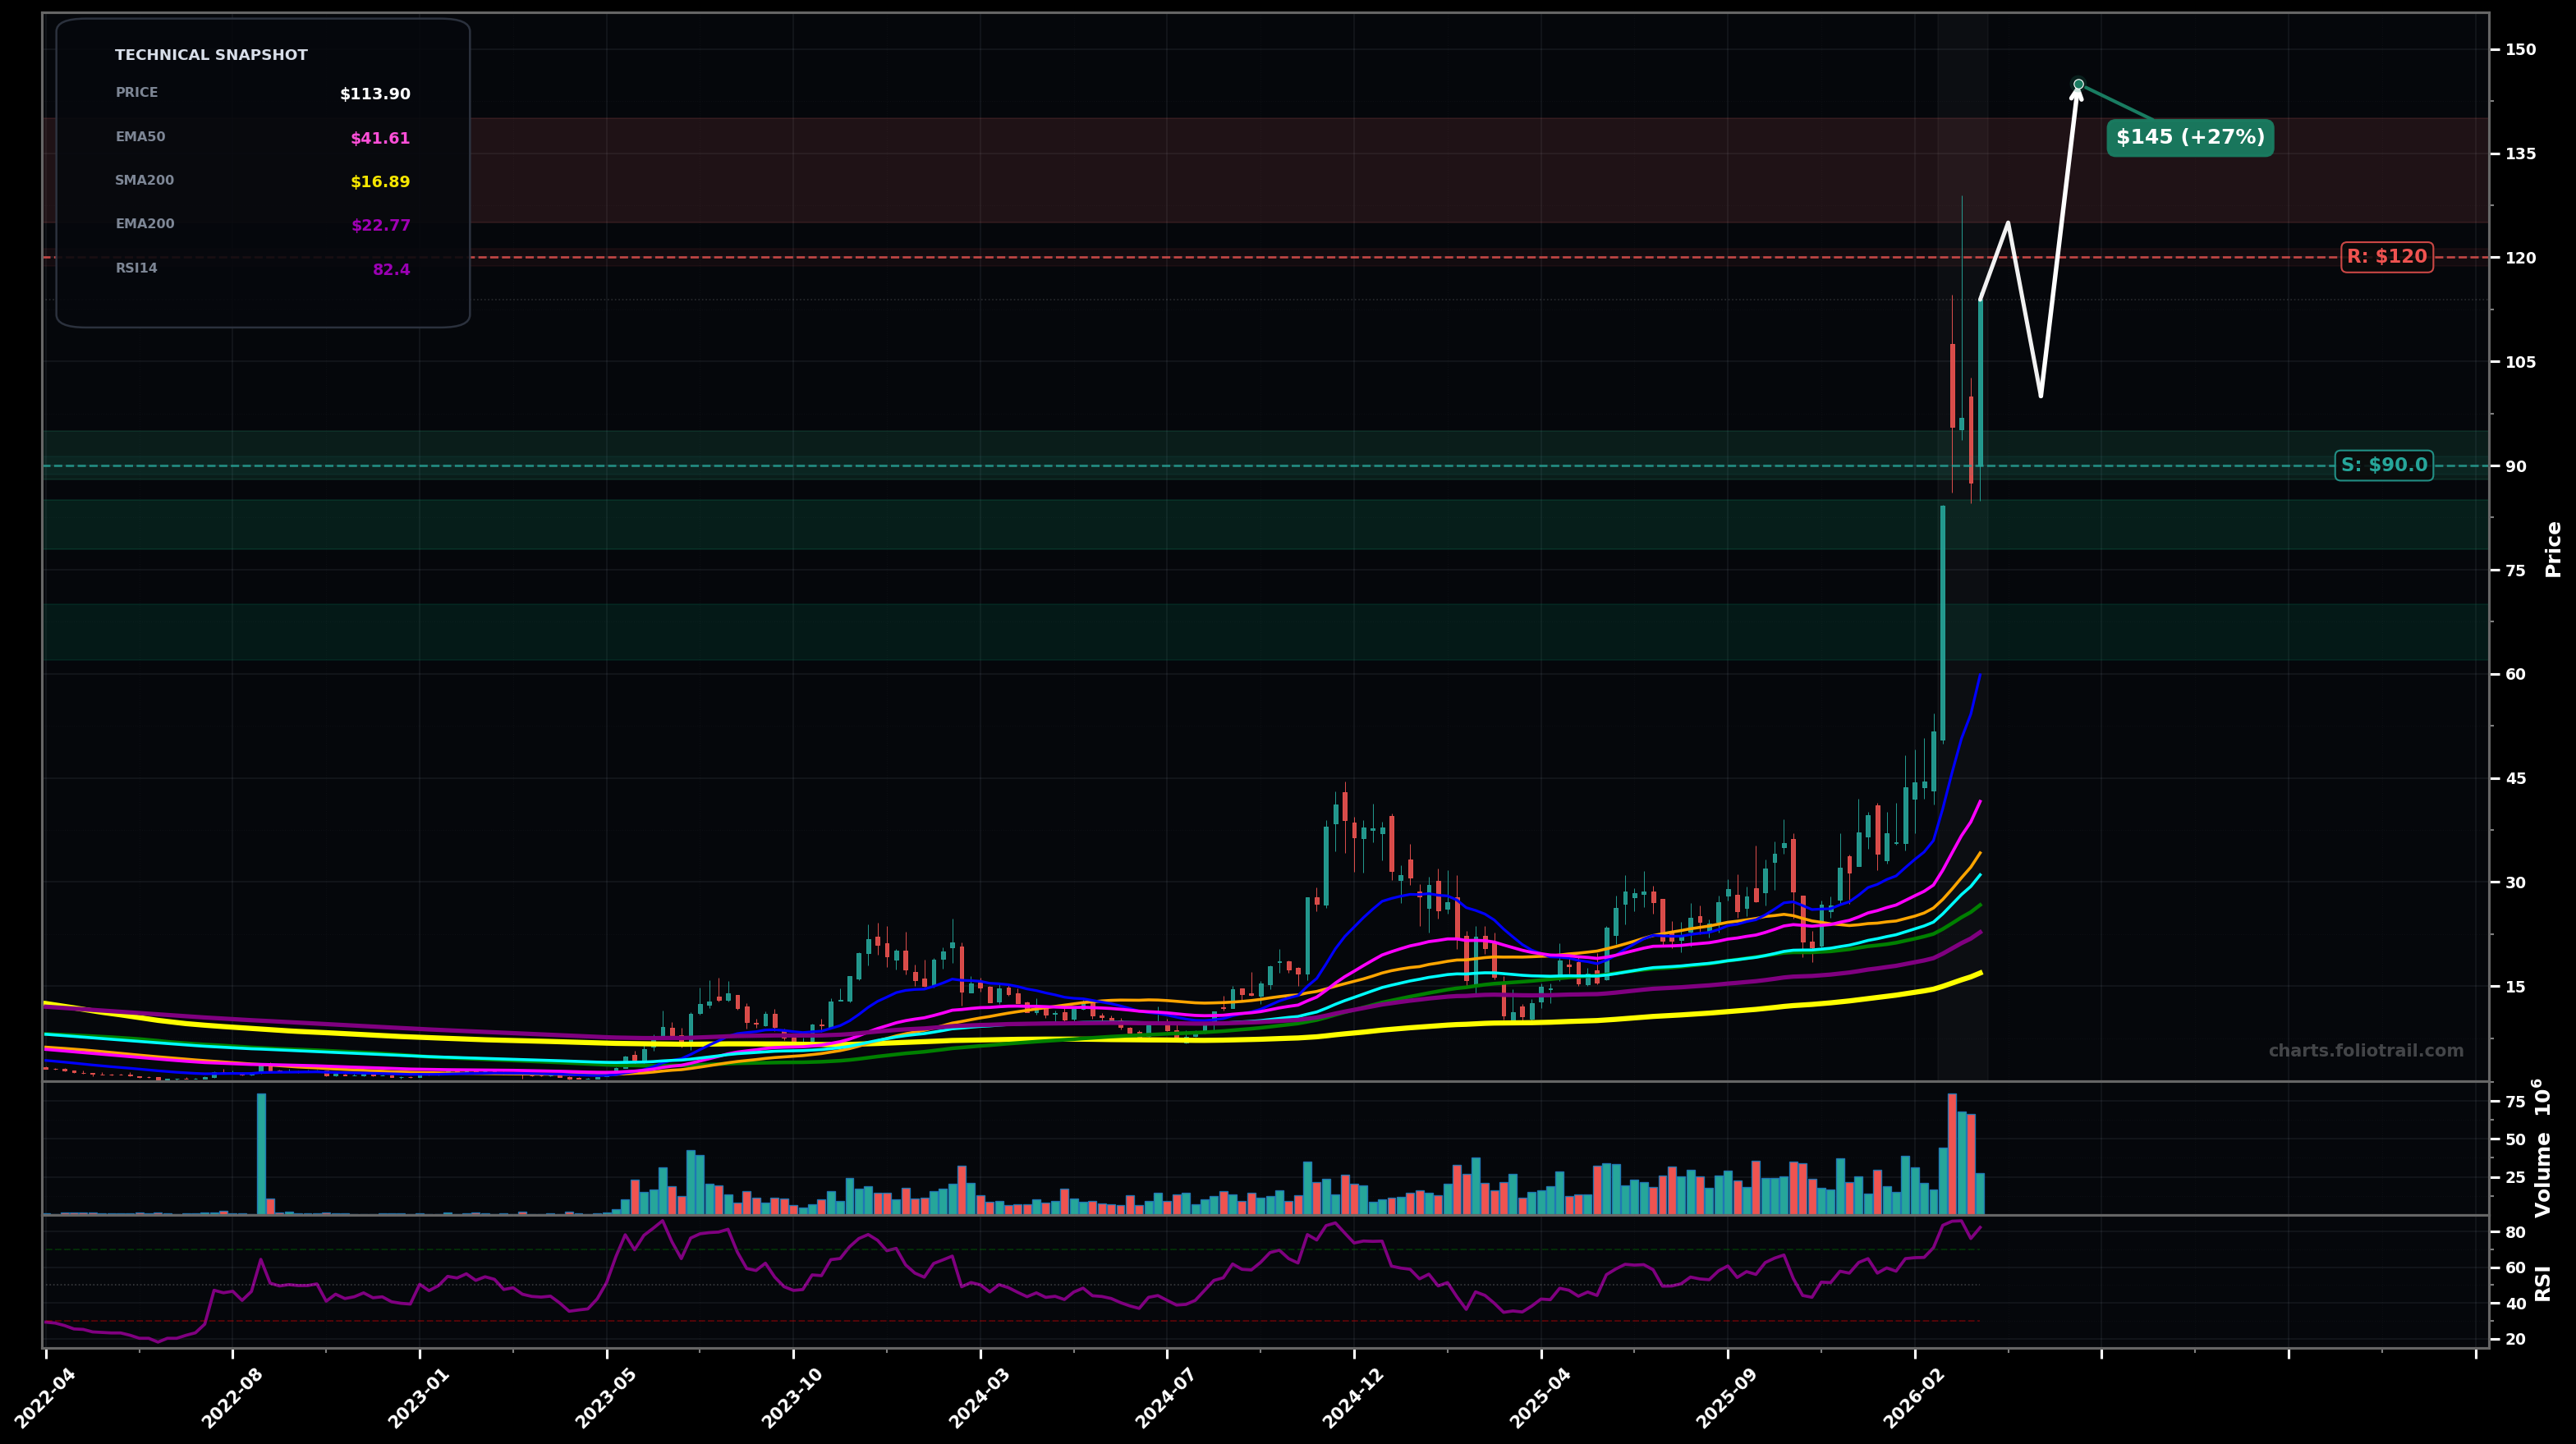
As of May 22, 2026, AAOI (Applied Optoelectronics, Inc.) is in a parabolic state on the weekly chart, with a confidence level of 82%. Key support is at $150 and key resistance at $200. AAOI weekly is in a sharp, accelerating markup with wide-range candles and heavy volume; last weeks show a volatility spike near the highs with RSI ~73 (extended).
Mean-reversion pullback/consolidation (wave 4 type) toward the breakout zone, then attempt to resume the uptrend; expect choppy swings as volatility cools.
Blow-off continuation (wave 5 extension) with a quick push through psychological resistance before a later sharp pullback.
2 weekly closes above $190 would confirm ongoing parabolic continuation
Weekly close below $150 would invalidate the parabolic continuation and signal a deeper mean-reversion phase
Buy-the-dip only: zones align with prior breakout/weekly pivot support and mean-reversion toward EMA20 (~$116.79) after a parabolic stretch.
Trim into strength at psychological/extension levels (likely wave-5/overextension); higher bands assume continued multiple expansion before a major cycle reset.
As of May 22, 2026, AAOI (Applied Optoelectronics, Inc.) is in a parabolic state on the weekly chart with 82% confidence. AAOI weekly is in a sharp, accelerating markup with wide-range candles and heavy volume; last weeks show a volatility spike near the highs with RSI ~73 (extended).
On the weekly timeframe, AAOI has key support at $150 and key resistance at $200. The most likely scenario (bearish) targets $150 and $125, with a revert level at $175.
AAOI (Applied Optoelectronics, Inc.) is currently classified as parabolic on the weekly chart, with 82% confidence. Confirmation requires: 2 weekly closes above $190 would confirm ongoing parabolic continuation This would be invalidated by: Weekly close below $150 would invalidate the parabolic continuation and signal a deeper mean-reversion phase
The most likely scenario (bearish) targets $150 and $125, with a revert level at $175. The alternative scenario (bullish) targets $200 and $220.
Multi-layer AI agents analyse 200+ stocks across daily, weekly, and monthly timeframes — producing market state classifications, price scenarios with targets, and position entry/exit levels. Daily charts updated every trading day at 6 PM ET. Weekly charts refresh Fridays. Monthly charts refresh on the last trading day of each month. No paywall. No sign-up required.
Built by Foliotrail.
All content on this website — including charts, analysis, price targets, support/resistance levels, and position zones — is generated entirely by AI and provided for educational and informational purposes only.
This is not financial advice. NEXUSNOIR VENTURES SL (the operator of this website) is not a registered investment adviser or broker-dealer. You should not make investment decisions based solely on this information. Always do your own research and consult a qualified financial advisor.
By continuing, you acknowledge that you have read and agree to our full disclaimer & terms of use and privacy policy.