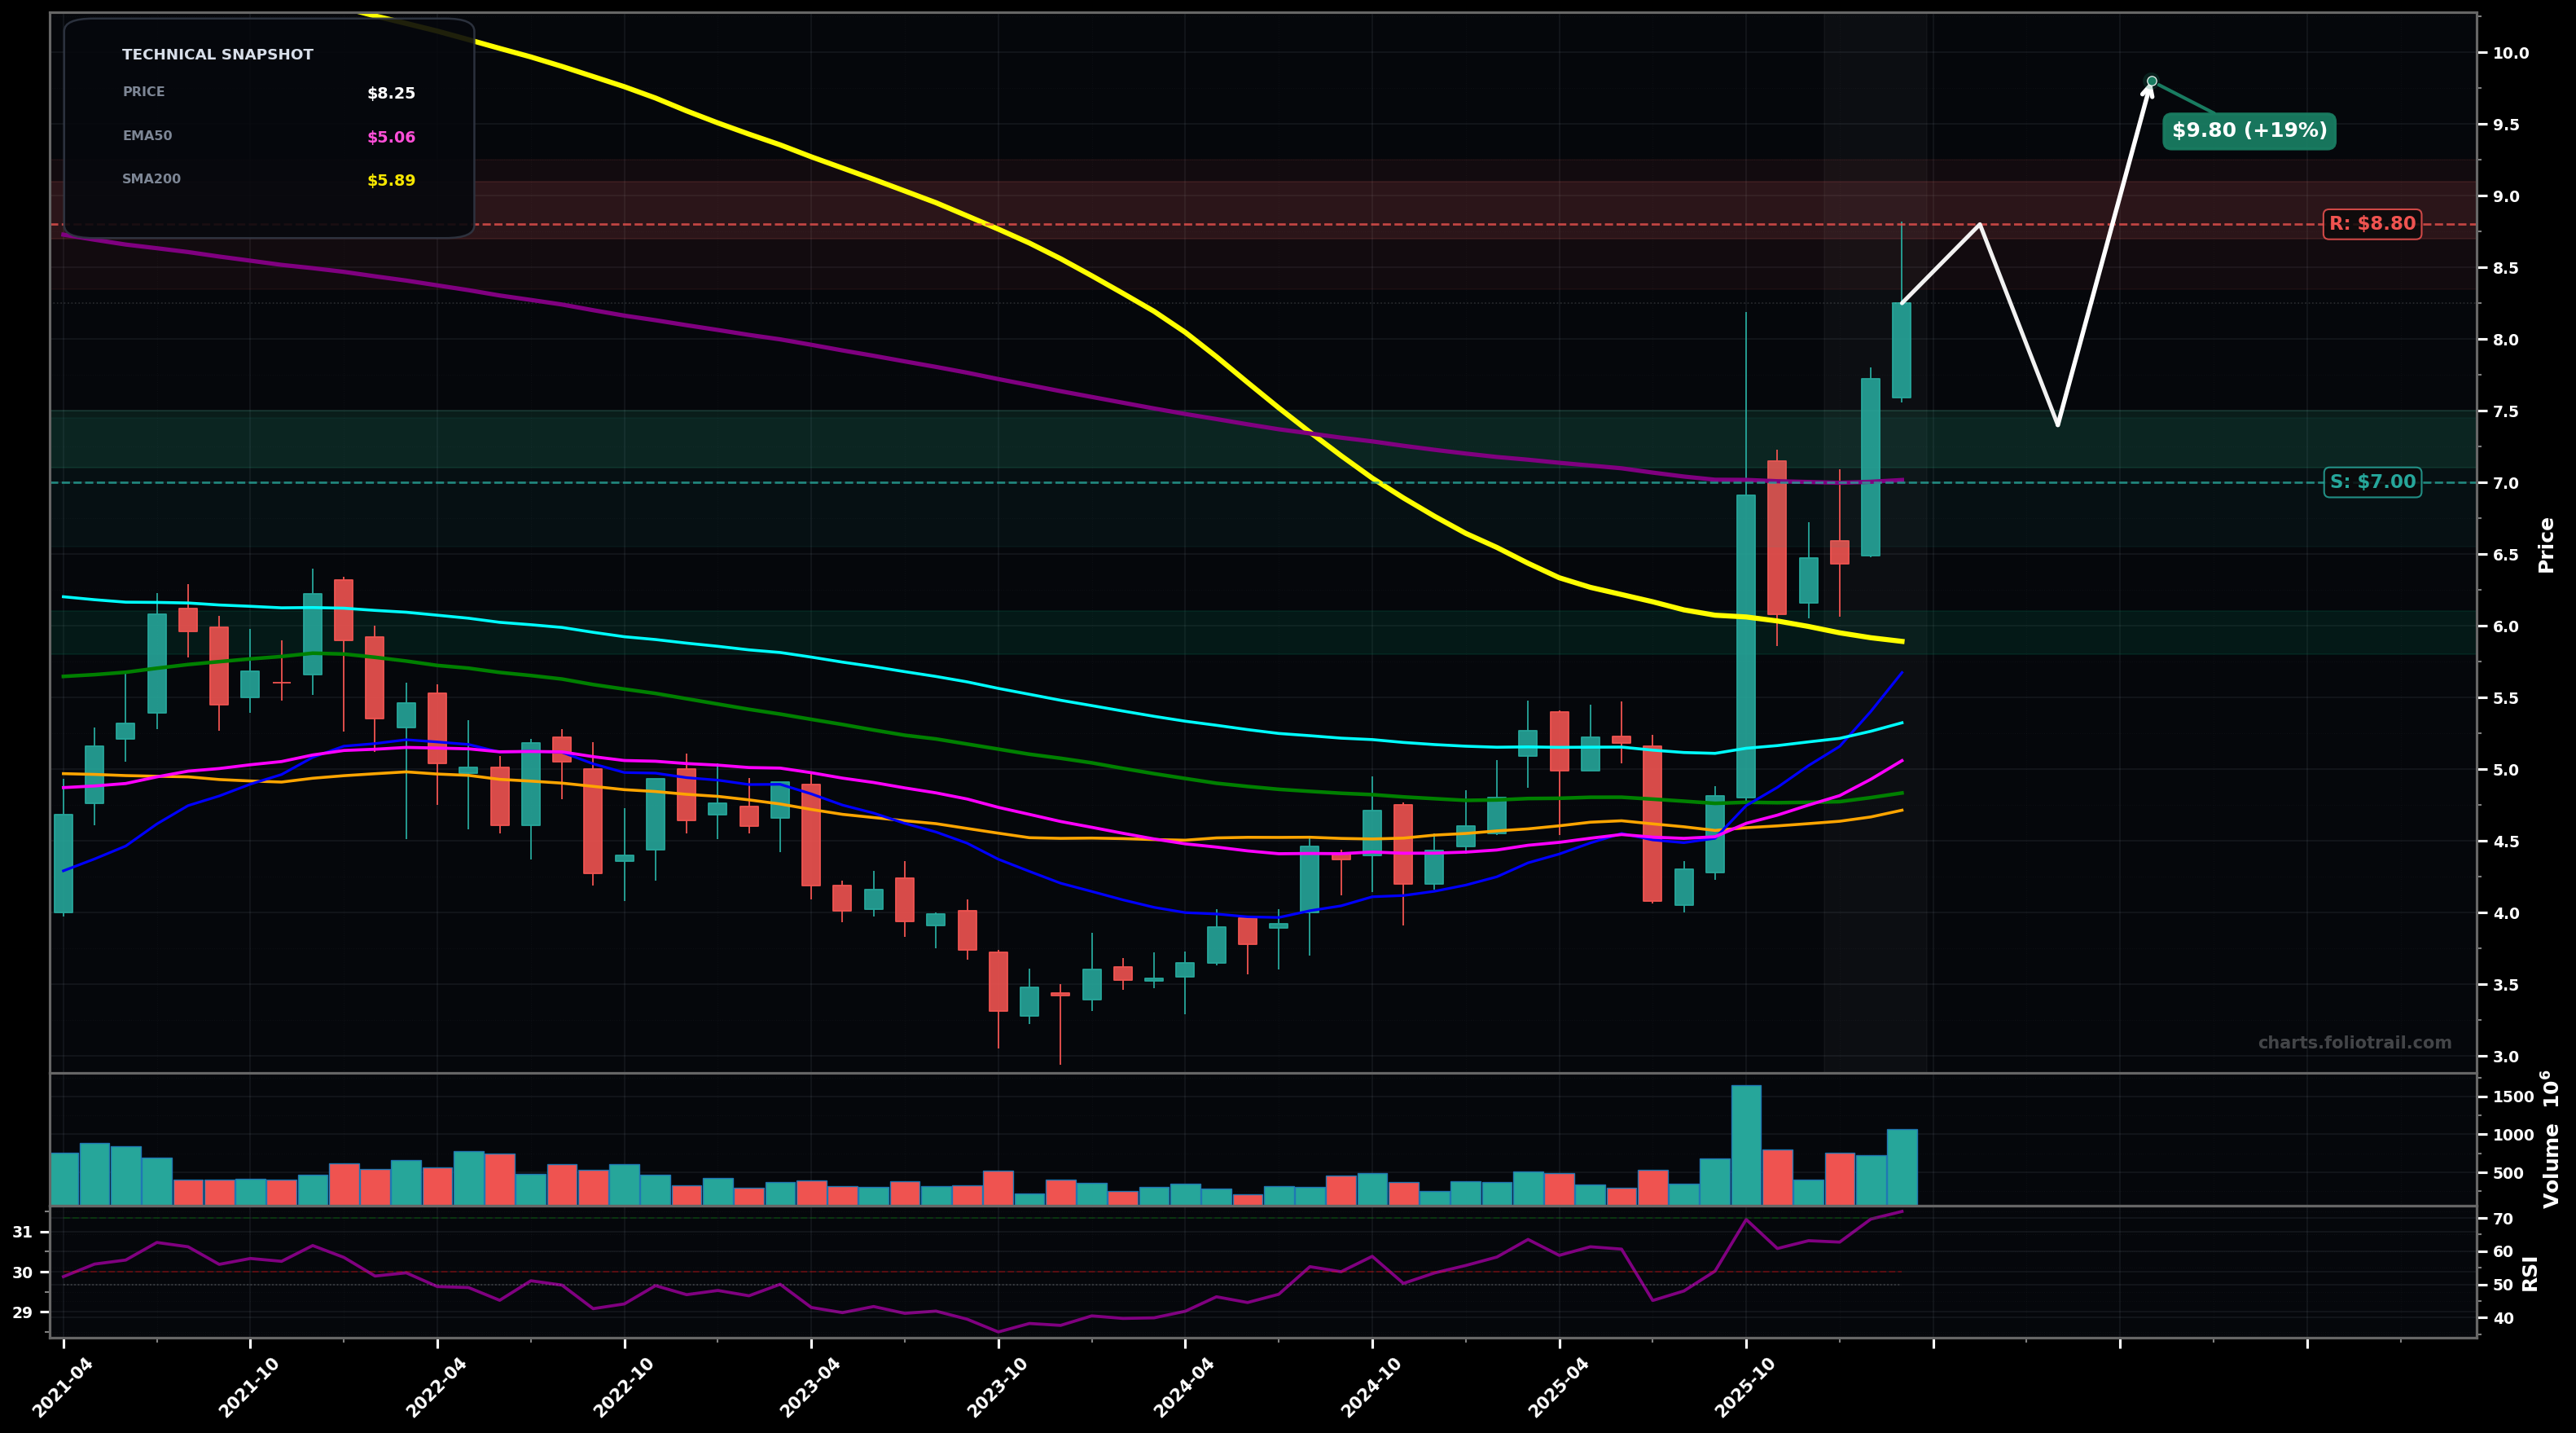
As of June 03, 2026, NOK (Nokia Corporation Sponsored ADR) is in a parabolic state on the monthly chart, with a confidence level of 83%. Key support is at $15.0 and key resistance at $17.0. Monthly vertical breakout with consecutive wide green candles and volume expansion; price at ~$16.71 far above all key MAs; RSI ~88 (extremely overbought).
Most likely: sharp mean-reversion pullback/consolidation after a blow-off leg, then attempt to rebase above the breakout area before any renewed push higher (Elliott: finishing Wave 3 or extended Wave 5; next is Wave 4 type correction).
Second: momentum persists (parabolic continuation) with a final squeeze higher, then a larger correction later (Elliott: extension where Wave 5 keeps running).
Monthly close above $17.00 followed by another higher close (hold above $15.00 on any pullback).
Monthly close below $12.50 (loss of the breakout shelf; likely deeper mean reversion).
Prefer buying on mean-reversion toward the breakout shelf ($13-$15) and deeper Fib-style retraces of the impulse ($10-$12.5), with heavy adds only near prior multi-month resistance/MA cluster zone ($8-$9.5).
With RSI/price extremely stretched above EMA50/100/200, trimming into further vertical extensions is prudent; higher zones assume an extended Elliott blow-off where risk/reward turns asymmetrically negative.
As of June 03, 2026, NOK (Nokia Corporation Sponsored ADR) is in a parabolic state on the monthly chart with 83% confidence. Monthly vertical breakout with consecutive wide green candles and volume expansion; price at ~$16.71 far above all key MAs; RSI ~88 (extremely overbought).
On the monthly timeframe, NOK has key support at $15.0 and key resistance at $17.0. The most likely scenario (bearish) targets $13.0 and $10.5, with a revert level at $15.5.
NOK (Nokia Corporation Sponsored ADR) is currently classified as parabolic on the monthly chart, with 83% confidence. Confirmation requires: Monthly close above $17.00 followed by another higher close (hold above $15.00 on any pullback). This would be invalidated by: Monthly close below $12.50 (loss of the breakout shelf; likely deeper mean reversion).
The most likely scenario (bearish) targets $13.0 and $10.5, with a revert level at $15.5. The alternative scenario (bullish) targets $19.5 and $22.0.
Multi-layer AI agents analyse 200+ stocks across daily, weekly, and monthly timeframes — producing market state classifications, price scenarios with targets, and position entry/exit levels. Daily charts updated every trading day at 6 PM ET. Weekly charts refresh Fridays. Monthly charts refresh on the last trading day of each month. No paywall. No sign-up required.
Built by Foliotrail.
All content on this website — including charts, analysis, price targets, support/resistance levels, and position zones — is generated entirely by AI and provided for educational and informational purposes only.
This is not financial advice. NEXUSNOIR VENTURES SL (the operator of this website) is not a registered investment adviser or broker-dealer. You should not make investment decisions based solely on this information. Always do your own research and consult a qualified financial advisor.
By continuing, you acknowledge that you have read and agree to our full disclaimer & terms of use and privacy policy.