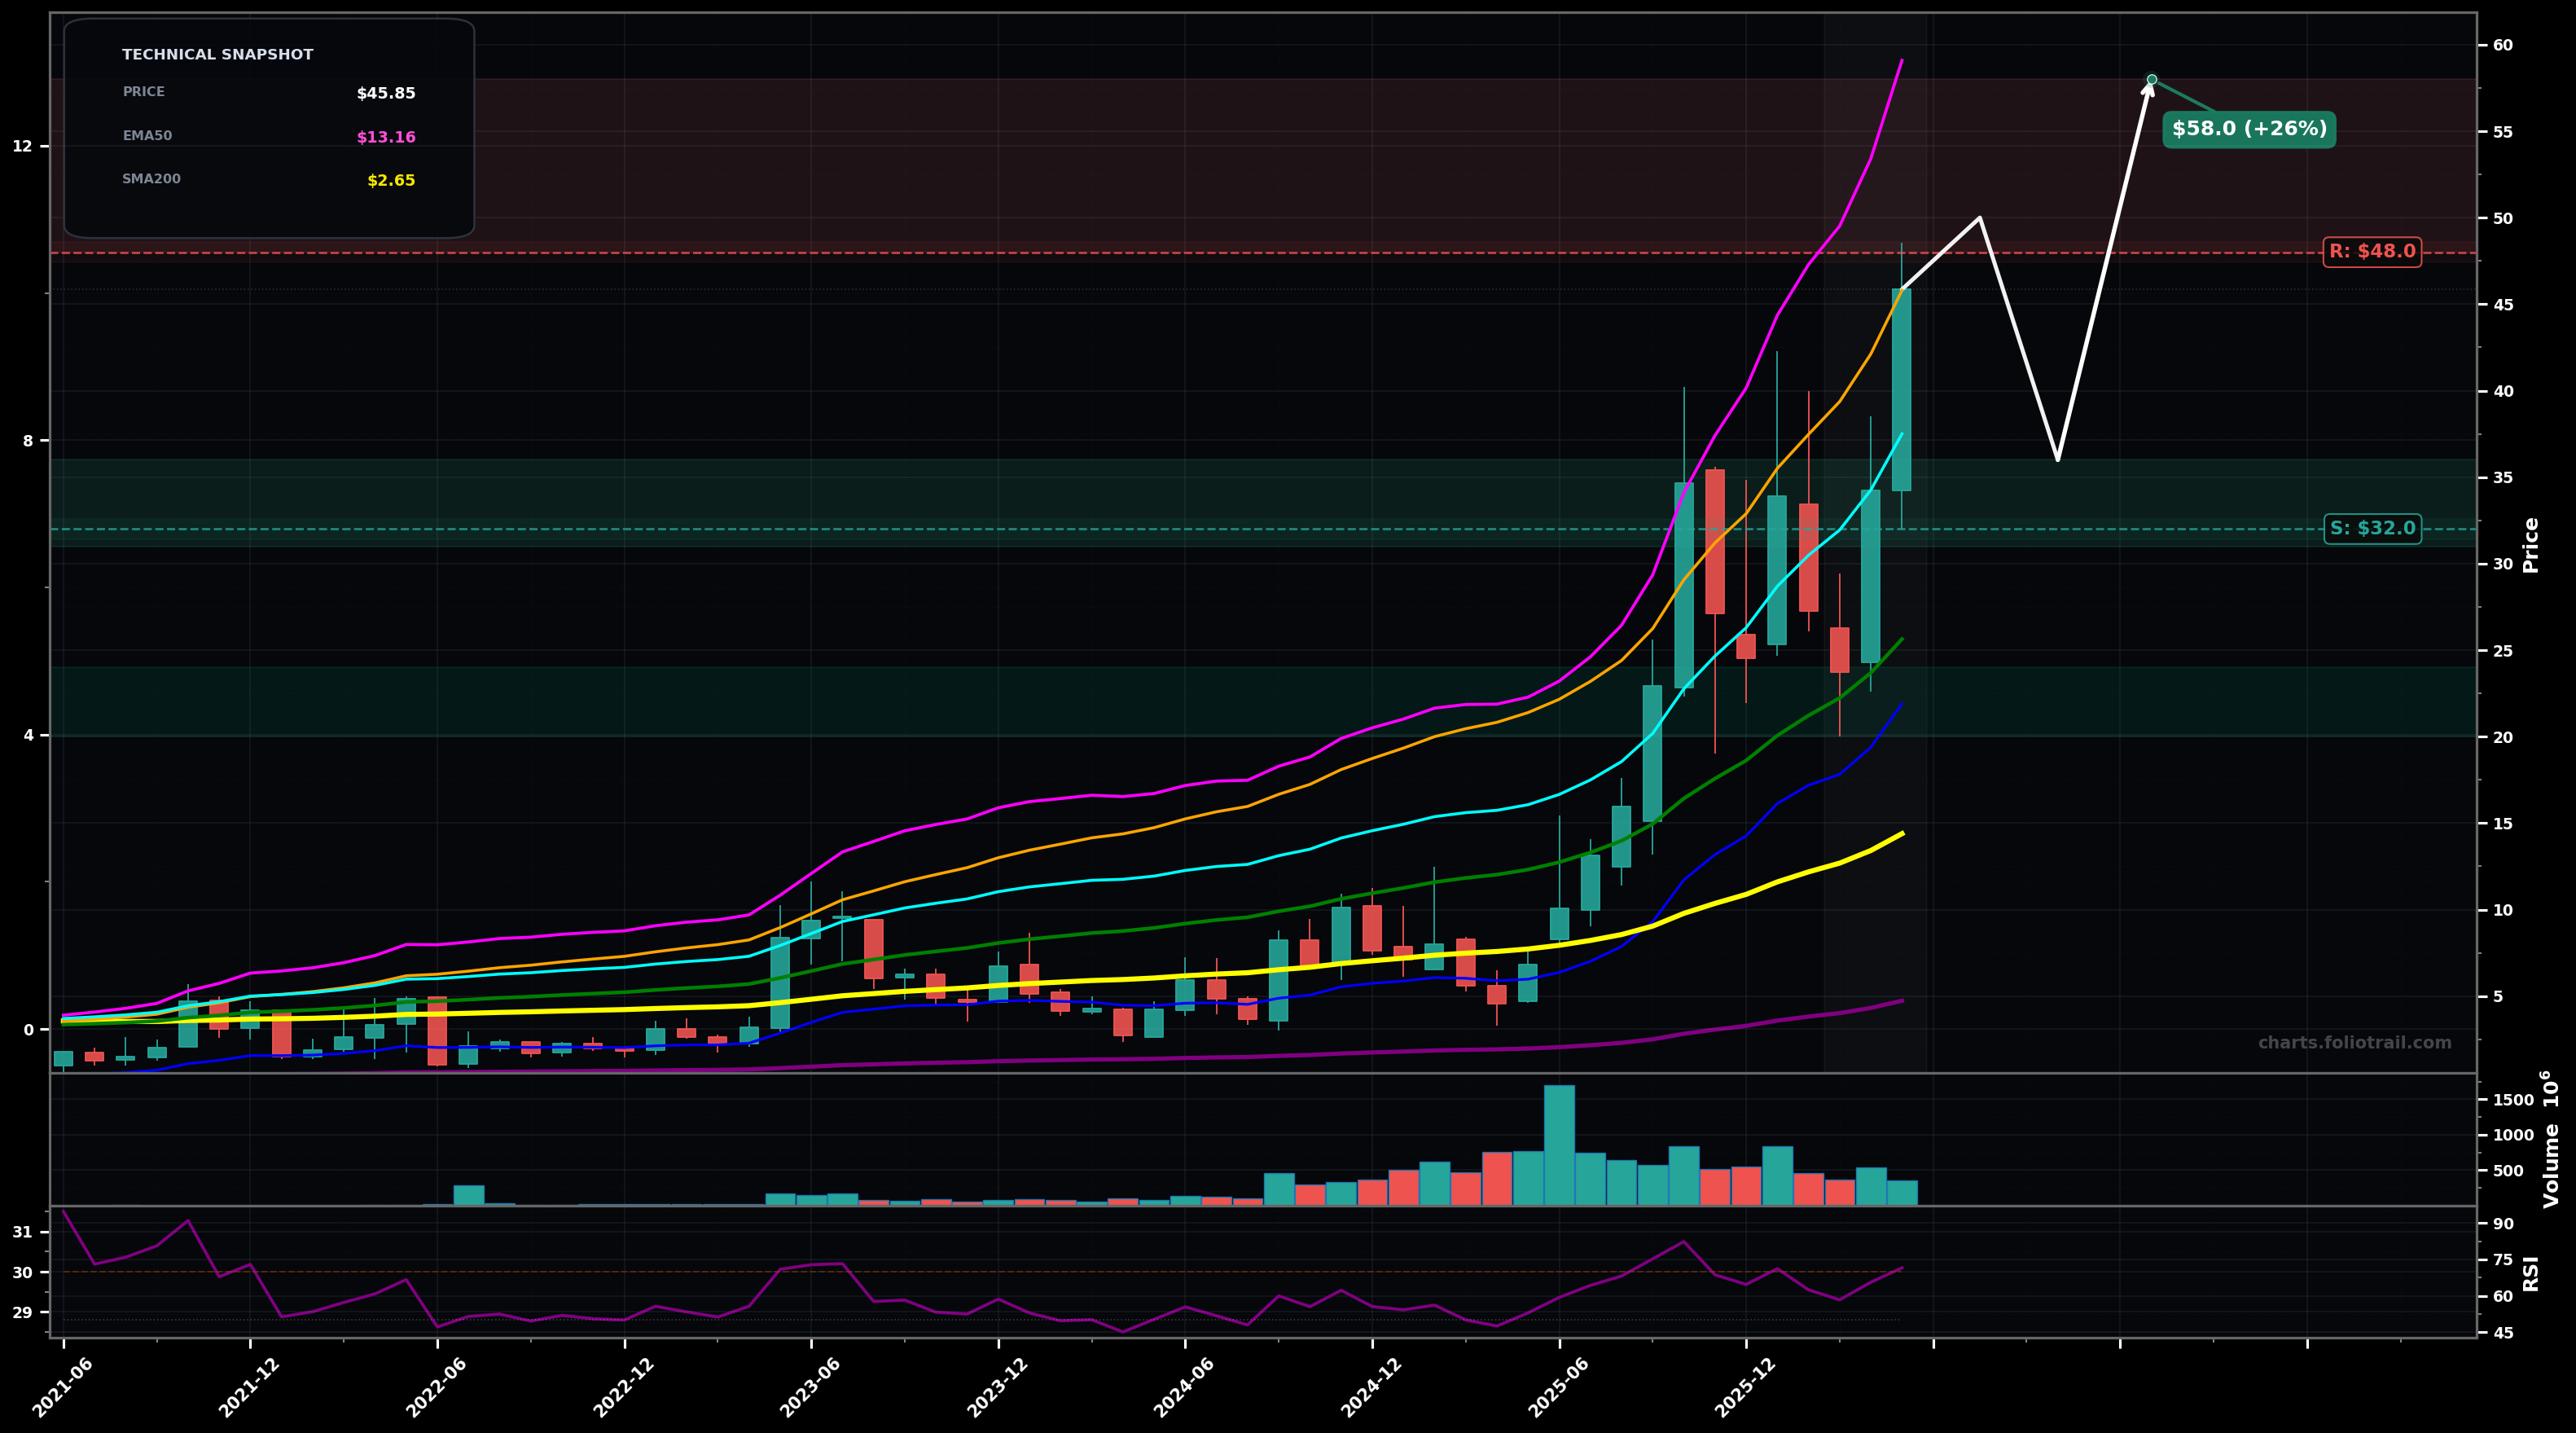
As of May 22, 2026, APLD (Applied Digital Corporation) is in a parabolic state on the monthly chart, with a confidence level of 72%. Key support is at $32.0 and key resistance at $48.0. Monthly impulsive breakout to new highs with strong green close; price extended far above rising EMA50/EMA100 and above all SMAs; RSI ~71 (overbought/strong momentum).
Bullish continuation after a brief consolidation: price digests gains above the prior breakout shelf (~$32–$36) and then pushes to a new extension leg (Elliott: late Wave 3 / early Wave 5 behavior; Fib extension from the ~$4 base projects into mid-$50s).
Mean-reversion pullback: parabolic leg cools into a deeper retrace toward the fast MAs; still constructive if it forms a higher low (Elliott: Wave 4-type correction; Fib retrace of the last impulse often tests ~38.2%–50%).
Monthly close above $48.00 with no immediate reversal (next month holding >$44.00).
Monthly close below $32.00 (loss of the last breakout shelf/EMA20 area).
Buy-staging around the breakout shelf/EMA20 region first, then deeper adds near likely Fib retrace + prior structure, with heavy adds closer to EMA50 (pink) zone where trend support is strongest on this chart.
Given parabolic extension and RSI>70, trim into strength near round-number/extension zones; progressively de-risk on further vertical extension and fully exit if price overshoots into extreme multi-year stretch bands.
As of May 22, 2026, APLD (Applied Digital Corporation) is in a parabolic state on the monthly chart with 72% confidence. Monthly impulsive breakout to new highs with strong green close; price extended far above rising EMA50/EMA100 and above all SMAs; RSI ~71 (overbought/strong momentum).
On the monthly timeframe, APLD has key support at $32.0 and key resistance at $48.0. The most likely scenario (bullish) targets $50.0 and $58.0, with a revert level at $36.0.
APLD (Applied Digital Corporation) is currently classified as parabolic on the monthly chart, with 72% confidence. Confirmation requires: Monthly close above $48.00 with no immediate reversal (next month holding >$44.00). This would be invalidated by: Monthly close below $32.00 (loss of the last breakout shelf/EMA20 area).
The most likely scenario (bullish) targets $50.0 and $58.0, with a revert level at $36.0. The alternative scenario (bearish) targets $28.0 and $22.0.
Multi-layer AI agents analyse 200+ stocks across daily, weekly, and monthly timeframes — producing market state classifications, price scenarios with targets, and position entry/exit levels. Daily charts updated every trading day at 6 PM ET. Weekly charts refresh Fridays. Monthly charts refresh on the last trading day of each month. No paywall. No sign-up required.
Built by Foliotrail.
All content on this website — including charts, analysis, price targets, support/resistance levels, and position zones — is generated entirely by AI and provided for educational and informational purposes only.
This is not financial advice. NEXUSNOIR VENTURES SL (the operator of this website) is not a registered investment adviser or broker-dealer. You should not make investment decisions based solely on this information. Always do your own research and consult a qualified financial advisor.
By continuing, you acknowledge that you have read and agree to our full disclaimer & terms of use and privacy policy.