As of May 22, 2026, AAOI (Applied Optoelectronics, Inc.) is in a parabolic state on the monthly chart, with a confidence level of 78%. Key support is at $150 and key resistance at $200. Vertical monthly breakout to ~$181.42 with extreme RSI (~89) and massive volume; price is far above all key MAs (EMA50/100/200 and SMA50/100/200) with a long upper wick on the latest bar (profit-taking risk).
Controlled digestion: price chops/pulls back to retest the breakout area (around prior highs) then makes a final push higher (late Elliott impulse extension), but with higher risk of sharp wicks.
Blow-off top / mean-reversion: a failed follow-through after the spike leads to a fast drop toward the last clean monthly pivot and moving-average magnet zones; this would fit an Elliott Wave completion of wave (5) and start of an ABC correction.
Monthly close above ~$185 (and holding above ~$160 on any intra-month pullback) keeps the parabolic advance intact.
Monthly close below ~$150 would signal a parabolic failure and likely deeper mean-reversion.
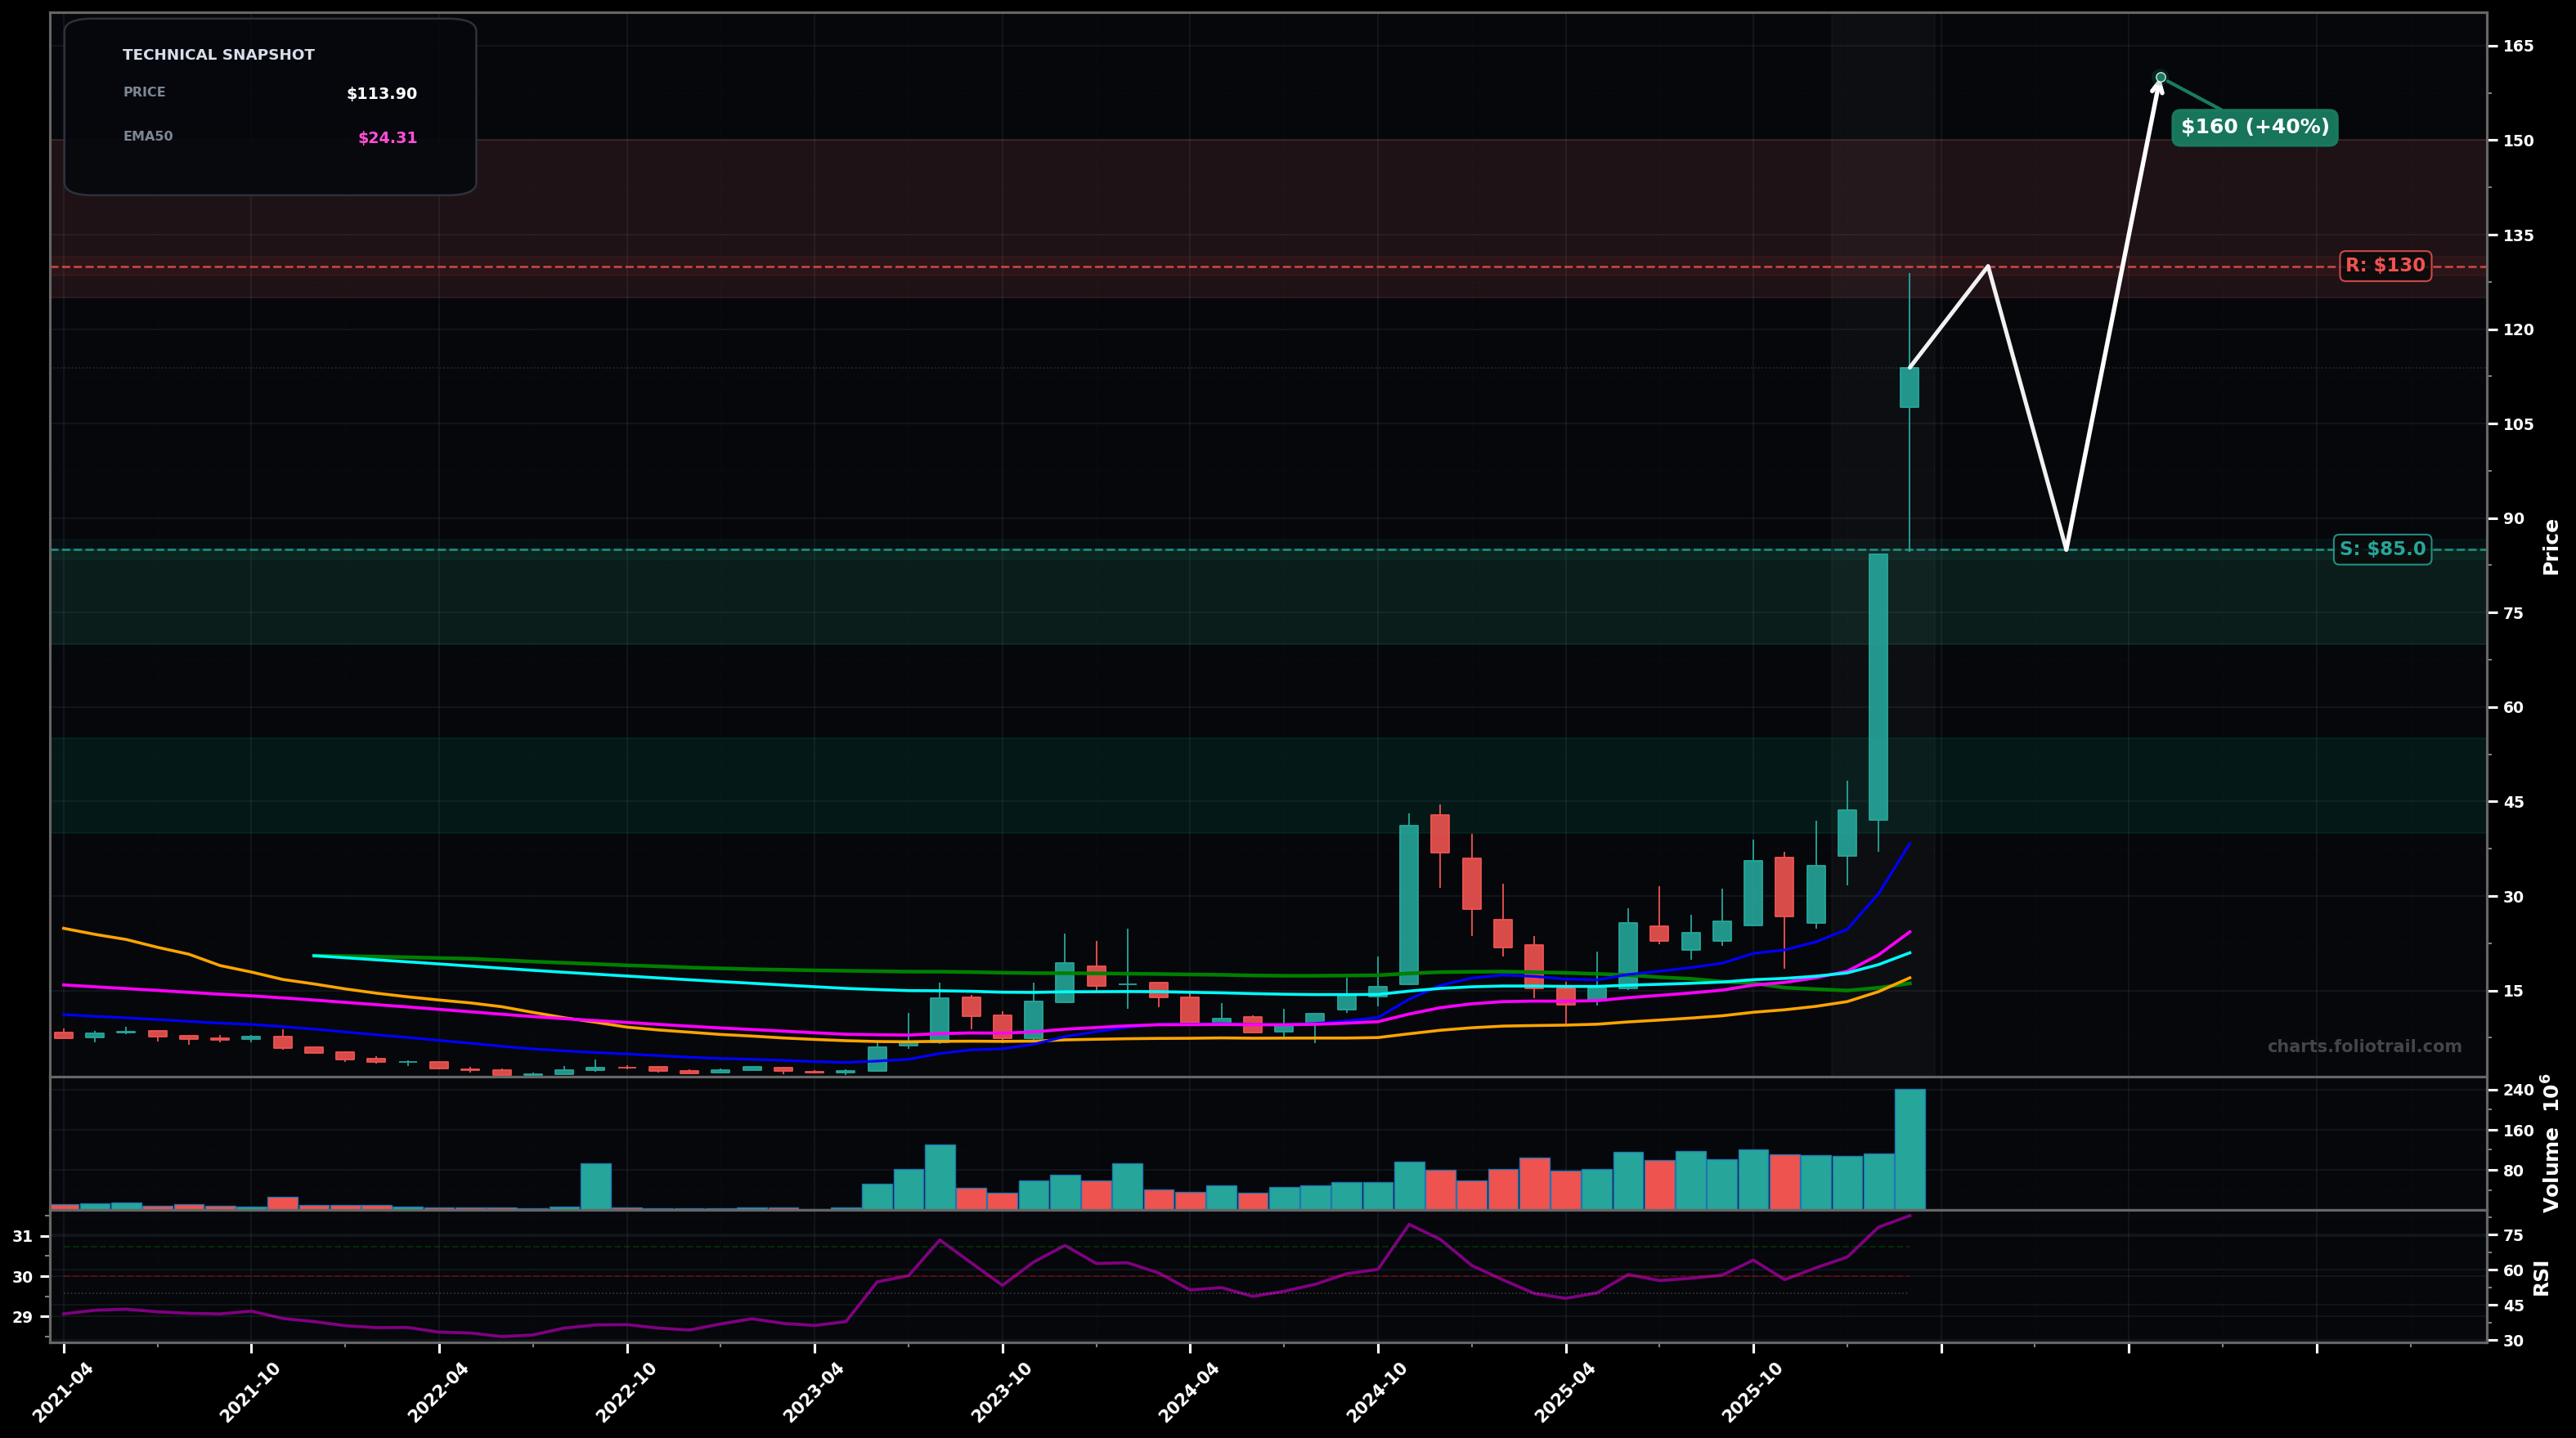
Buy zones are mapped to the most recent breakout retest ($150-$160), then deeper Fib-style retrace/last consolidation ($130-$145), with heavy adds only if a larger ABC correction tags the prior impulse base region ($90-$110).
Trims escalate into psychological extension levels above $200 while RSI/volatility are extreme; full exit reserved for a multi-year overshoot scenario where price becomes far detached from long MAs and prior structure.
As of May 22, 2026, AAOI (Applied Optoelectronics, Inc.) is in a parabolic state on the monthly chart with 78% confidence. Vertical monthly breakout to ~$181.42 with extreme RSI (~89) and massive volume; price is far above all key MAs (EMA50/100/200 and SMA50/100/200) with a long upper wick on the latest bar (profit-taking risk).
On the monthly timeframe, AAOI has key support at $150 and key resistance at $200. The most likely scenario (bullish) targets $200 and $230, with a revert level at $160.
AAOI (Applied Optoelectronics, Inc.) is currently classified as parabolic on the monthly chart, with 78% confidence. Confirmation requires: Monthly close above ~$185 (and holding above ~$160 on any intra-month pullback) keeps the parabolic advance intact. This would be invalidated by: Monthly close below ~$150 would signal a parabolic failure and likely deeper mean-reversion.
The most likely scenario (bullish) targets $200 and $230, with a revert level at $160. The alternative scenario (bearish) targets $130 and $90.0.
Multi-layer AI agents analyse 200+ stocks across daily, weekly, and monthly timeframes — producing market state classifications, price scenarios with targets, and position entry/exit levels. Daily charts updated every trading day at 6 PM ET. Weekly charts refresh Fridays. Monthly charts refresh on the last trading day of each month. No paywall. No sign-up required.
Built by Foliotrail.
All content on this website — including charts, analysis, price targets, support/resistance levels, and position zones — is generated entirely by AI and provided for educational and informational purposes only.
This is not financial advice. NEXUSNOIR VENTURES SL (the operator of this website) is not a registered investment adviser or broker-dealer. You should not make investment decisions based solely on this information. Always do your own research and consult a qualified financial advisor.
By continuing, you acknowledge that you have read and agree to our full disclaimer & terms of use and privacy policy.