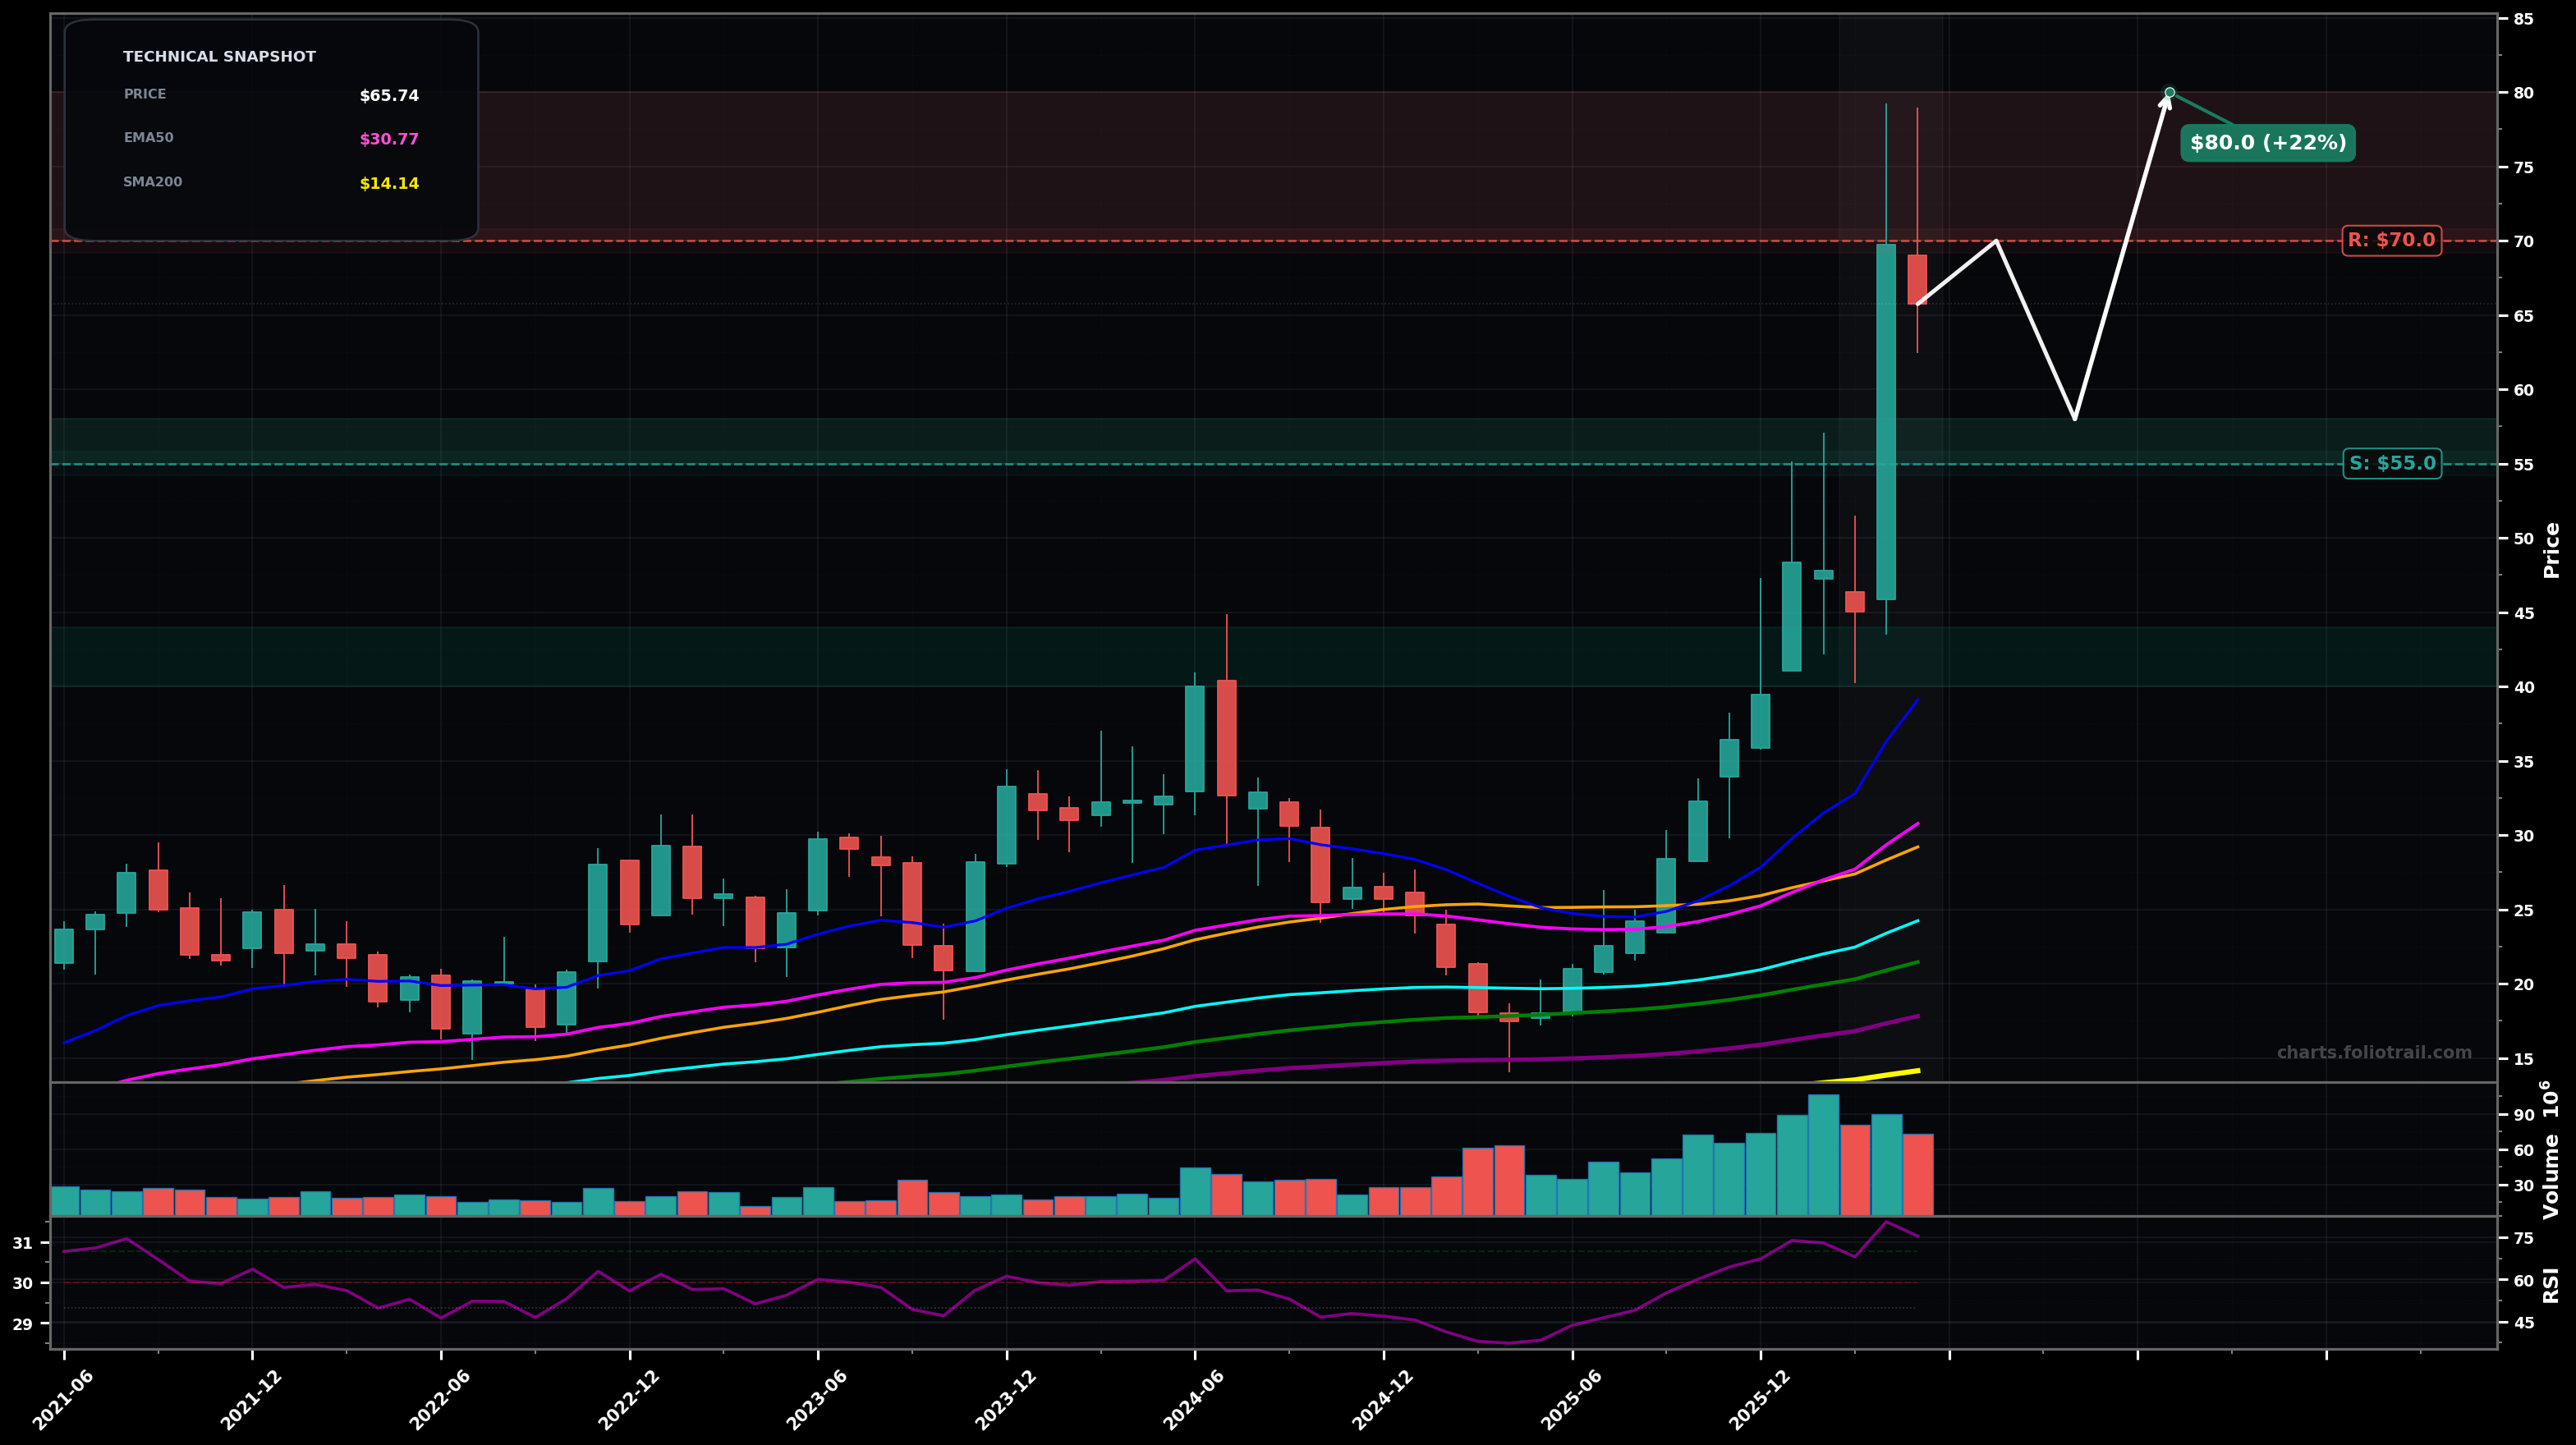
As of May 22, 2026, AMKR (Amkor Technology Inc.) is in a parabolic state on the monthly chart, with a confidence level of 74%. Key support is at $55.0 and key resistance at $70.0. Monthly uptrend with a sharp vertical breakout to ~$70, followed by a red pullback candle; price still far above all key MAs and RSI is overbought (~75).
Controlled pullback/flag: price digests the vertical move, retests prior breakout area, then attempts another leg higher (typical after a parabolic wave-3 style advance).
Mean-reversion down to the rising MA cluster: failure to hold the breakout leads to a deeper retrace toward the mid-$40s where prior structure and trend MAs should be first major demand.
Monthly close above $70 would confirm continued parabolic extension
Monthly close below $55 would invalidate parabolic strength and signal a deeper mean-reversion phase
Buy-the-dip framework: $55–$58 is the breakout/retest zone; $48–$52 is a deeper fib-style retrace area; $40–$44 aligns with prior base/structure and likely MA catch-up if mean reversion accelerates.
Parabolic extensions tend to retrace sharply; trim into strength at new highs ($70–$80), trim more if momentum persists ($80–$95), and consider full exit if an extreme blow-off develops ($95–$115) relative to the long-term MA stack.
As of May 22, 2026, AMKR (Amkor Technology Inc.) is in a parabolic state on the monthly chart with 74% confidence. Monthly uptrend with a sharp vertical breakout to ~$70, followed by a red pullback candle; price still far above all key MAs and RSI is overbought (~75).
On the monthly timeframe, AMKR has key support at $55.0 and key resistance at $70.0. The most likely scenario (bullish) targets $70.0 and $80.0, with a revert level at $58.0.
AMKR (Amkor Technology Inc.) is currently classified as parabolic on the monthly chart, with 74% confidence. Confirmation requires: Monthly close above $70 would confirm continued parabolic extension This would be invalidated by: Monthly close below $55 would invalidate parabolic strength and signal a deeper mean-reversion phase
The most likely scenario (bullish) targets $70.0 and $80.0, with a revert level at $58.0. The alternative scenario (bearish) targets $50.0 and $42.0.
Multi-layer AI agents analyse 200+ stocks across daily, weekly, and monthly timeframes — producing market state classifications, price scenarios with targets, and position entry/exit levels. Daily charts updated every trading day at 6 PM ET. Weekly charts refresh Fridays. Monthly charts refresh on the last trading day of each month. No paywall. No sign-up required.
Built by Foliotrail.
All content on this website — including charts, analysis, price targets, support/resistance levels, and position zones — is generated entirely by AI and provided for educational and informational purposes only.
This is not financial advice. NEXUSNOIR VENTURES SL (the operator of this website) is not a registered investment adviser or broker-dealer. You should not make investment decisions based solely on this information. Always do your own research and consult a qualified financial advisor.
By continuing, you acknowledge that you have read and agree to our full disclaimer & terms of use and privacy policy.