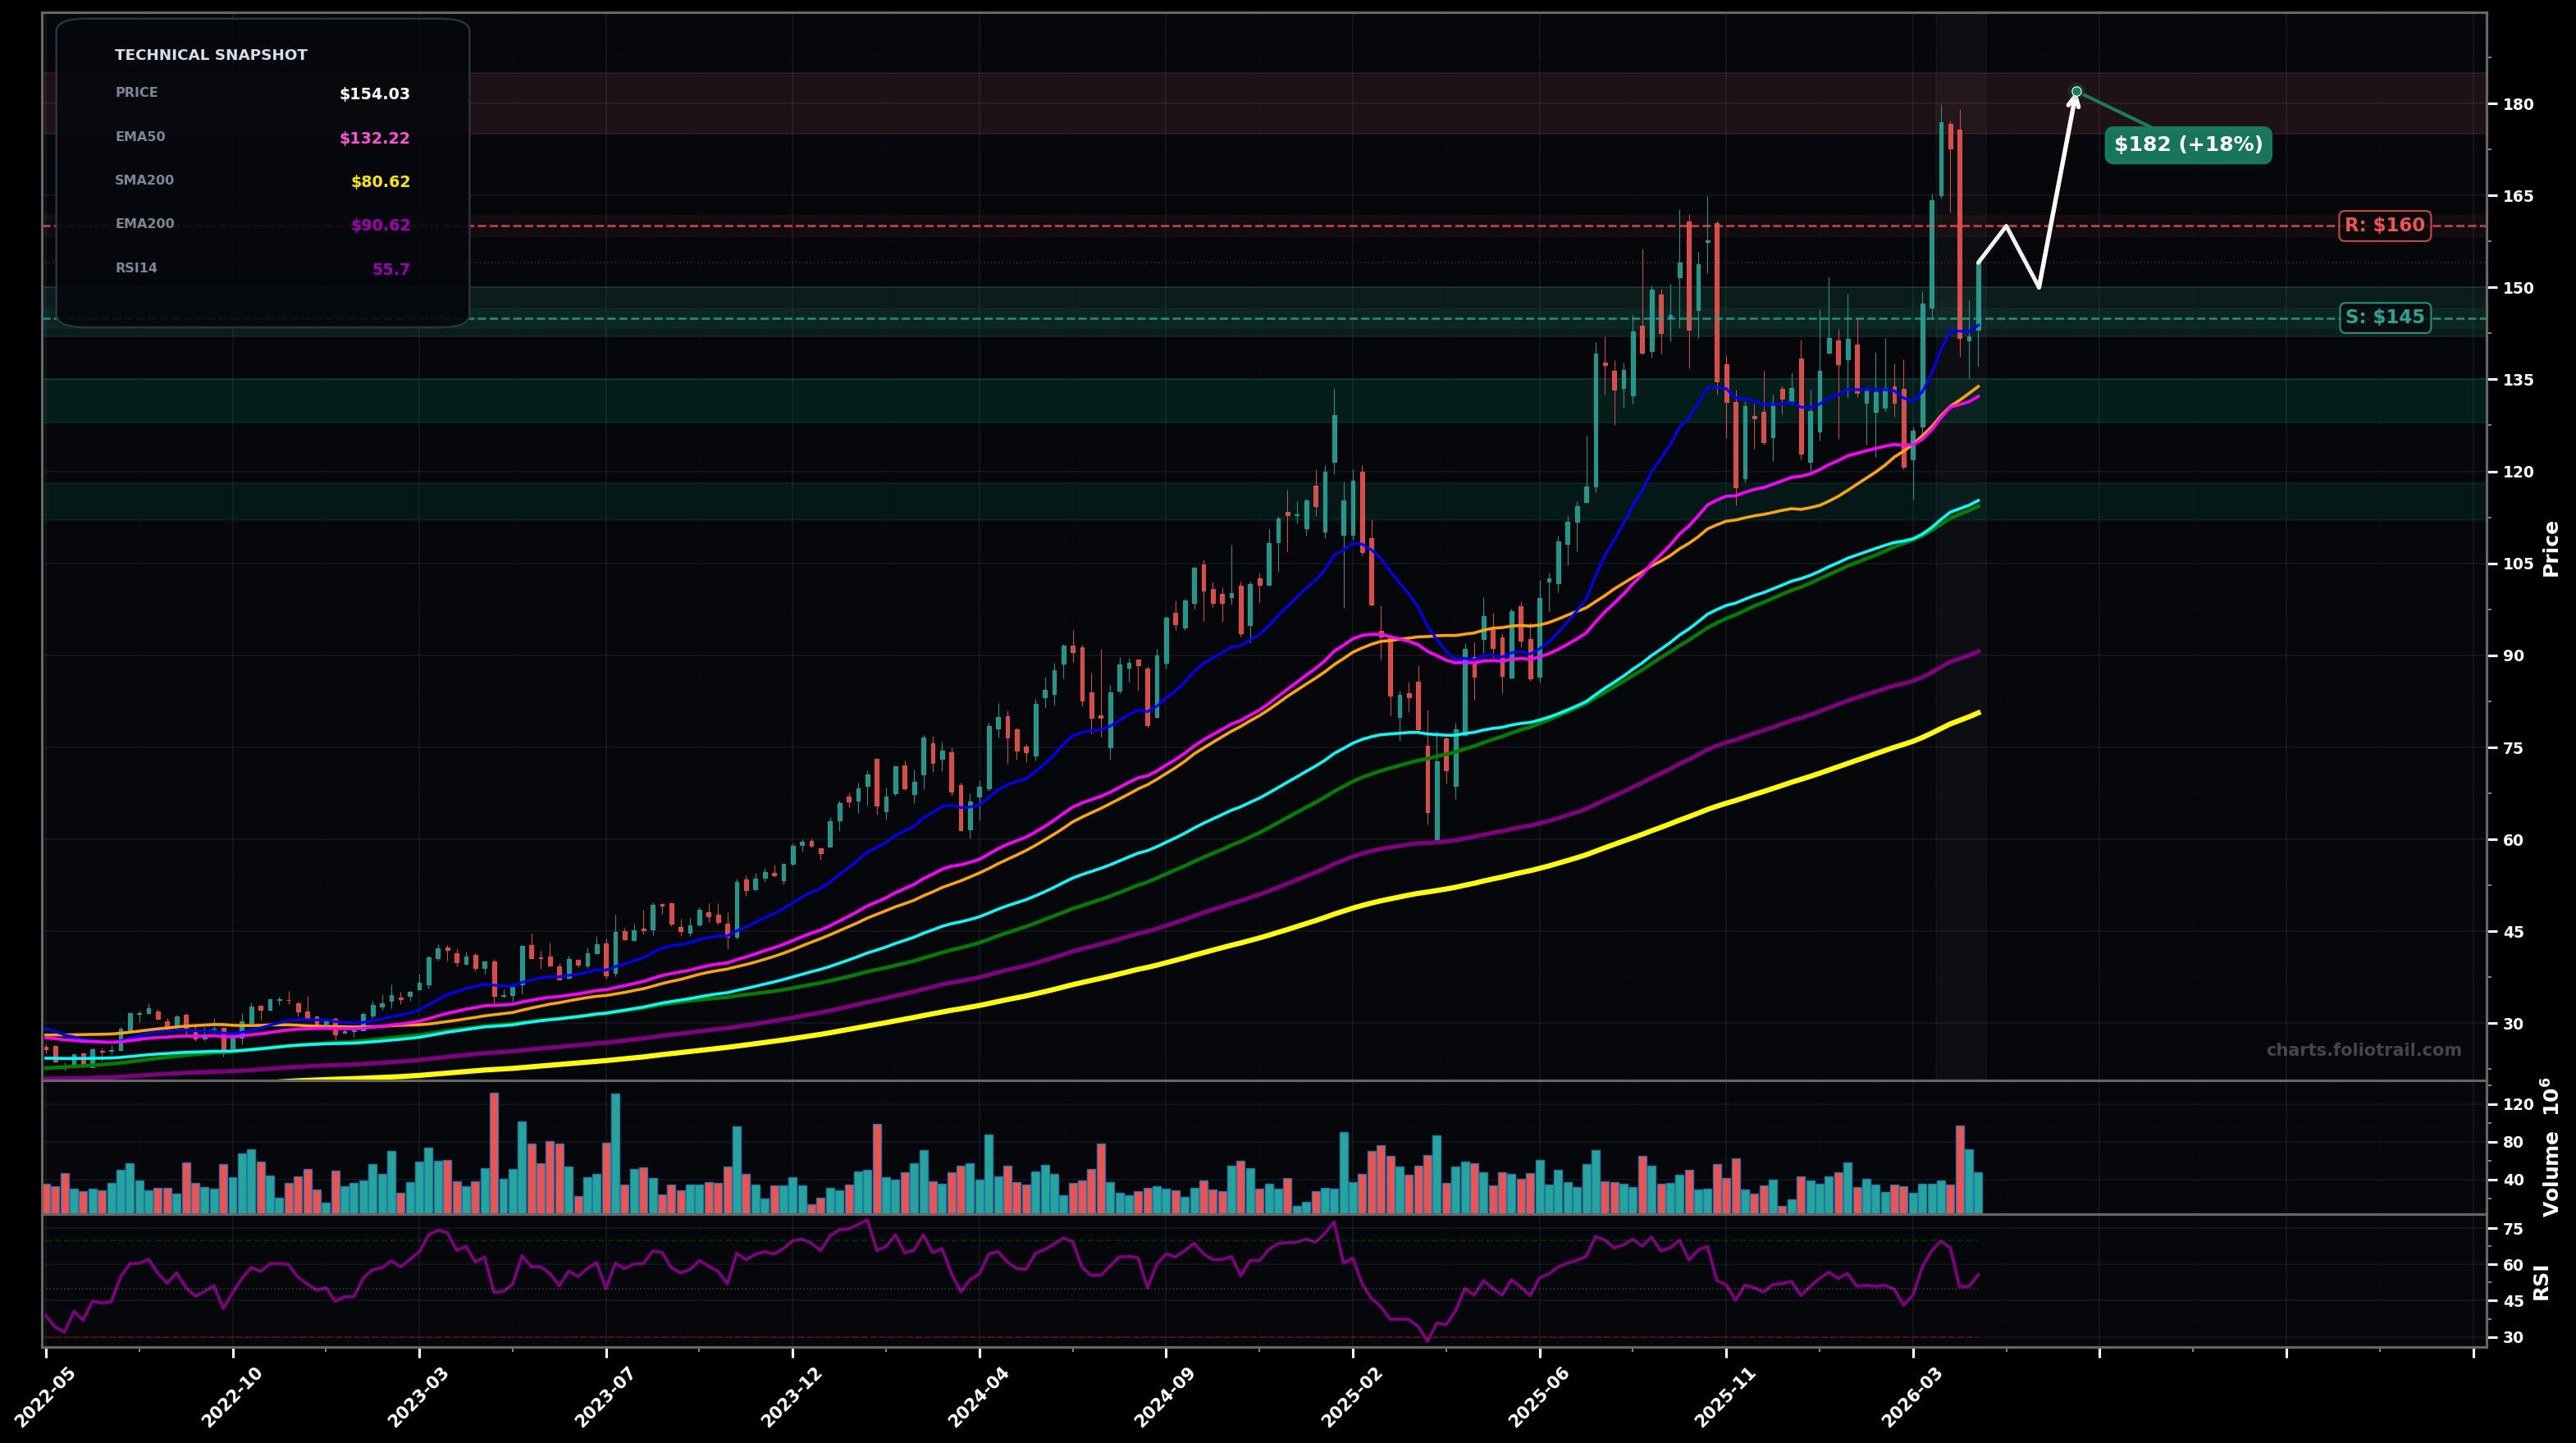
As of May 22, 2026, ANET (Arista Networks, Inc.) is in a uptrend state on the weekly chart, with a confidence level of 72%. Key support is at $145 and key resistance at $160. Weekly pullback from the recent ~$175 spike; price holding above rising EMA50 (~$132) and above prior breakout zone, RSI mid-50s.
Base above the $145 support and reattempt the $160-$175 supply zone; if reclaimed, continuation toward a measured move into the low $180s.
Deeper weekly correction as the post-spike mean reversion continues; price revisits the rising EMA50/SMA50 confluence, then either stabilizes or briefly undercuts before demand returns.
2+ weekly closes back above $160
Weekly close below $140
Start near prior breakout/HL support (~$145); add on EMA50/SMA50 confluence (~$132); heavy add only on a deeper fib/EMA100 retest area (~$115) where trend would be tested but not fully broken.
Trim into prior spike supply ($175-$185); trim more if price extends into an Elliott Wave 5-style acceleration above prior highs ($205-$225); close if extreme multi-year extension/upper fib expansion zone is reached ($245+).
As of May 22, 2026, ANET (Arista Networks, Inc.) is in a uptrend state on the weekly chart with 72% confidence. Weekly pullback from the recent ~$175 spike; price holding above rising EMA50 (~$132) and above prior breakout zone, RSI mid-50s.
On the weekly timeframe, ANET has key support at $145 and key resistance at $160. The most likely scenario (bullish) targets $160 and $182, with a revert level at $150.
ANET (Arista Networks, Inc.) is currently classified as uptrend on the weekly chart, with 72% confidence. Confirmation requires: 2+ weekly closes back above $160 This would be invalidated by: Weekly close below $140
The most likely scenario (bullish) targets $160 and $182, with a revert level at $150. The alternative scenario (bearish) targets $132 and $115.
Multi-layer AI agents analyse 200+ stocks across daily, weekly, and monthly timeframes — producing market state classifications, price scenarios with targets, and position entry/exit levels. Daily charts updated every trading day at 6 PM ET. Weekly charts refresh Fridays. Monthly charts refresh on the last trading day of each month. No paywall. No sign-up required.
Built by Foliotrail.
All content on this website — including charts, analysis, price targets, support/resistance levels, and position zones — is generated entirely by AI and provided for educational and informational purposes only.
This is not financial advice. NEXUSNOIR VENTURES SL (the operator of this website) is not a registered investment adviser or broker-dealer. You should not make investment decisions based solely on this information. Always do your own research and consult a qualified financial advisor.
By continuing, you acknowledge that you have read and agree to our full disclaimer & terms of use and privacy policy.