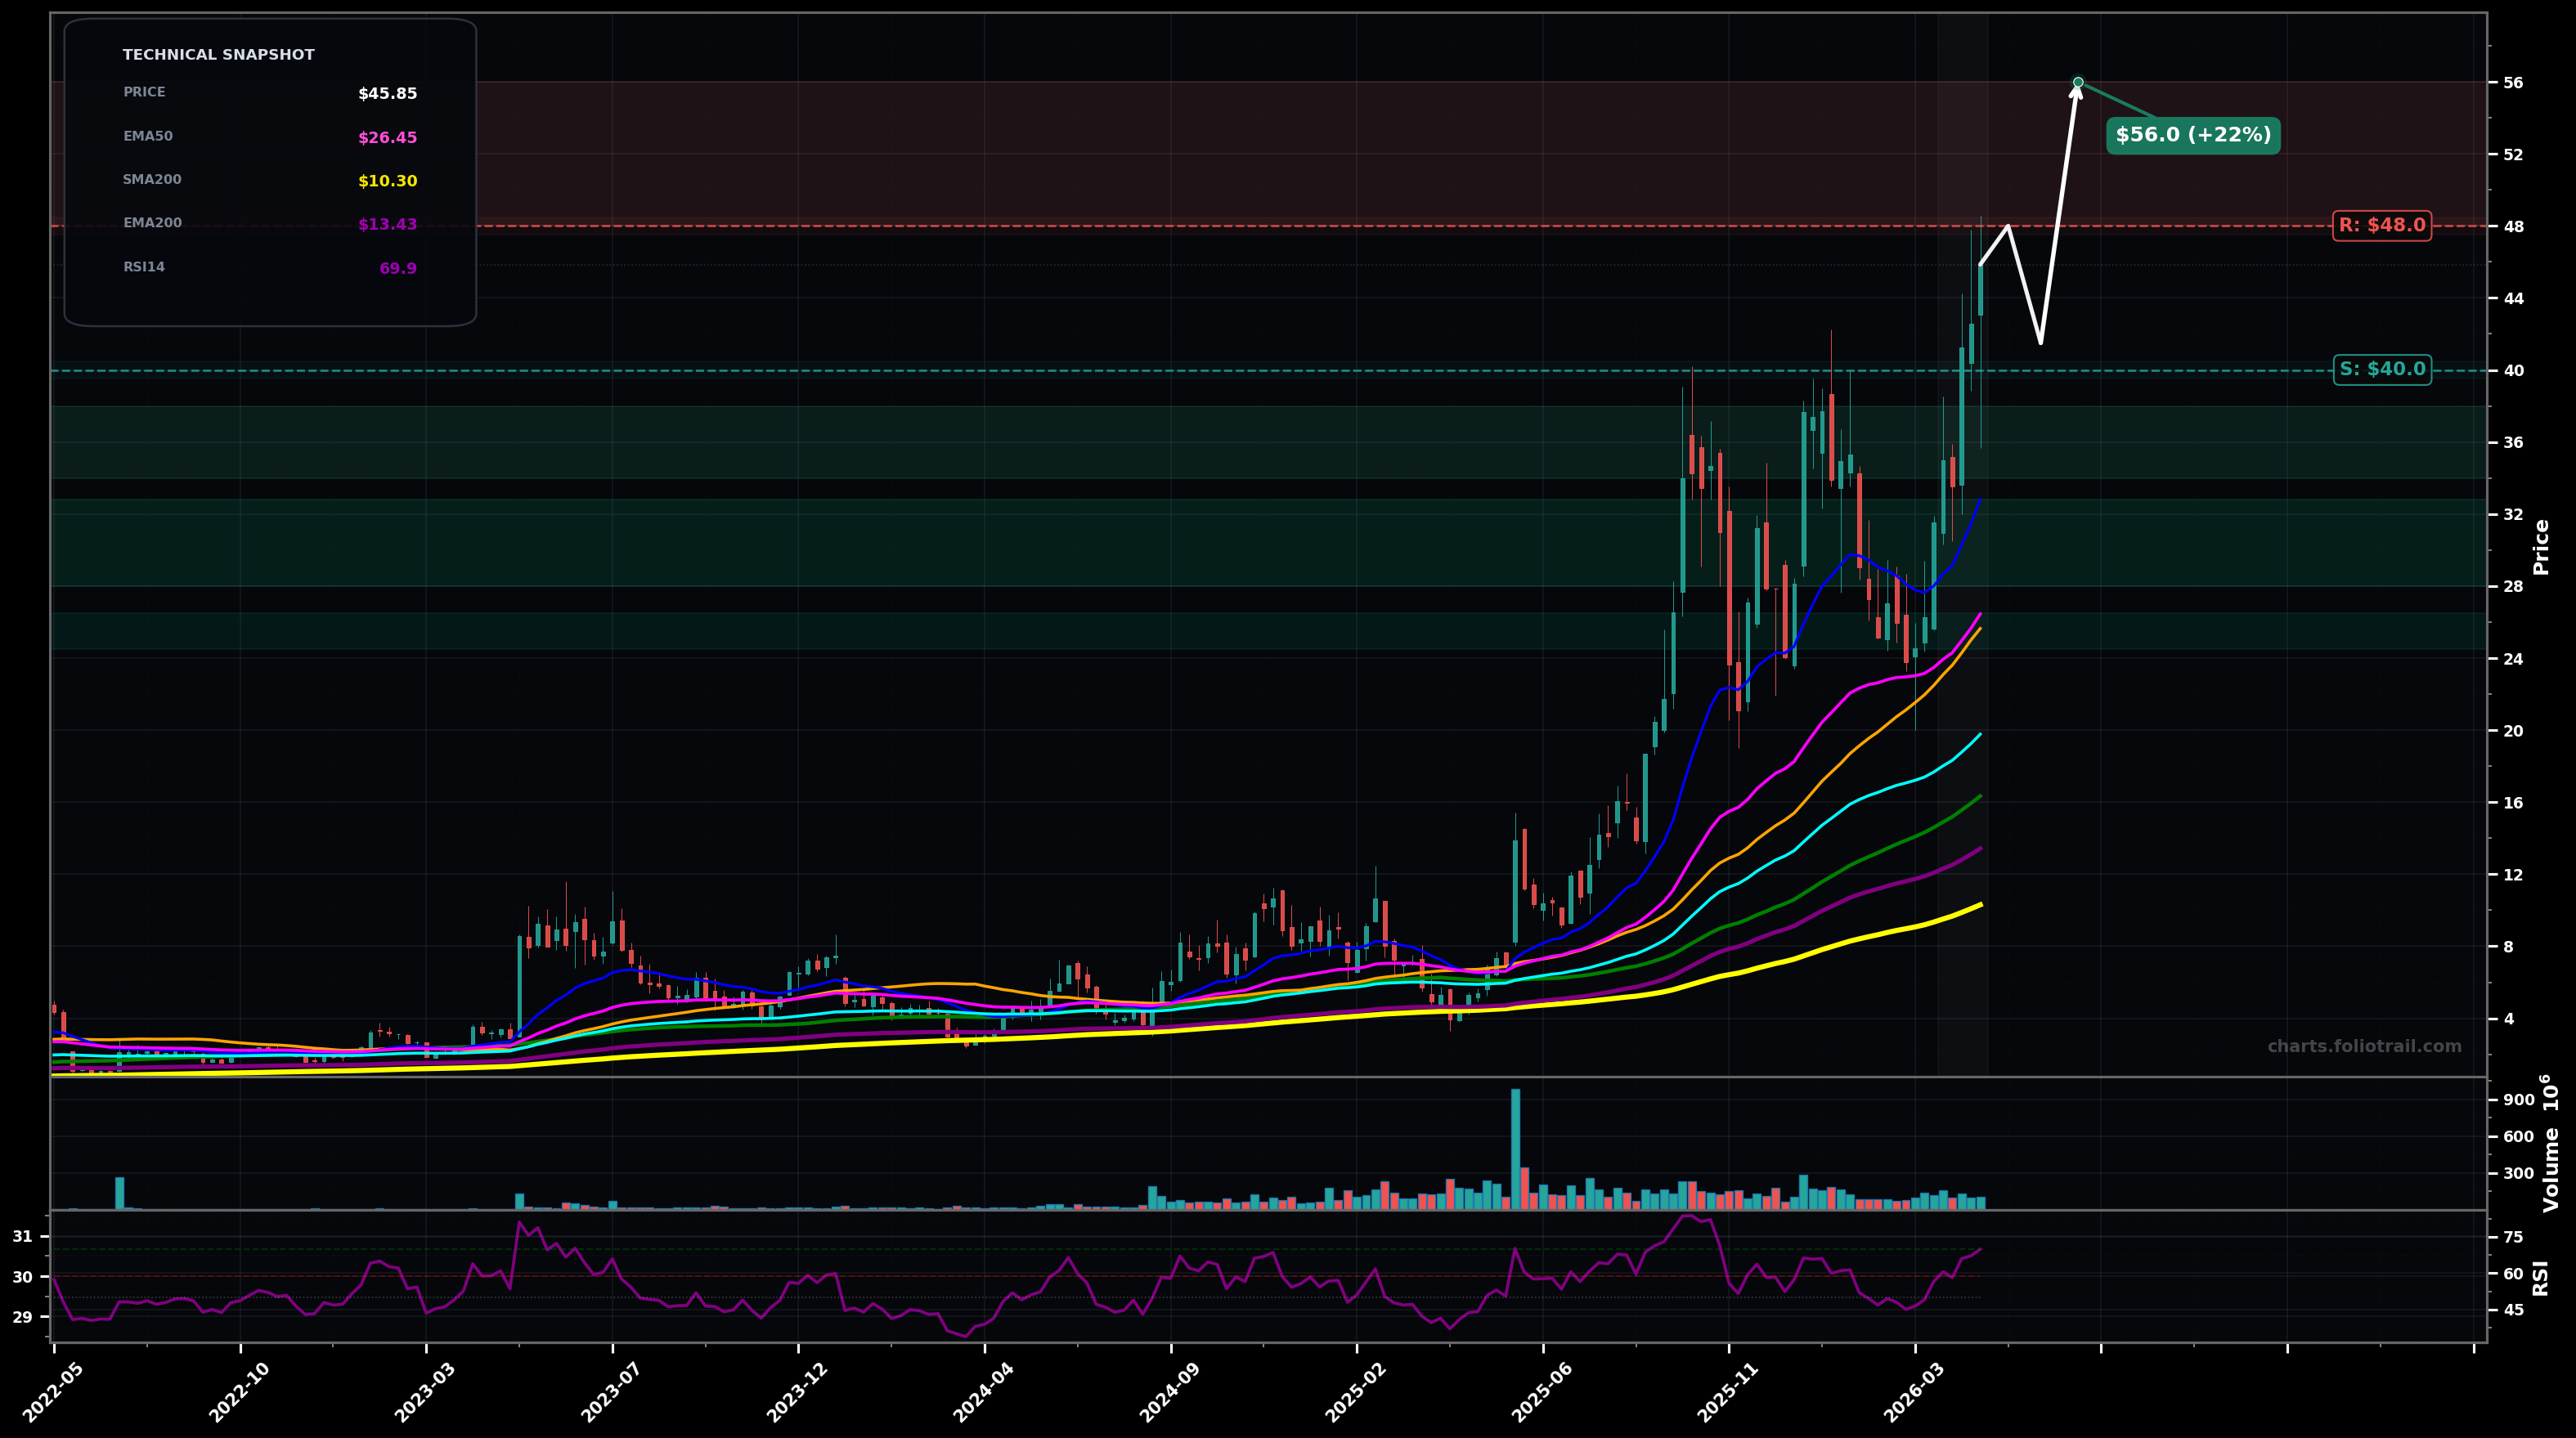
As of May 22, 2026, APLD (Applied Digital Corporation) is in a parabolic state on the weekly chart, with a confidence level of 72%. Key support is at $40.0 and key resistance at $48.0. Strong weekly impulse to new highs; price ($45.85) is extended above rising EMA50 ($26.45) and EMA100 ($19.78); RSI14 ~69.9 (near overbought).
Bullish continuation: brief consolidation/pullback holds $40 support then attempts another leg up (Elliott: late wave 3/early wave 5 behavior; fib extension focus).
Mean-reversion: parabolic blow-off transitions into a sharper ABC-style correction; retrace toward rising EMA50/SMA50 cluster before trend decision.
Weekly close holding above $40.00
Weekly close below $32.80 (EMA20 area) would shift from parabolic to deeper pullback/base risk
Buy zones map to prior breakout/round-number support ($40->$34), then EMA20 ($32.8) and EMA50/SMA50 confluence (~$26) where pullbacks often terminate in strong uptrends.
Trim into fib-extension/psych levels as price remains far above EMA50/EMA100; parabolic phases commonly mean-revert after new-high spikes, so scaling out reduces giveback risk.
As of May 22, 2026, APLD (Applied Digital Corporation) is in a parabolic state on the weekly chart with 72% confidence. Strong weekly impulse to new highs; price ($45.85) is extended above rising EMA50 ($26.45) and EMA100 ($19.78); RSI14 ~69.9 (near overbought).
On the weekly timeframe, APLD has key support at $40.0 and key resistance at $48.0. The most likely scenario (bullish) targets $48.0 and $56.0, with a revert level at $41.5.
APLD (Applied Digital Corporation) is currently classified as parabolic on the weekly chart, with 72% confidence. Confirmation requires: Weekly close holding above $40.00 This would be invalidated by: Weekly close below $32.80 (EMA20 area) would shift from parabolic to deeper pullback/base risk
The most likely scenario (bullish) targets $48.0 and $56.0, with a revert level at $41.5. The alternative scenario (bearish) targets $32.8 and $26.5.
Multi-layer AI agents analyse 200+ stocks across daily, weekly, and monthly timeframes — producing market state classifications, price scenarios with targets, and position entry/exit levels. Daily charts updated every trading day at 6 PM ET. Weekly charts refresh Fridays. Monthly charts refresh on the last trading day of each month. No paywall. No sign-up required.
Built by Foliotrail.
All content on this website — including charts, analysis, price targets, support/resistance levels, and position zones — is generated entirely by AI and provided for educational and informational purposes only.
This is not financial advice. NEXUSNOIR VENTURES SL (the operator of this website) is not a registered investment adviser or broker-dealer. You should not make investment decisions based solely on this information. Always do your own research and consult a qualified financial advisor.
By continuing, you acknowledge that you have read and agree to our full disclaimer & terms of use and privacy policy.