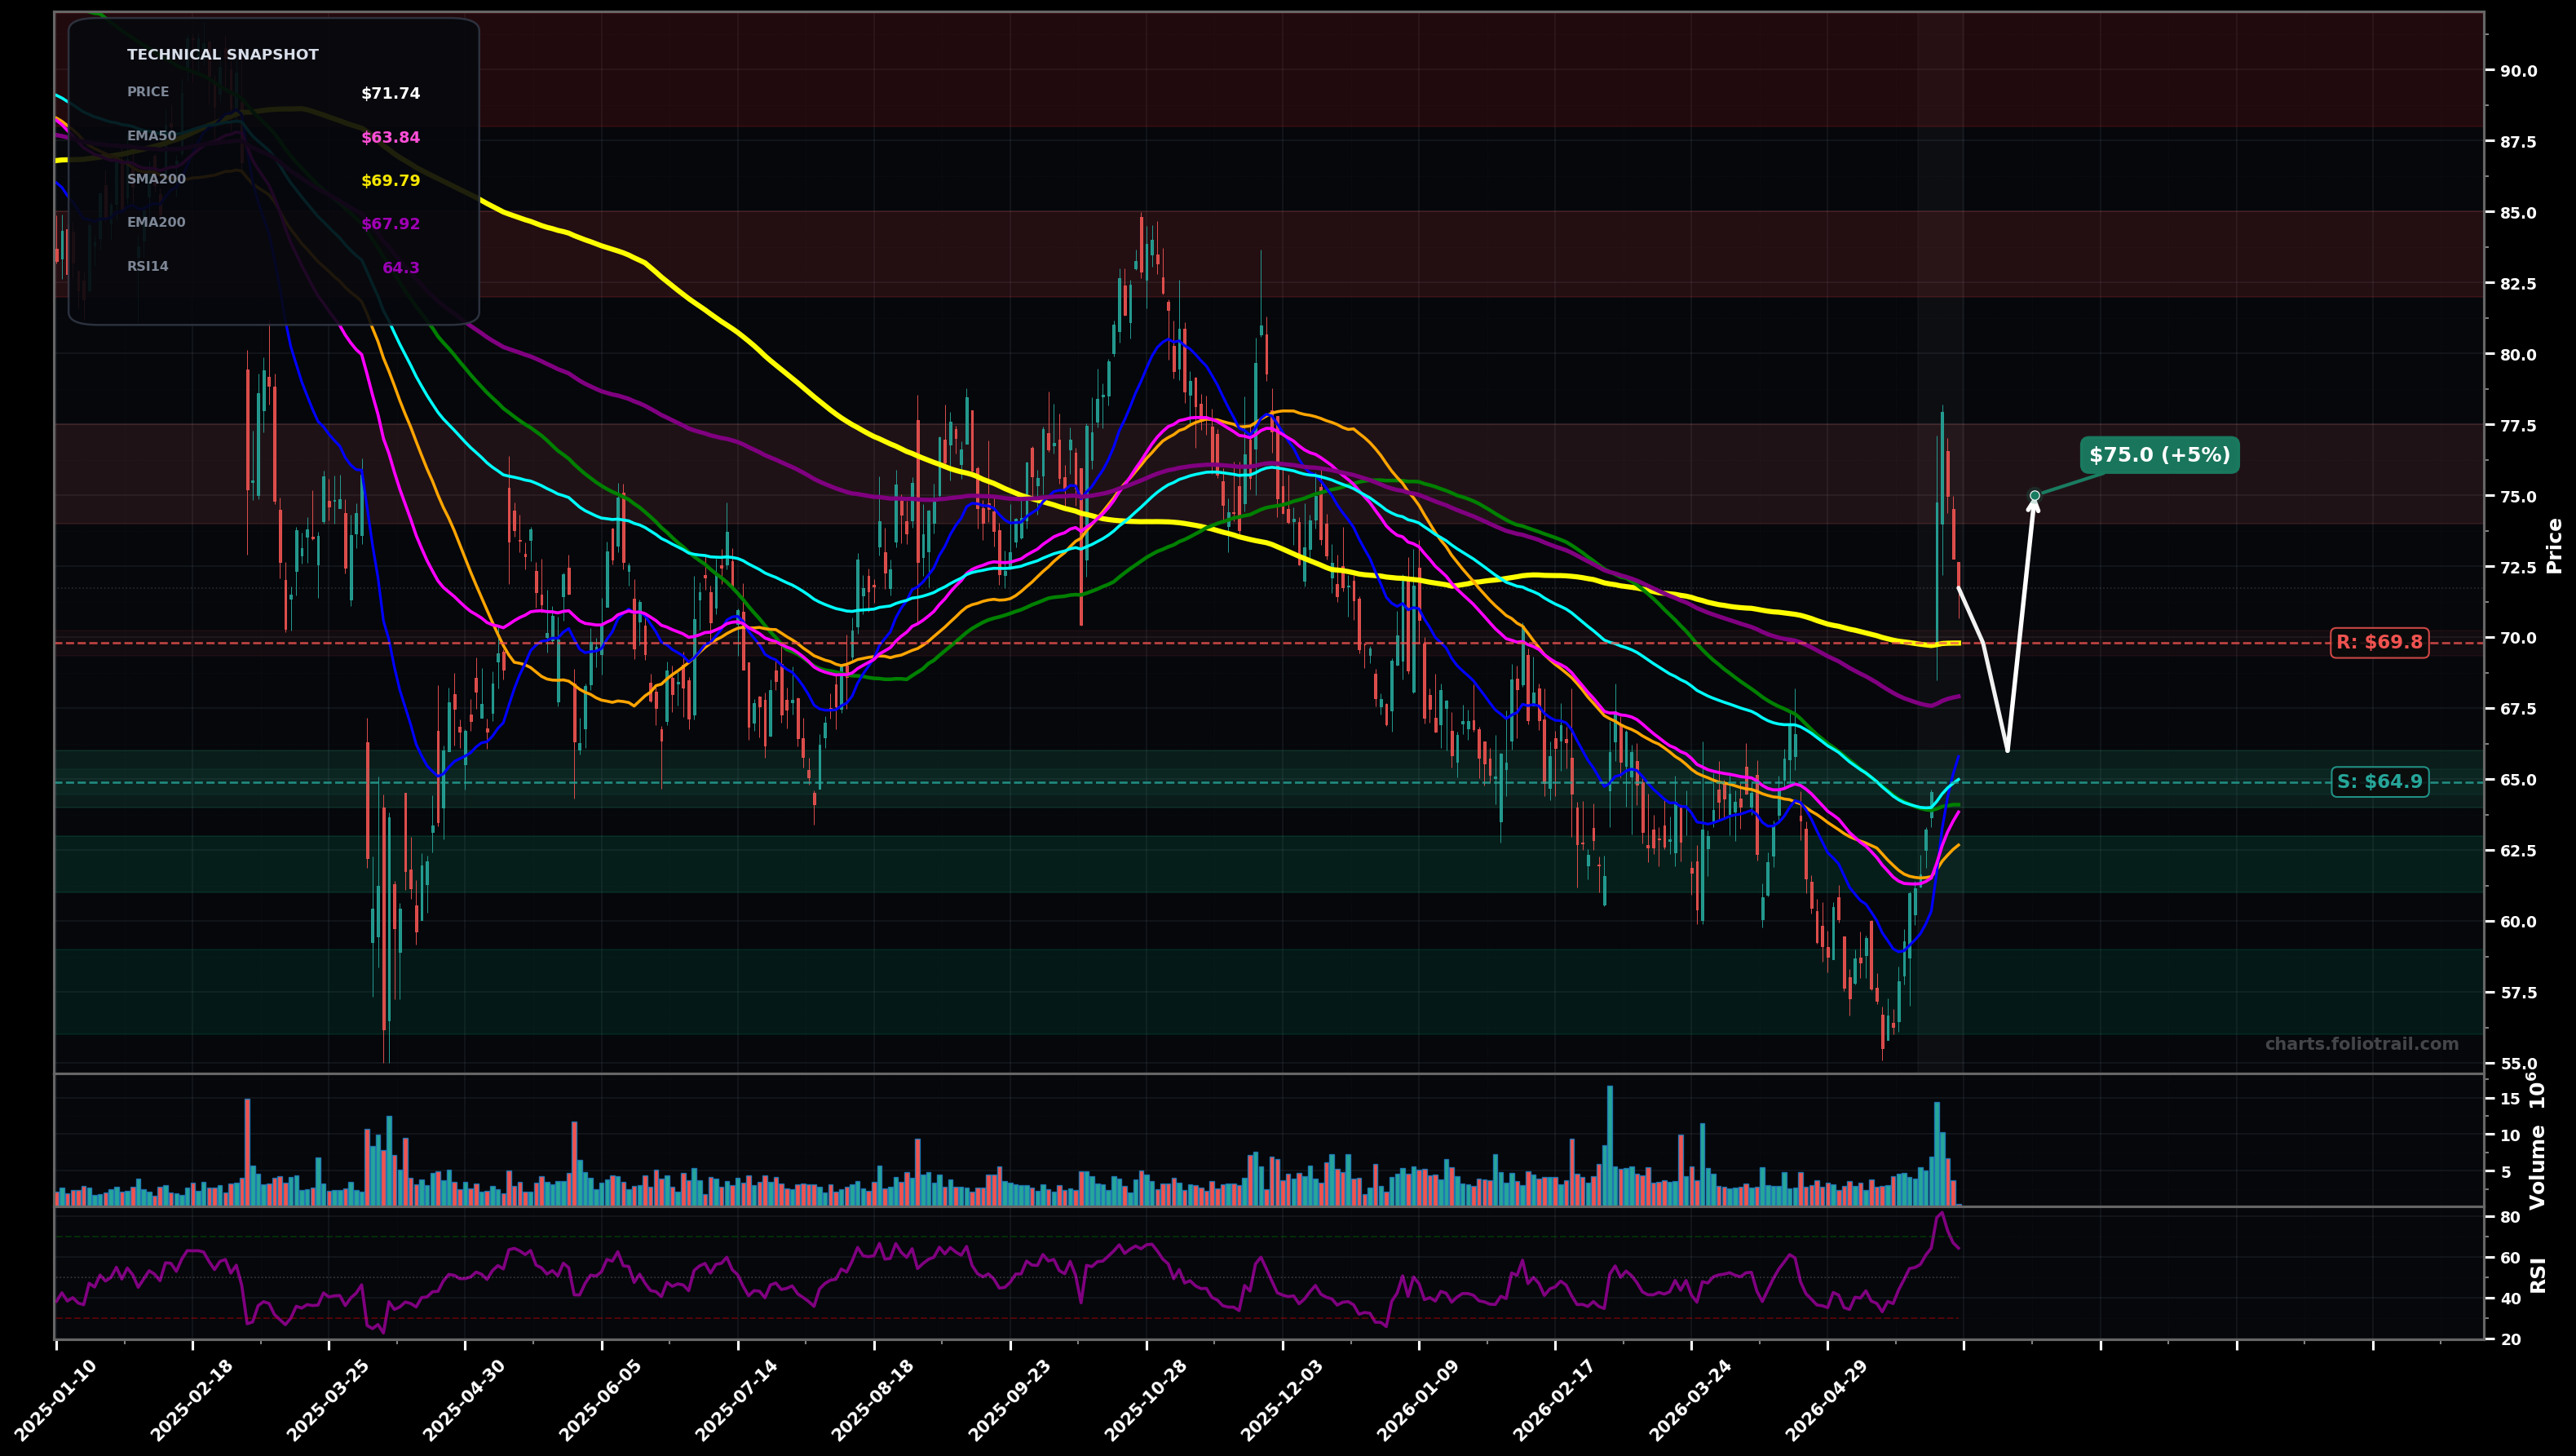
As of June 03, 2026, BBY (Best Buy Co., Inc.) is in a bottoming attempt state on the daily chart, with a confidence level of 63%. Key support is at $64.9 and key resistance at $69.8. Sharp rebound from the ~$56 swing low into a high-volume pop to ~$77–$78, then a pullback; price still above fast MAs but below major long-term MAs.
Base-building continuation: pullback holds the reclaimed EMA100/EMA50 cluster (~$65), then a second push tests and potentially reclaims the $69.8–$71 supply zone (SMA200/EMA200 area).
Rejection at the long-term MA band: price fails to hold ~$65 support, rolls over, and retests the prior capitulation zone; this would suggest the bounce was a corrective wave (Elliott wave B/2) within a larger downtrend.
2+ daily closes above $69.80 (SMA200) holding as support
Daily close below $60.00 (breaks the rebound structure toward the $56 swing low)
Start near reclaimed EMA50/EMA100 support; add on loss of that shelf into prior demand; heavy add only on deep retest of the swing low/base where the bounce originated.
Trim into overhead supply from prior breakdown zones; heavier trimming near the prior major swing highs where fib retracement/resistance likely clusters and mean reversion risk rises.
As of June 03, 2026, BBY (Best Buy Co., Inc.) is in a bottoming attempt state on the daily chart with 63% confidence. Sharp rebound from the ~$56 swing low into a high-volume pop to ~$77–$78, then a pullback; price still above fast MAs but below major long-term MAs.
On the daily timeframe, BBY has key support at $64.9 and key resistance at $69.8. The most likely scenario (bullish) targets $69.8 and $75.0, with a revert level at $66.0.
BBY (Best Buy Co., Inc.) is currently classified as bottoming attempt on the daily chart, with 63% confidence. Confirmation requires: 2+ daily closes above $69.80 (SMA200) holding as support This would be invalidated by: Daily close below $60.00 (breaks the rebound structure toward the $56 swing low)
The most likely scenario (bullish) targets $69.8 and $75.0, with a revert level at $66.0. The alternative scenario (bearish) targets $60.0 and $56.0.
Multi-layer AI agents analyse 200+ stocks across daily, weekly, and monthly timeframes — producing market state classifications, price scenarios with targets, and position entry/exit levels. Daily charts updated every trading day at 6 PM ET. Weekly charts refresh Fridays. Monthly charts refresh on the last trading day of each month. No paywall. No sign-up required.
Built by Foliotrail.
All content on this website — including charts, analysis, price targets, support/resistance levels, and position zones — is generated entirely by AI and provided for educational and informational purposes only.
This is not financial advice. NEXUSNOIR VENTURES SL (the operator of this website) is not a registered investment adviser or broker-dealer. You should not make investment decisions based solely on this information. Always do your own research and consult a qualified financial advisor.
By continuing, you acknowledge that you have read and agree to our full disclaimer & terms of use and privacy policy.