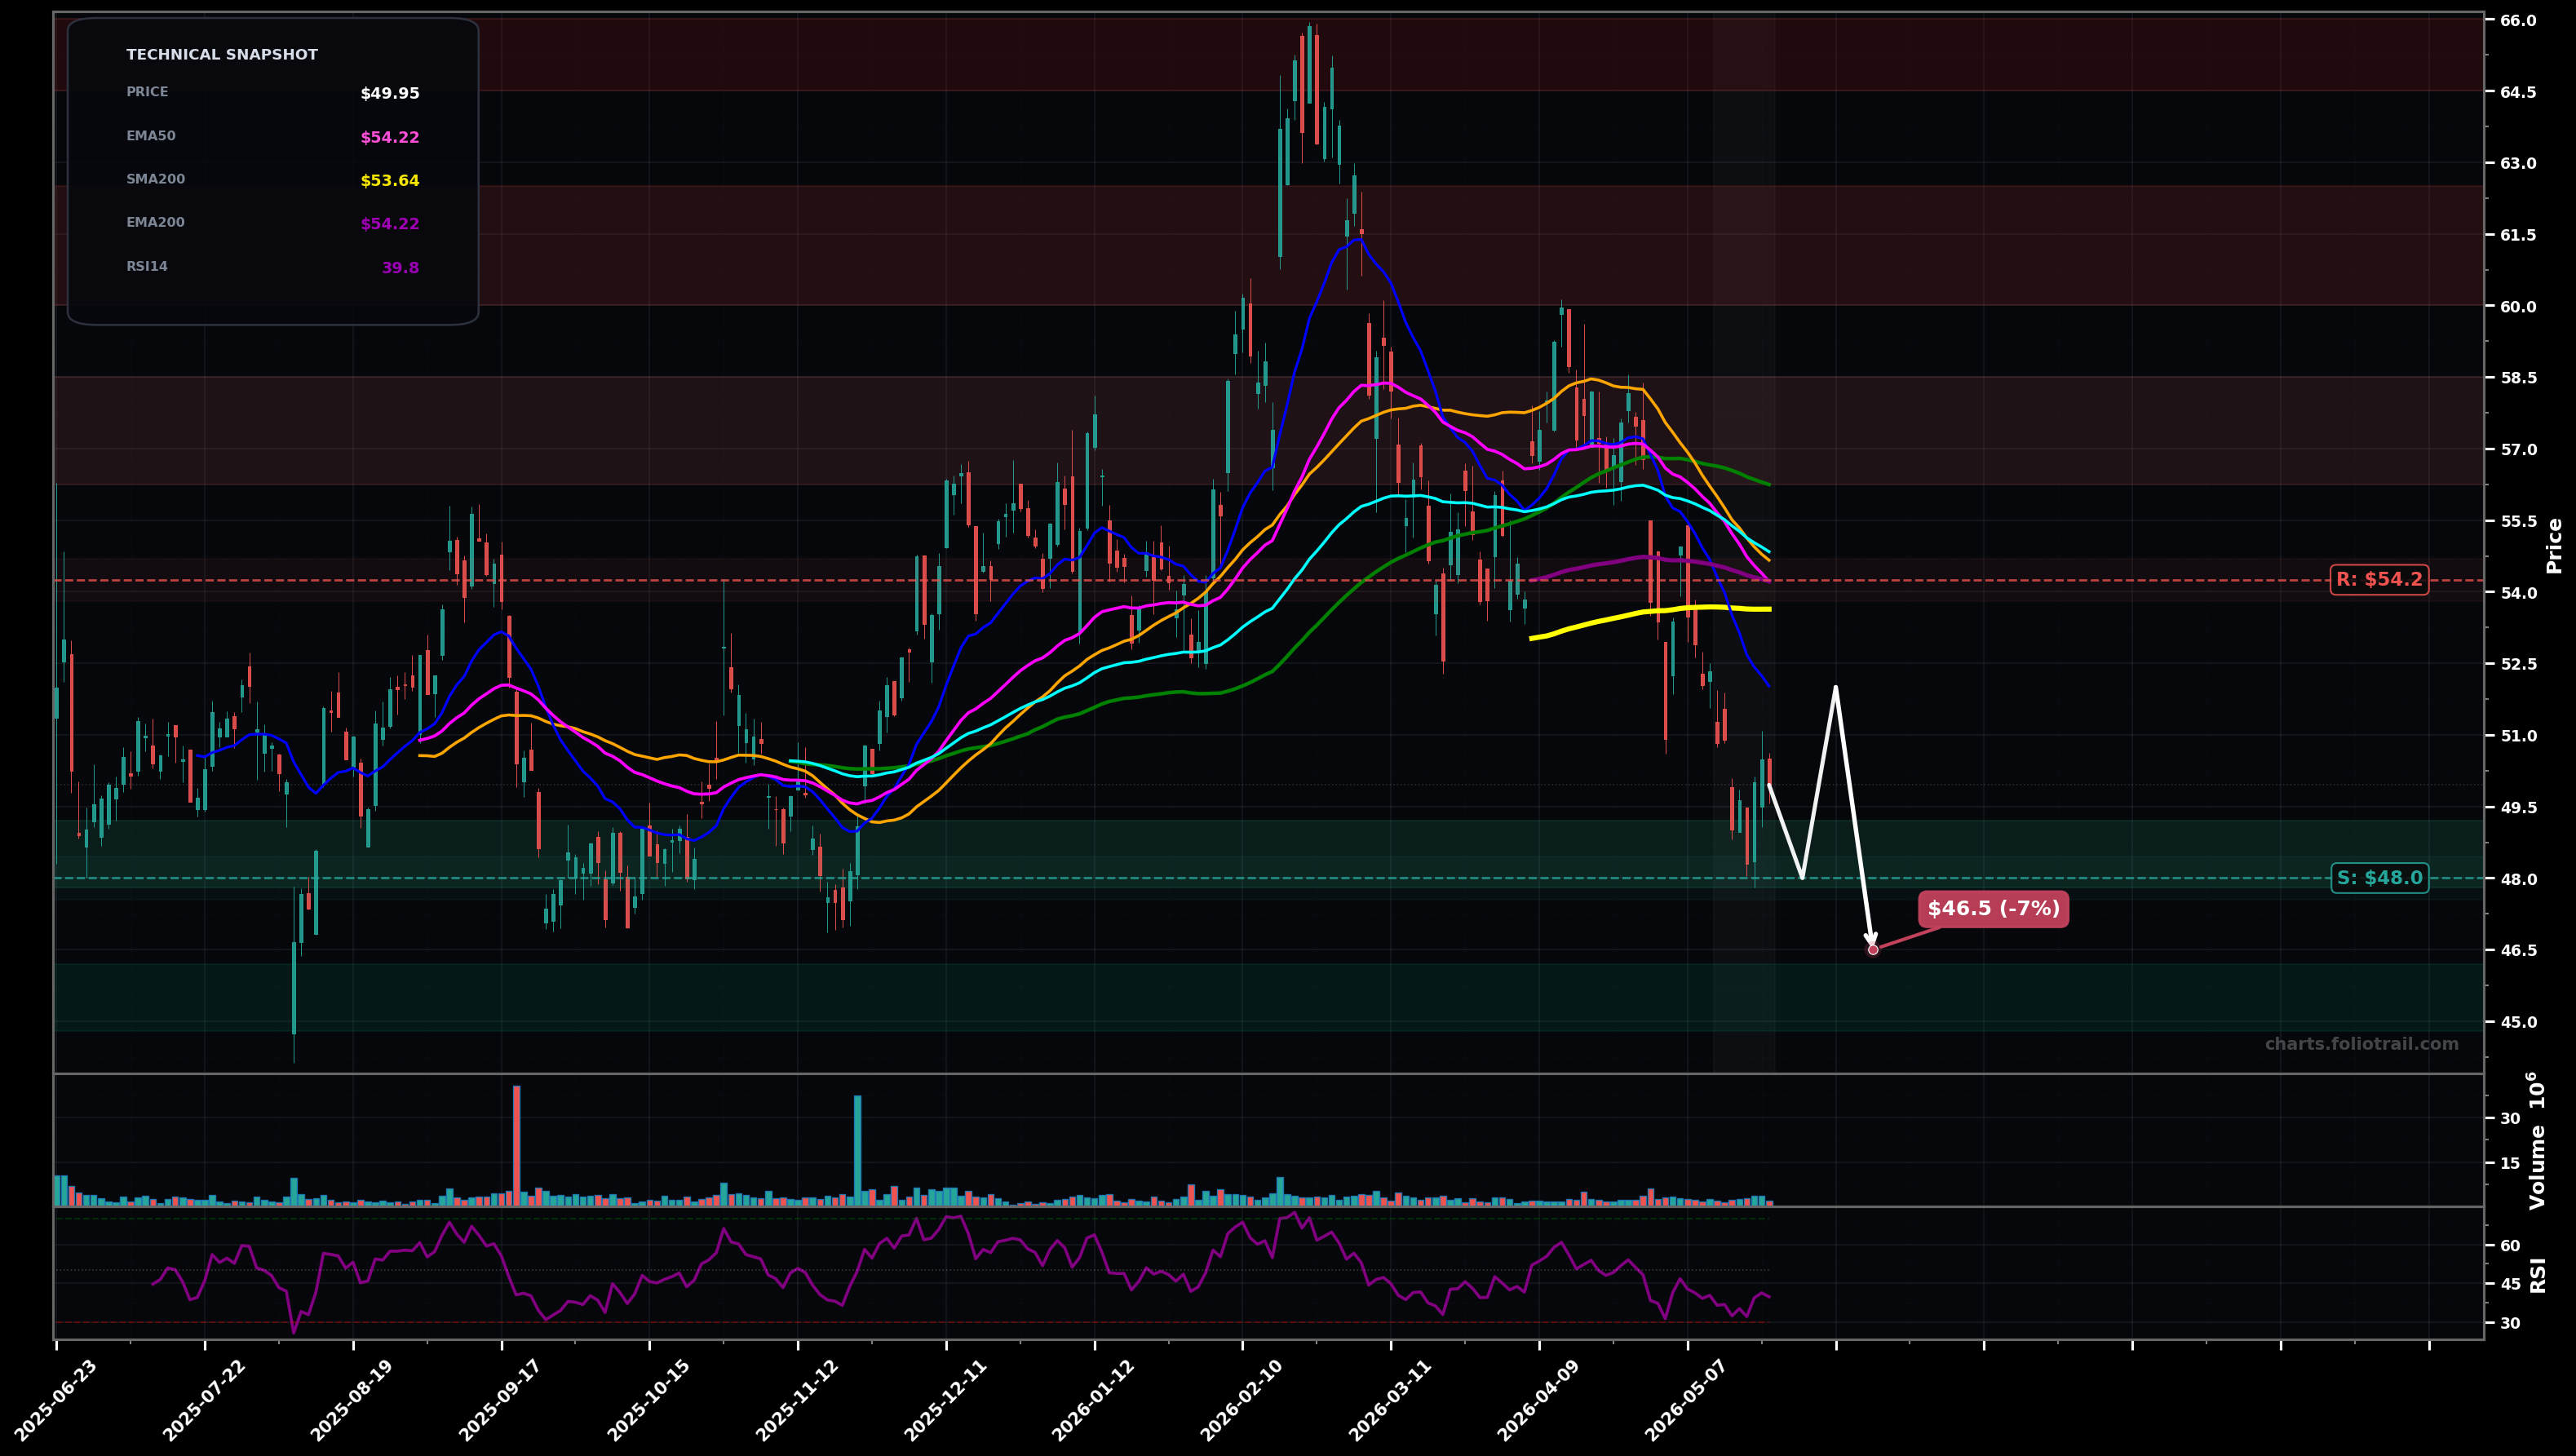
As of May 22, 2026, AMRZ (Amrize Ltd) is in a downtrend state on the daily chart, with a confidence level of 72%. Key support is at $48.0 and key resistance at $54.2. Sharp selloff from ~$57 area to a ~$48 swing low, then a small bounce to ~$50 but still below clustered MAs; RSI weak (~40).
Bearish continuation: bounce attempts fail into the $52-$54 supply/MA cluster, then price retests and likely breaks $48, extending to the next demand zone. (Prob ~60%)
Relief rally / bottoming attempt: holds $48, forms a higher low, then reclaims the $53-$54 band (SMA200/EMA50-EMA200 cluster) and mean-reverts toward the $56-$57 area. (Prob ~40%)
Daily close below $48.00 (break of the recent swing low) would confirm downtrend continuation
Two daily closes back above $54.25 (EMA50/EMA200 area) would invalidate the immediate downtrend thesis
Start near the $48 swing-low reference; add on a controlled flush toward prior base support; heavy add only if capitulation tags the mid-$45s (deeper Fib retrace of the $66->$48 leg).
Trim into the next overhead MA/swing-supply bands ($56-$58 then $60-$62.5); fully exit into prior major peak supply near $65-$66 where the last impulsive top formed (Elliott-wave-like wave 5 exhaustion zone).
As of May 22, 2026, AMRZ (Amrize Ltd) is in a downtrend state on the daily chart with 72% confidence. Sharp selloff from ~$57 area to a ~$48 swing low, then a small bounce to ~$50 but still below clustered MAs; RSI weak (~40).
On the daily timeframe, AMRZ has key support at $48.0 and key resistance at $54.2. The most likely scenario (bearish) targets $48.0 and $46.5, with a revert level at $52.0.
AMRZ (Amrize Ltd) is currently classified as downtrend on the daily chart, with 72% confidence. Confirmation requires: Daily close below $48.00 (break of the recent swing low) would confirm downtrend continuation This would be invalidated by: Two daily closes back above $54.25 (EMA50/EMA200 area) would invalidate the immediate downtrend thesis
The most likely scenario (bearish) targets $48.0 and $46.5, with a revert level at $52.0. The alternative scenario (bullish) targets $54.2 and $56.2.
Multi-layer AI agents analyse 200+ stocks across daily, weekly, and monthly timeframes — producing market state classifications, price scenarios with targets, and position entry/exit levels. Daily charts updated every trading day at 6 PM ET. Weekly charts refresh Fridays. Monthly charts refresh on the last trading day of each month. No paywall. No sign-up required.
Built by Foliotrail.
All content on this website — including charts, analysis, price targets, support/resistance levels, and position zones — is generated entirely by AI and provided for educational and informational purposes only.
This is not financial advice. NEXUSNOIR VENTURES SL (the operator of this website) is not a registered investment adviser or broker-dealer. You should not make investment decisions based solely on this information. Always do your own research and consult a qualified financial advisor.
By continuing, you acknowledge that you have read and agree to our full disclaimer & terms of use and privacy policy.