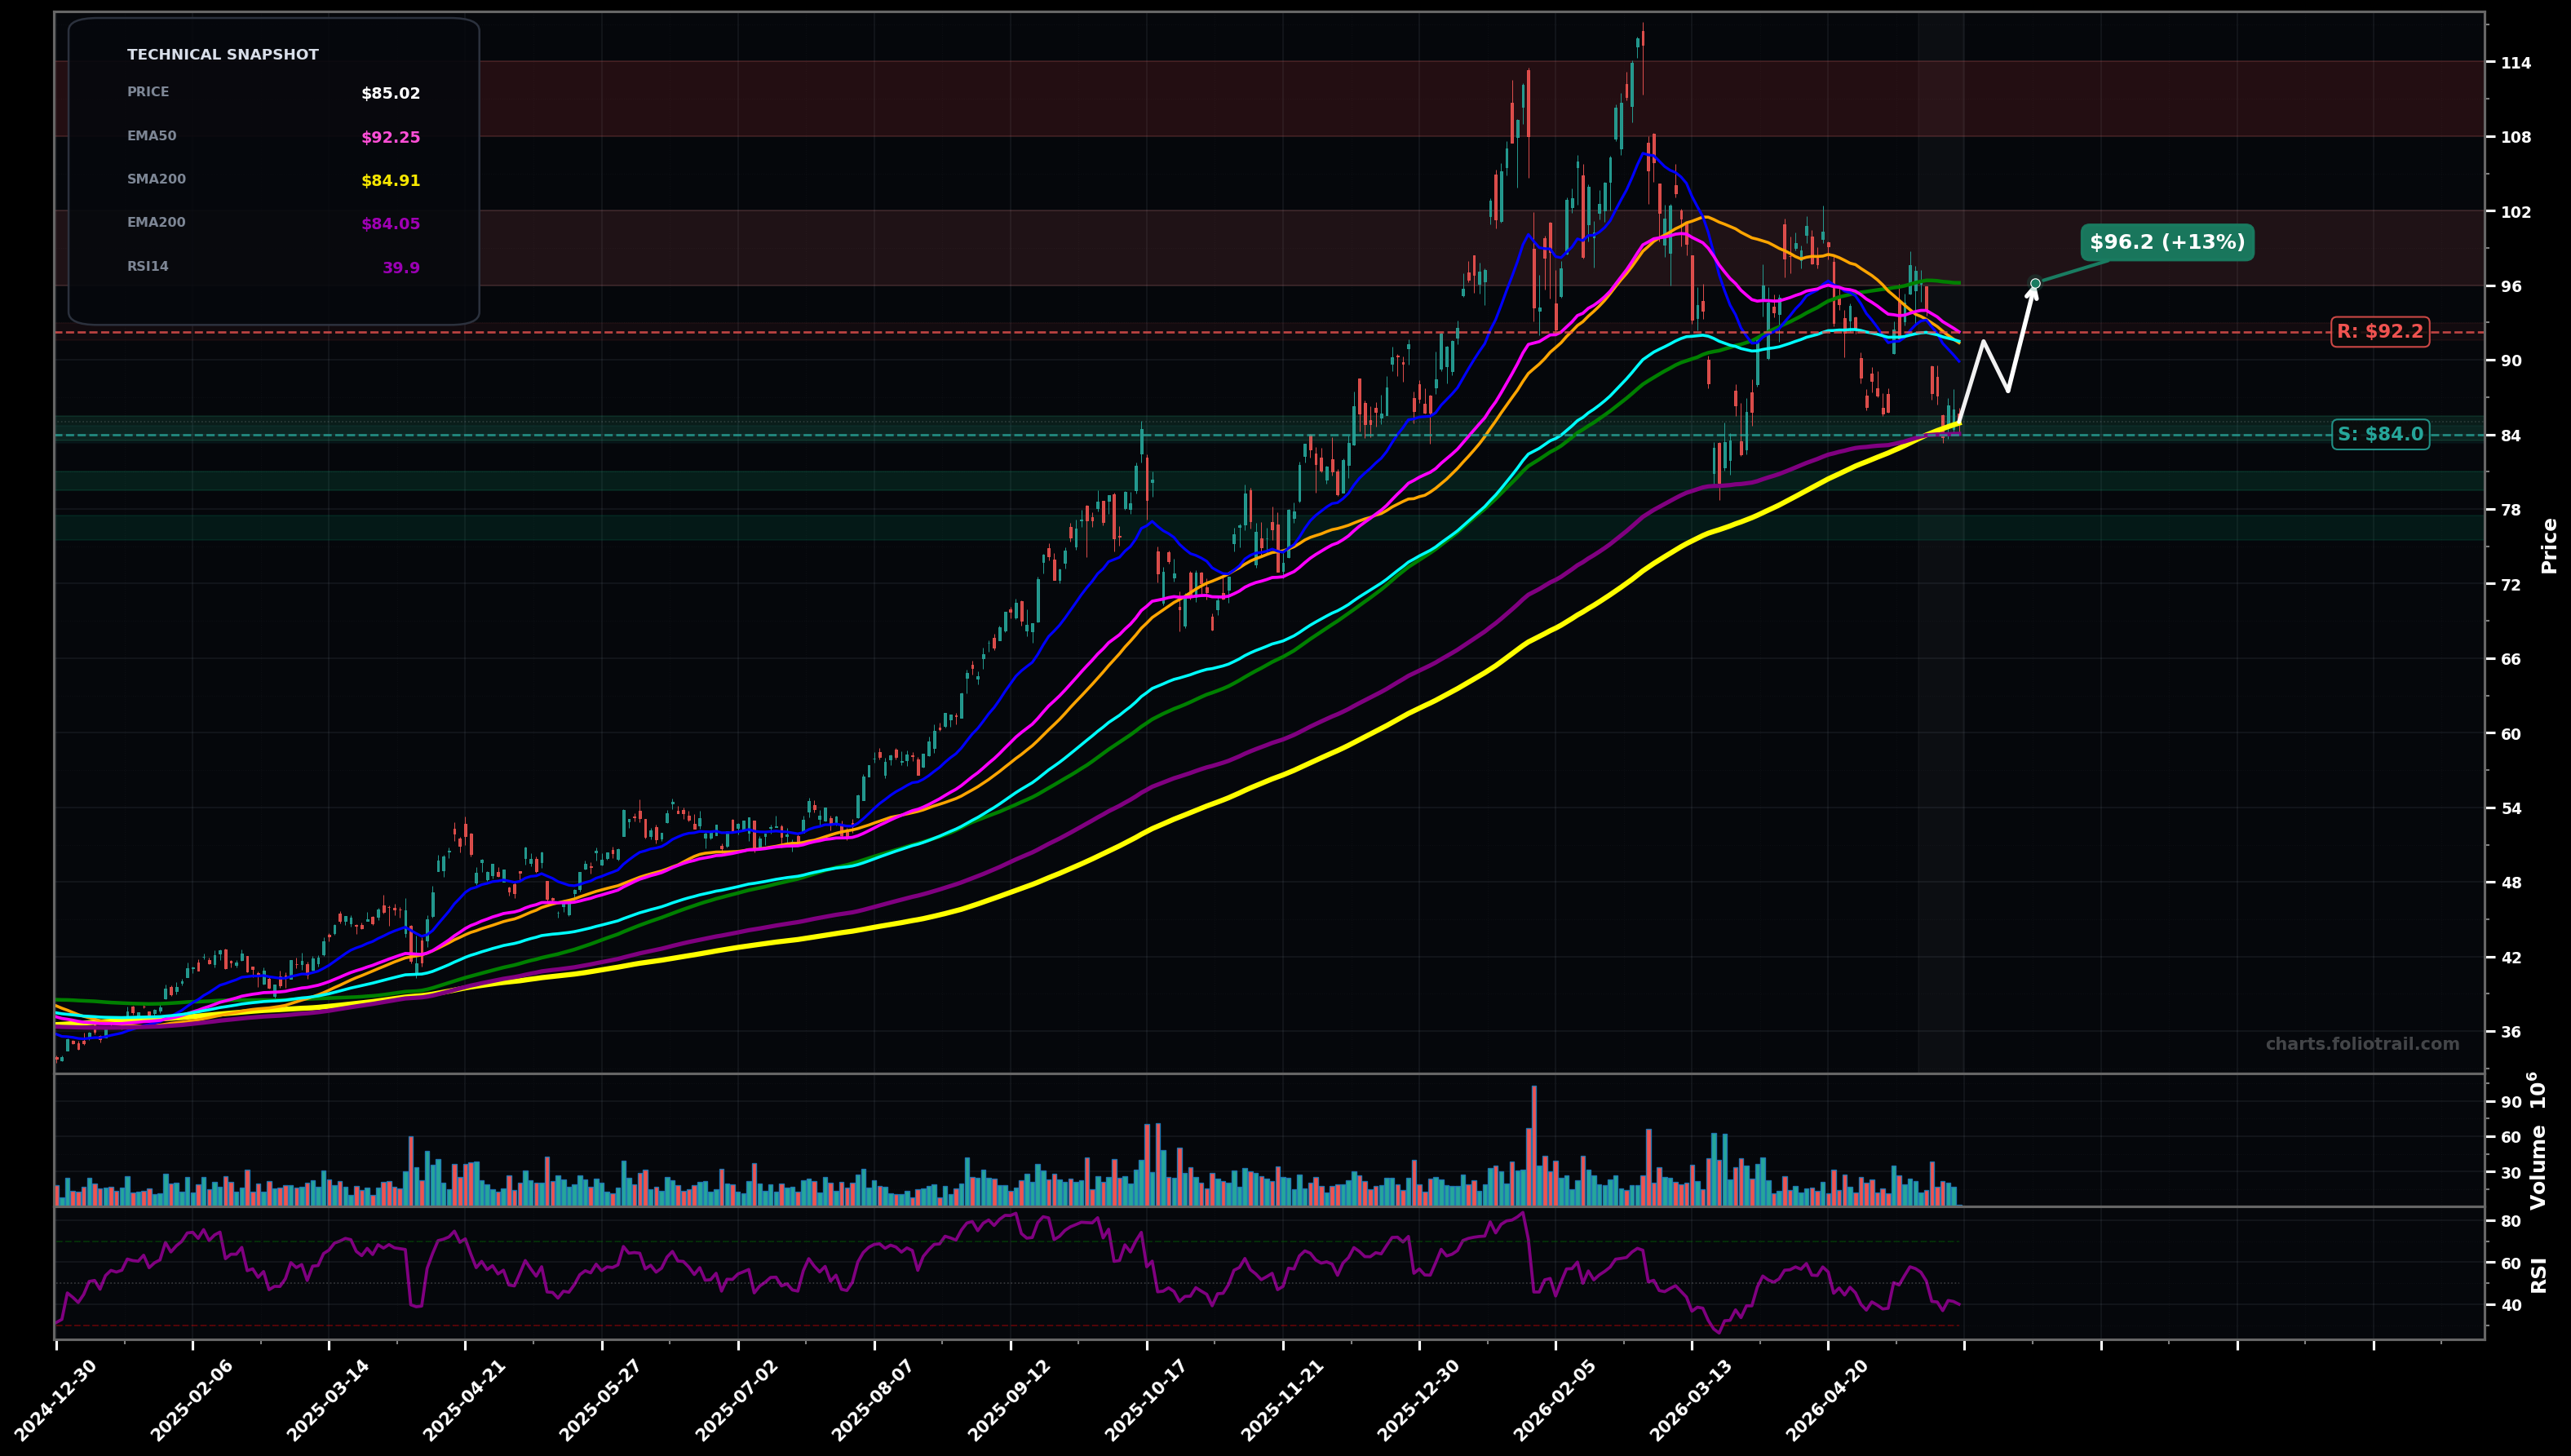
As of May 22, 2026, GDX (VanEck Gold Miners ETF) is in a downtrend state on the daily chart, with a confidence level of 72%. Key support is at $84.0 and key resistance at $92.2. Price at $85.02 is below EMA50 ($92.25) & EMA100 ($91.50) and pressing the rising long-term base near SMA200/EMA200 (~$84–$85); RSI-14 ~39.9 (weak momentum).
Base-at-200dma then bounce: buyers defend the $84–$85 long-term MA confluence, forming a swing low and pushing a mean-reversion rally back into the $91–$96 supply zone (likely lower high unless reclaimed). Prob ~60%.
Breakdown continuation: a decisive close under $84 triggers stops, turns the 200-day area into resistance, and price slides toward the next demand pocket in the high-$70s/low-$80s (Fibo-style retrace of the prior impulse). Prob ~40%.
Daily close below $84.00 (loss of EMA200/SMA200 area) confirms continued downtrend pressure.
Two consecutive daily closes above $92.25 (EMA50) invalidate the immediate downtrend setup.
Start at the EMA200/SMA200 confluence; add on breakdown to next horizontal demand; heavy add near deeper retrace/support pocket if selling accelerates.
Trim into the MA-supply zone first, trim harder near prior distribution/major swing-resistance, and fully exit if price becomes historically stretched above former highs.
As of May 22, 2026, GDX (VanEck Gold Miners ETF) is in a downtrend state on the daily chart with 72% confidence. Price at $85.02 is below EMA50 ($92.25) & EMA100 ($91.50) and pressing the rising long-term base near SMA200/EMA200 (~$84–$85); RSI-14 ~39.9 (weak momentum).
On the daily timeframe, GDX has key support at $84.0 and key resistance at $92.2. The most likely scenario (bullish) targets $91.5 and $96.2, with a revert level at $87.5.
GDX (VanEck Gold Miners ETF) is currently classified as downtrend on the daily chart, with 72% confidence. Confirmation requires: Daily close below $84.00 (loss of EMA200/SMA200 area) confirms continued downtrend pressure. This would be invalidated by: Two consecutive daily closes above $92.25 (EMA50) invalidate the immediate downtrend setup.
The most likely scenario (bullish) targets $91.5 and $96.2, with a revert level at $87.5. The alternative scenario (bearish) targets $80.0 and $76.0.
Multi-layer AI agents analyse 200+ stocks across daily, weekly, and monthly timeframes — producing market state classifications, price scenarios with targets, and position entry/exit levels. Daily charts updated every trading day at 6 PM ET. Weekly charts refresh Fridays. Monthly charts refresh on the last trading day of each month. No paywall. No sign-up required.
Built by Foliotrail.
All content on this website — including charts, analysis, price targets, support/resistance levels, and position zones — is generated entirely by AI and provided for educational and informational purposes only.
This is not financial advice. NEXUSNOIR VENTURES SL (the operator of this website) is not a registered investment adviser or broker-dealer. You should not make investment decisions based solely on this information. Always do your own research and consult a qualified financial advisor.
By continuing, you acknowledge that you have read and agree to our full disclaimer & terms of use and privacy policy.