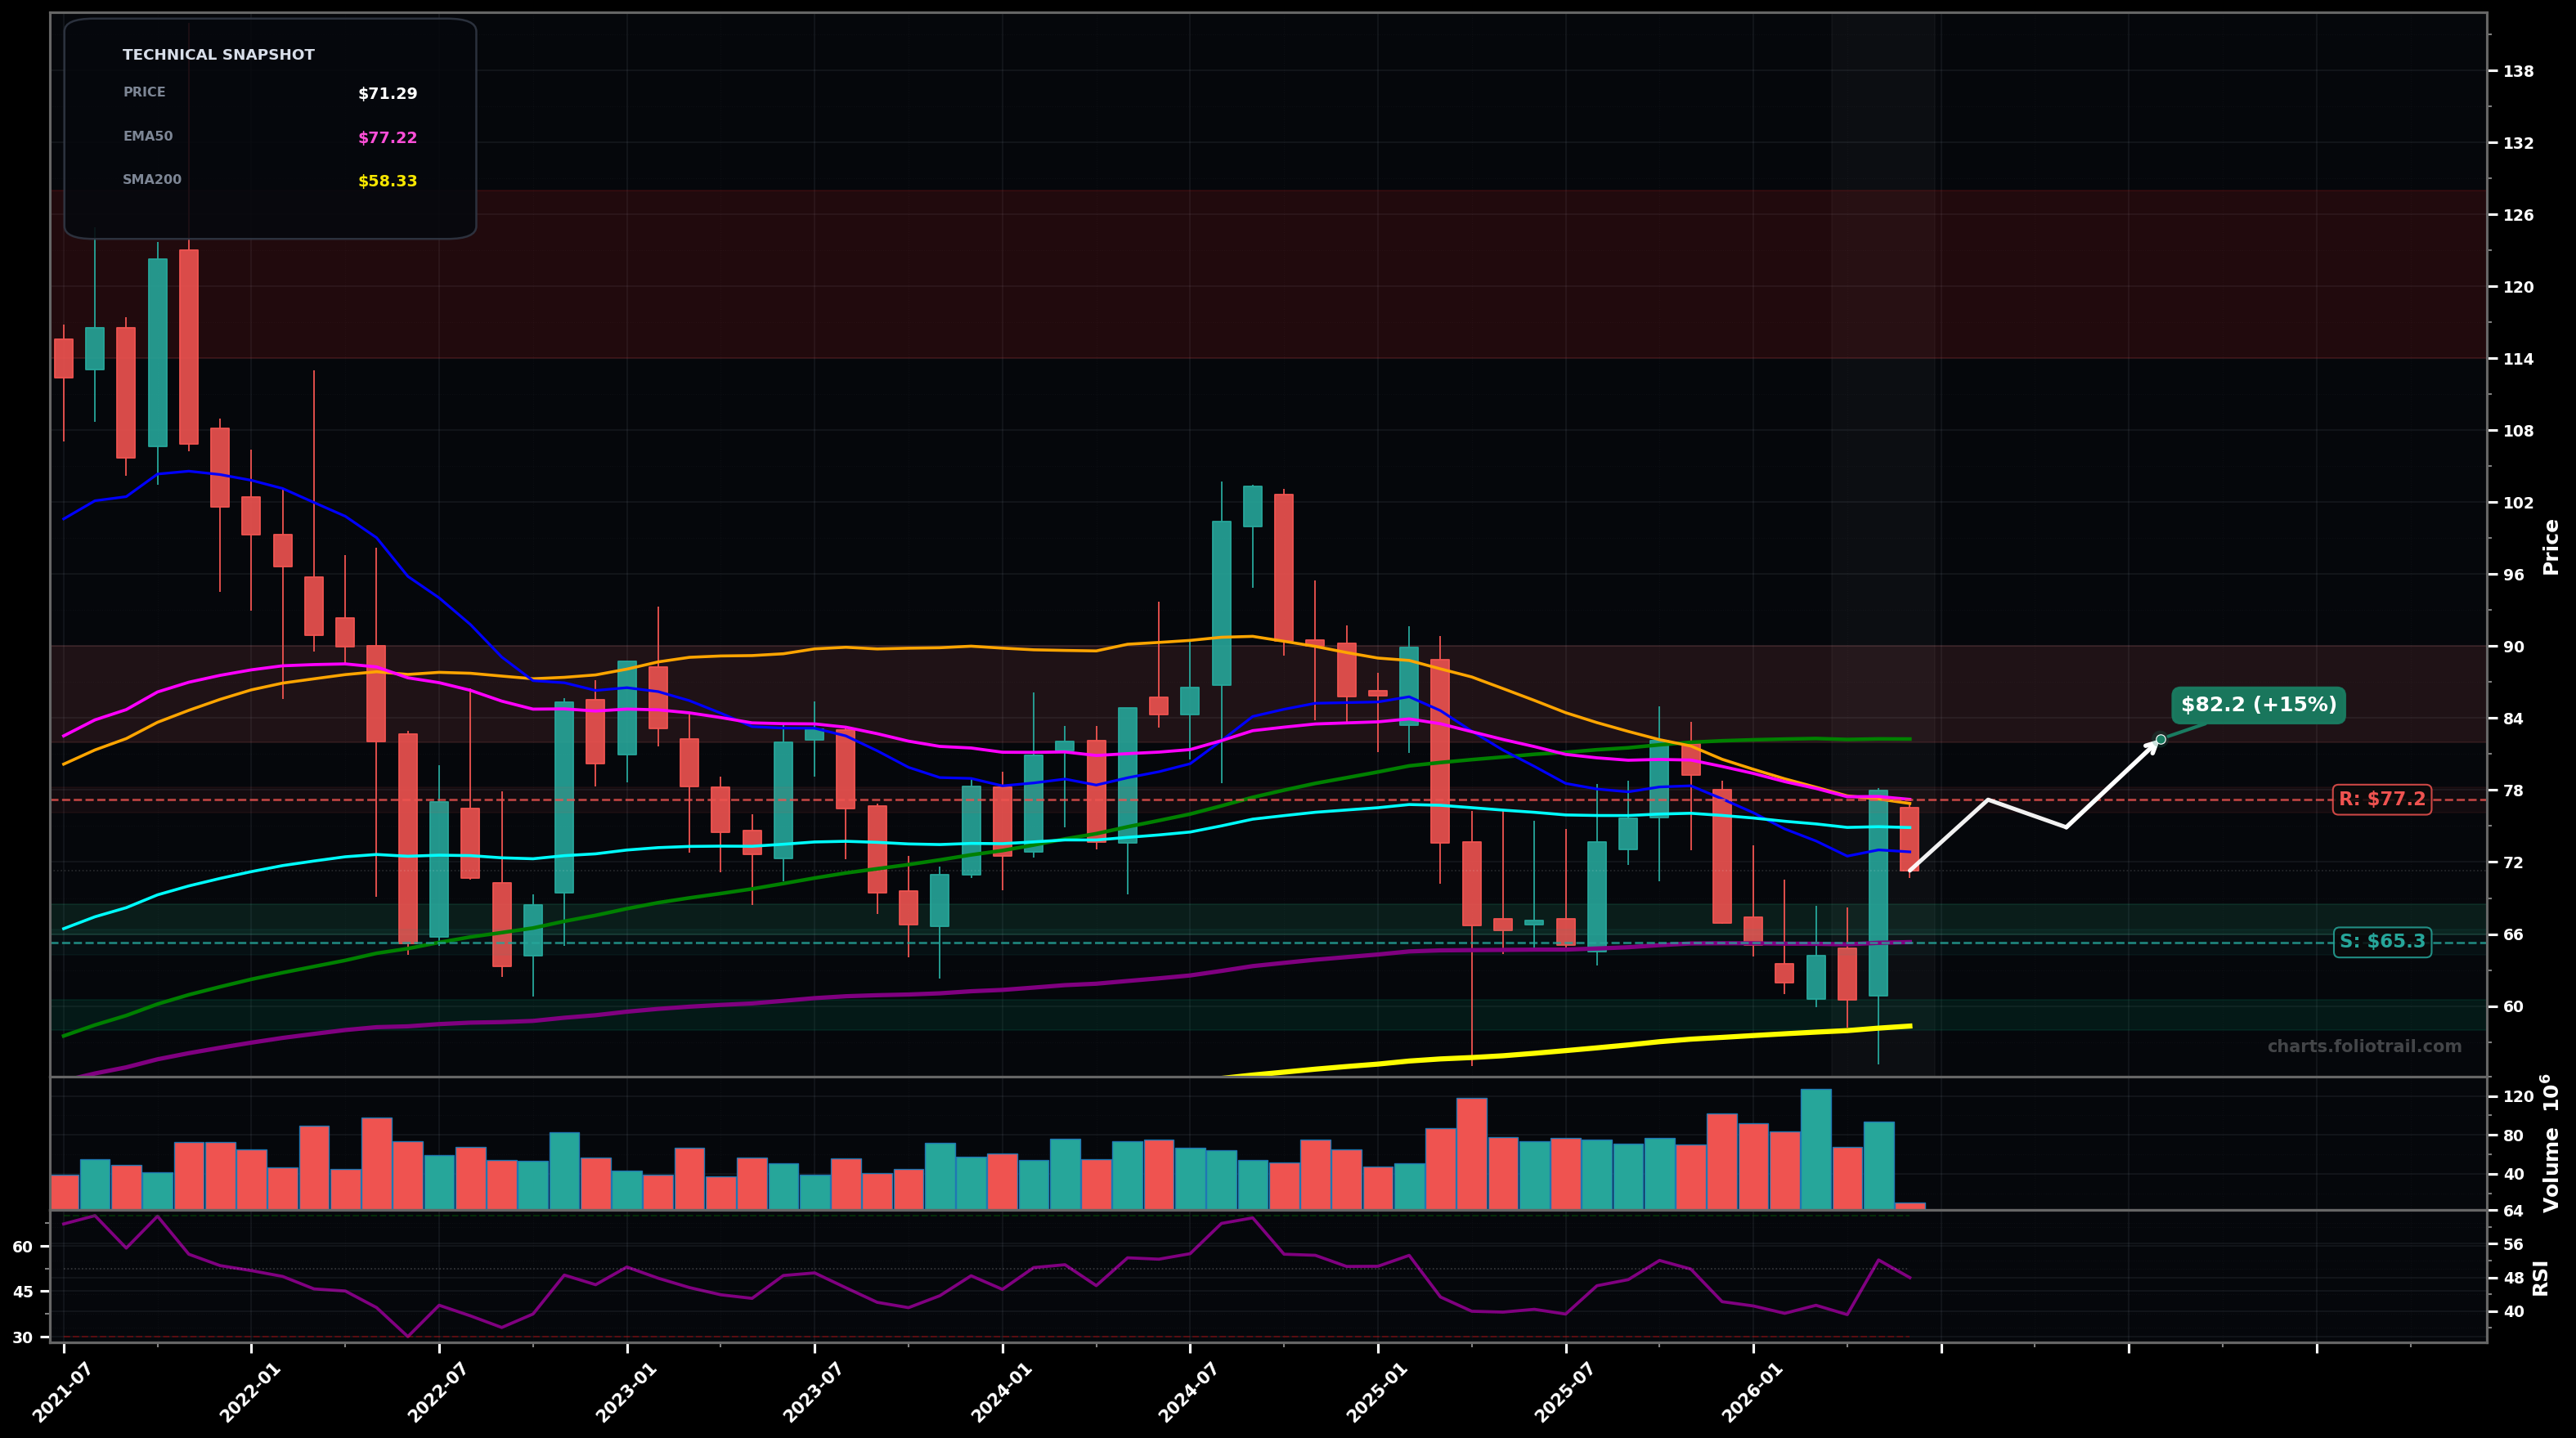
As of June 03, 2026, BBY (Best Buy Co., Inc.) is in a choppy range state on the monthly chart, with a confidence level of 62%. Key support is at $65.3 and key resistance at $77.2. Monthly bounce from the ~$60-$62 area into ~$78 then pullback; price ~$71.29 sits below EMA50/EMA100 and below the falling SMA50, with RSI ~48 (neutral).
Range continuation: price holds $65-$66 (EMA200 zone) and grinds back toward the $76-$77 (EMA50) area; a breakout attempt likely stalls near $82-$84 (SMA100 / prior supply). Prob ~55%.
Bearish rollover: rejection from $74-$77 leads to a breakdown of $65 (EMA200) and a sweep toward the long-term base around $58-$60 (SMA200 / prior swing support). Prob ~45%.
2+ monthly closes holding above $77.20 (EMA50) and then a close above $82.25 (SMA100).
Monthly close below $65.30 (EMA200), especially if followed by a close below $58.30 (SMA200).
Layered bids around EMA200 (~$65) then the 2022/2026 base support, with heavy adds near SMA200 (~$58) where long-term mean reversion typically triggers.
Trim into major overhead supply (SMA100/SMA50 zone then prior 2024 spike highs), and fully exit if price revisits the upper historical band where prior cycle distribution occurred.
As of June 03, 2026, BBY (Best Buy Co., Inc.) is in a choppy range state on the monthly chart with 62% confidence. Monthly bounce from the ~$60-$62 area into ~$78 then pullback; price ~$71.29 sits below EMA50/EMA100 and below the falling SMA50, with RSI ~48 (neutral).
On the monthly timeframe, BBY has key support at $65.3 and key resistance at $77.2. The most likely scenario (bullish) targets $77.2 and $82.2, with a revert level at $74.9.
BBY (Best Buy Co., Inc.) is currently classified as choppy range on the monthly chart, with 62% confidence. Confirmation requires: 2+ monthly closes holding above $77.20 (EMA50) and then a close above $82.25 (SMA100). This would be invalidated by: Monthly close below $65.30 (EMA200), especially if followed by a close below $58.30 (SMA200).
The most likely scenario (bullish) targets $77.2 and $82.2, with a revert level at $74.9. The alternative scenario (bearish) targets $65.3 and $58.3.
Multi-layer AI agents analyse 200+ stocks across daily, weekly, and monthly timeframes — producing market state classifications, price scenarios with targets, and position entry/exit levels. Daily charts updated every trading day at 6 PM ET. Weekly charts refresh Fridays. Monthly charts refresh on the last trading day of each month. No paywall. No sign-up required.
Built by Foliotrail.
All content on this website — including charts, analysis, price targets, support/resistance levels, and position zones — is generated entirely by AI and provided for educational and informational purposes only.
This is not financial advice. NEXUSNOIR VENTURES SL (the operator of this website) is not a registered investment adviser or broker-dealer. You should not make investment decisions based solely on this information. Always do your own research and consult a qualified financial advisor.
By continuing, you acknowledge that you have read and agree to our full disclaimer & terms of use and privacy policy.