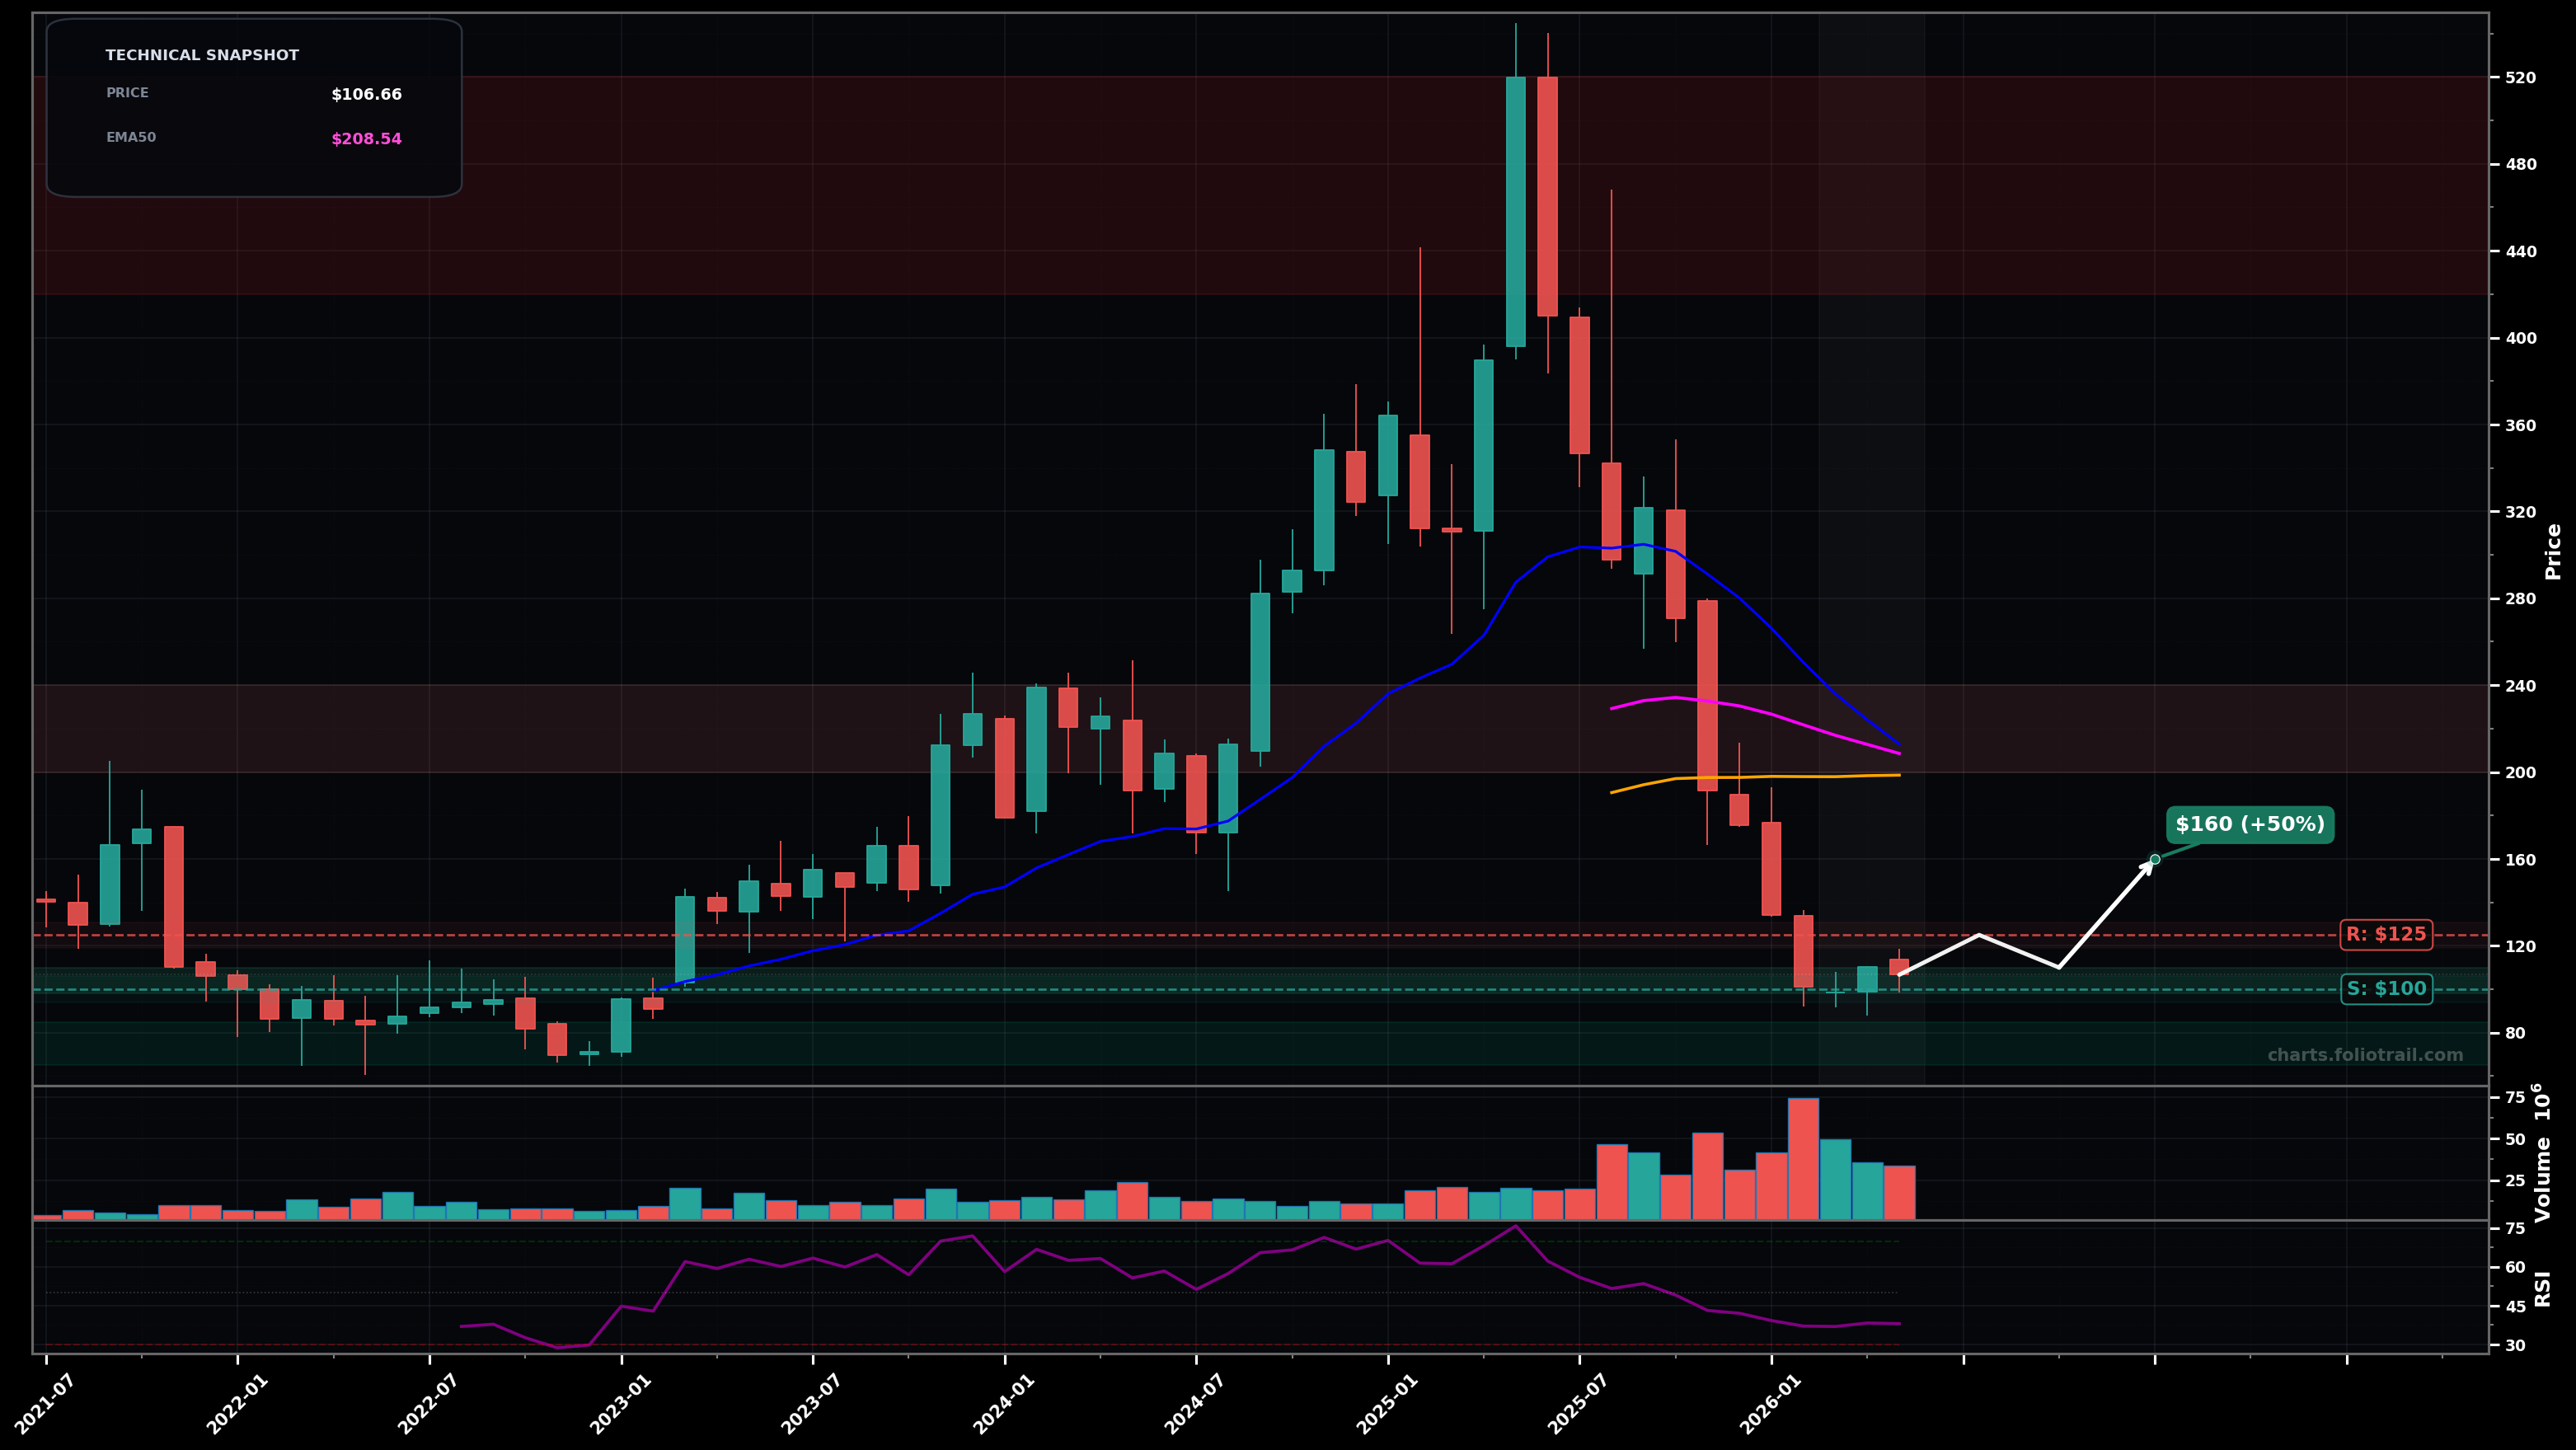
As of May 22, 2026, DUOL (Duolingo, Inc.) is in a bottoming attempt state on the monthly chart, with a confidence level of 56%. Key support is at $100 and key resistance at $125. After a steep selloff from the ~$500+ peak, price is basing around ~$100-$115; still far below key MAs (SMA50/EMA50/EMA20) with RSI-14 near ~38.
Base-building continues: price holds ~$100 and grinds up into a mean-reversion rally toward the first broken support band, then stalls below major MAs.
Downtrend resumes: the base fails and price breaks the ~$100 swing-low reference, triggering another leg lower (capitulation risk).
Monthly close above $125 (first HH/HL attempt and range breakout from the ~$100-$115 base).
Monthly close below $95 (loss of the current swing-low/base area).
Scale-in around the current base (~$100) and prior pivots; add more if price undercuts support toward likely fib retrace/over-extension zones, with heavy adds only on a deeper flush.
Trim into major mean-reversion areas near EMA50/SMA50 zone first (~$200+), then prior consolidation/supply (~$300), and fully exit into a retest of the blow-off top region (~$420-$520).
As of May 22, 2026, DUOL (Duolingo, Inc.) is in a bottoming attempt state on the monthly chart with 56% confidence. After a steep selloff from the ~$500+ peak, price is basing around ~$100-$115; still far below key MAs (SMA50/EMA50/EMA20) with RSI-14 near ~38.
On the monthly timeframe, DUOL has key support at $100 and key resistance at $125. The most likely scenario (bullish) targets $125 and $160, with a revert level at $110.
DUOL (Duolingo, Inc.) is currently classified as bottoming attempt on the monthly chart, with 56% confidence. Confirmation requires: Monthly close above $125 (first HH/HL attempt and range breakout from the ~$100-$115 base). This would be invalidated by: Monthly close below $95 (loss of the current swing-low/base area).
The most likely scenario (bullish) targets $125 and $160, with a revert level at $110. The alternative scenario (bearish) targets $85.0 and $65.0.
Multi-layer AI agents analyse 200+ stocks across daily, weekly, and monthly timeframes — producing market state classifications, price scenarios with targets, and position entry/exit levels. Daily charts updated every trading day at 6 PM ET. Weekly charts refresh Fridays. Monthly charts refresh on the last trading day of each month. No paywall. No sign-up required.
Built by Foliotrail.
All content on this website — including charts, analysis, price targets, support/resistance levels, and position zones — is generated entirely by AI and provided for educational and informational purposes only.
This is not financial advice. NEXUSNOIR VENTURES SL (the operator of this website) is not a registered investment adviser or broker-dealer. You should not make investment decisions based solely on this information. Always do your own research and consult a qualified financial advisor.
By continuing, you acknowledge that you have read and agree to our full disclaimer & terms of use and privacy policy.