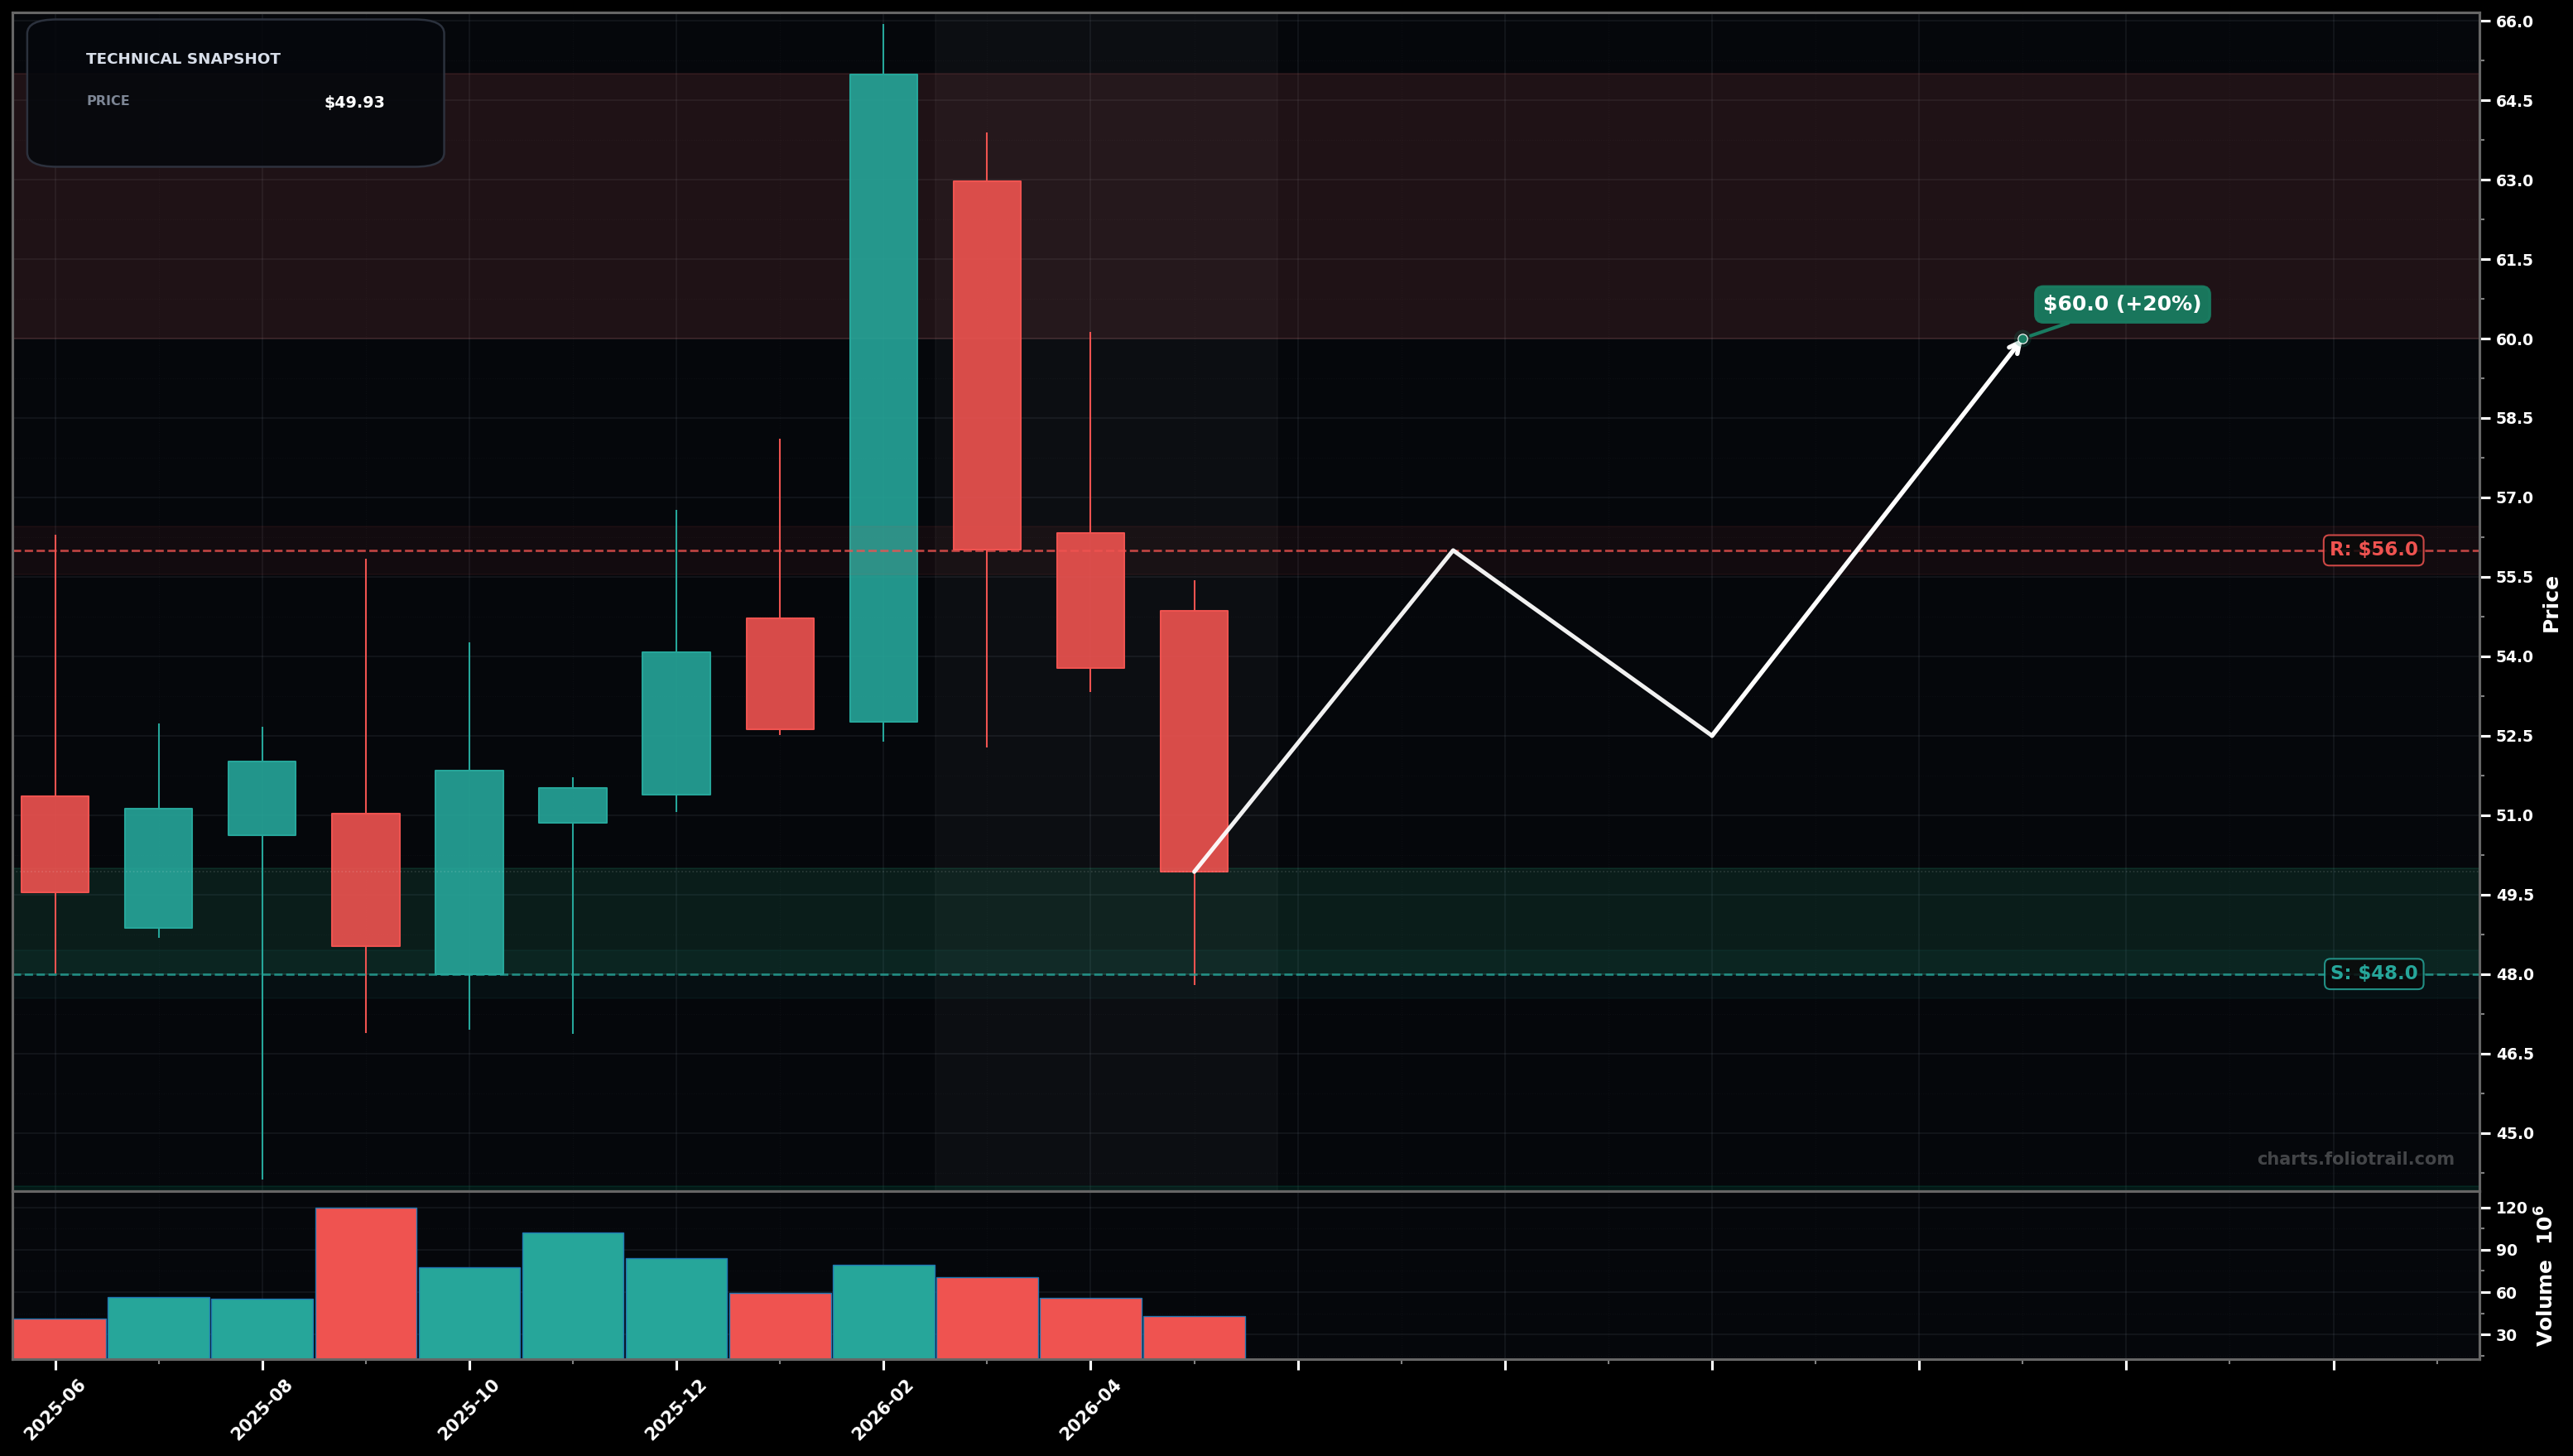
As of May 22, 2026, AMRZ (Amrize Ltd) is in a volatility expansion state on the monthly chart, with a confidence level of 72%. Key support is at $48.0 and key resistance at $56.0. After a spike to ~$65, AMRZ printed consecutive bearish monthly candles and is pulling back to ~$49.93 with a wide-range selloff candle into the prior base area (~$48–$50).
Mean-reversion bounce from the ~$48–$50 demand zone (prior pivot area) followed by a corrective retest of the breakdown zone; price likely forms a higher low on the next pullback (Elliott: Wave A down from ~$65 likely in progress/ending, then Wave B bounce).
Support fails and the post-spike unwind continues; a monthly close below the ~$48 pivot opens a deeper retracement of the full impulse (Fibo: move from ~$45 swing-low to ~$65 swing-high implies key retrace magnet near ~$50 (0.786) already being tested; break can seek the ~$45 origin area).
Another monthly close below $48.00 (loss of the prior pivot/base) would confirm volatility resolving bearishly.
A monthly close back above $56.00 would invalidate immediate bearish resolution and favor a renewed upswing.
Primary demand/pivot sits near ~$48–$50; if that breaks, next logical swing-low reference is ~$45, with capitulation risk toward low-$40s before a durable base forms.
The ~$60–$65 zone is the first major supply from the spike/rejection; above ~$65 enters price-discovery where extensions become more likely to mean-revert, so progressively trim into strength.
As of May 22, 2026, AMRZ (Amrize Ltd) is in a volatility expansion state on the monthly chart with 72% confidence. After a spike to ~$65, AMRZ printed consecutive bearish monthly candles and is pulling back to ~$49.93 with a wide-range selloff candle into the prior base area (~$48–$50).
On the monthly timeframe, AMRZ has key support at $48.0 and key resistance at $56.0. The most likely scenario (bullish) targets $56.0 and $60.0, with a revert level at $52.5.
AMRZ (Amrize Ltd) is currently classified as volatility expansion on the monthly chart, with 72% confidence. Confirmation requires: Another monthly close below $48.00 (loss of the prior pivot/base) would confirm volatility resolving bearishly. This would be invalidated by: A monthly close back above $56.00 would invalidate immediate bearish resolution and favor a renewed upswing.
The most likely scenario (bullish) targets $56.0 and $60.0, with a revert level at $52.5. The alternative scenario (bearish) targets $45.0 and $42.0.
Multi-layer AI agents analyse 200+ stocks across daily, weekly, and monthly timeframes — producing market state classifications, price scenarios with targets, and position entry/exit levels. Daily charts updated every trading day at 6 PM ET. Weekly charts refresh Fridays. Monthly charts refresh on the last trading day of each month. No paywall. No sign-up required.
Built by Foliotrail.
All content on this website — including charts, analysis, price targets, support/resistance levels, and position zones — is generated entirely by AI and provided for educational and informational purposes only.
This is not financial advice. NEXUSNOIR VENTURES SL (the operator of this website) is not a registered investment adviser or broker-dealer. You should not make investment decisions based solely on this information. Always do your own research and consult a qualified financial advisor.
By continuing, you acknowledge that you have read and agree to our full disclaimer & terms of use and privacy policy.