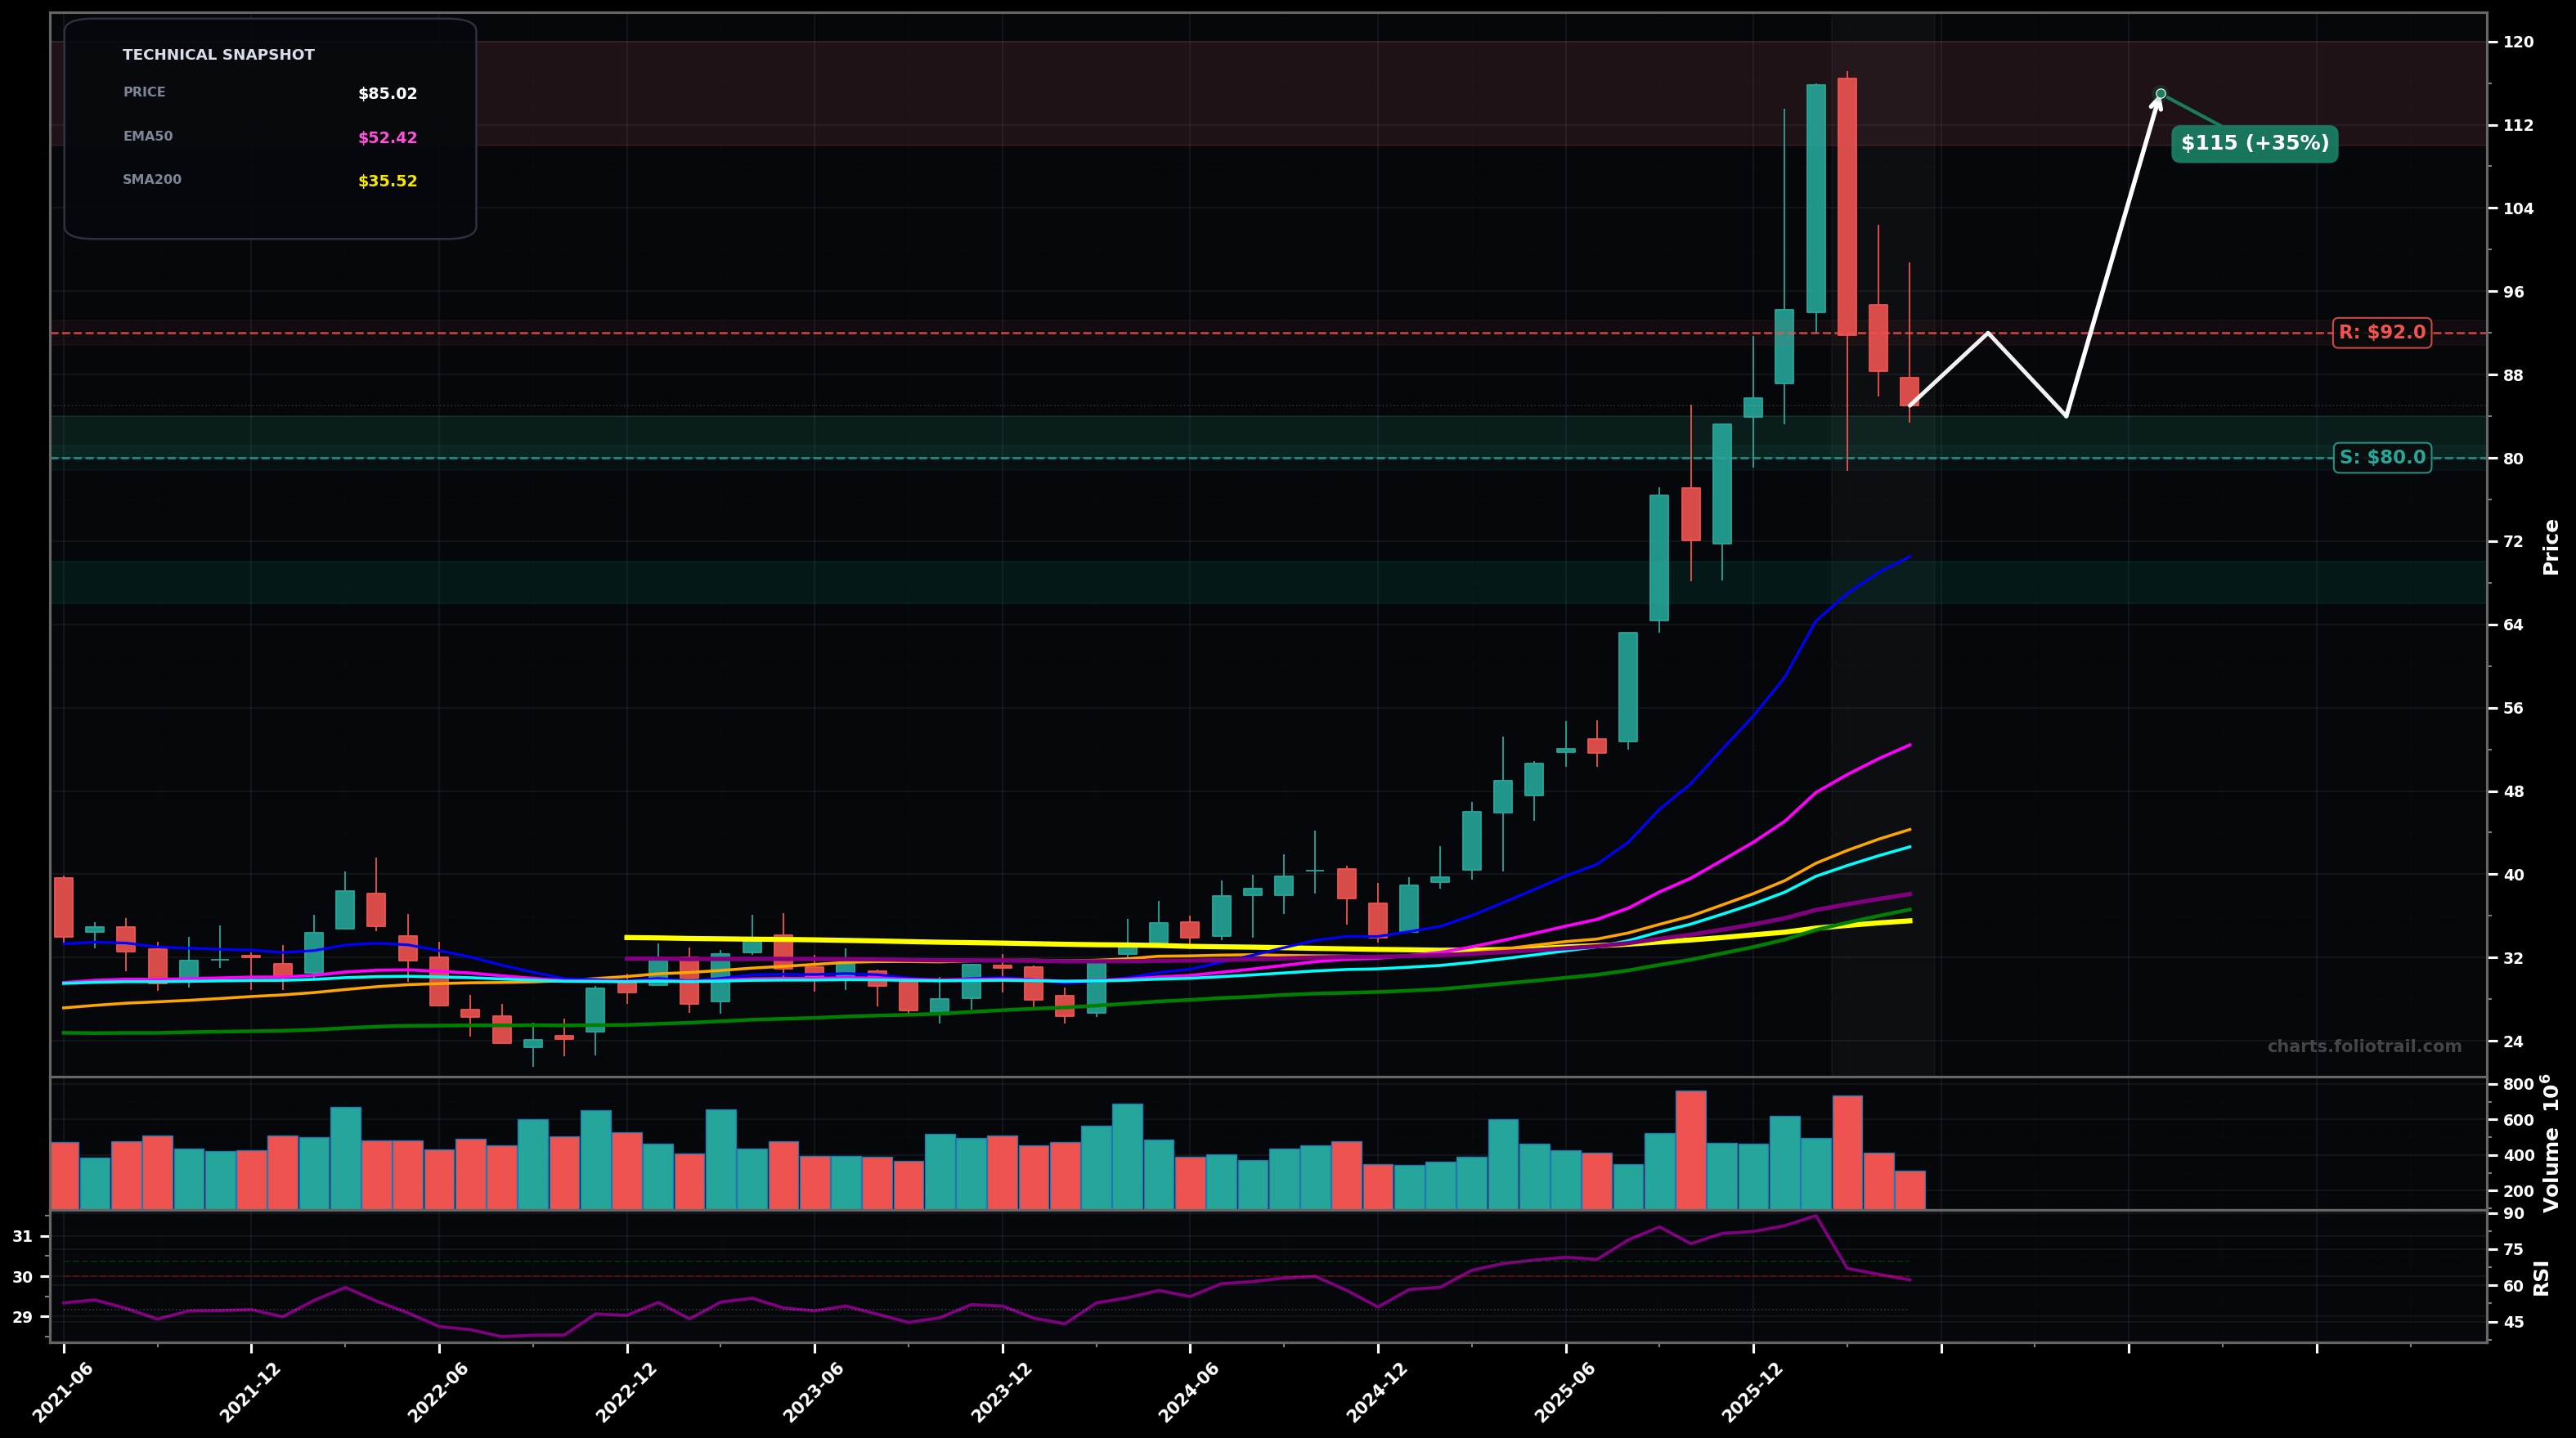
As of May 22, 2026, GDX (VanEck Gold Miners ETF) is in a uptrend state on the monthly chart, with a confidence level of 72%. Key support is at $80.0 and key resistance at $92.0. Monthly uptrend after a sharp blow-off to ~$114–$116, followed by a 2–3 candle pullback; price still well above rising EMA50/EMA100 with RSI cooling (~62).
Bullish continuation: pullback stabilizes above ~$80 and forms a higher low; then reclaim of ~$92 leads to a retest of the blow-off zone. (Prob ~60%) Elliott view: likely Wave 4-style correction in progress after an extended Wave 3 run; Fib expectation: 0.382–0.5 retrace of the ~$32→~$115 leg sits roughly in the ~$83–$74 area.
Deeper correction: failure to reclaim ~$92 and a break below ~$80 triggers a larger mean-reversion toward the rising long MAs (still far below) and prior breakout area. (Prob ~40%) Elliott view: Wave 4 becomes a larger A-B-C, targeting deeper Fib (0.5–0.618) before trend resumes.
Monthly close back above $92 would confirm continuation after the pullback
Monthly close below $70 would invalidate the current uptrend structure (break of key swing support/impulse base)
Start near first post-blowoff support (~$80) and likely 0.382 retrace; add into 0.5 area (~$74); heavy add only if a deeper Wave-4/A-B-C flush reaches ~0.618 / prior breakout zone (~$66–$70).
Trim into prior peak/supply ($110–$120); more trimming if price extends into a new impulse high well above prior ATH with stretched distance vs EMA50; close if a multi-year euphoric extension prints far above trend MAs (parabolic risk).
As of May 22, 2026, GDX (VanEck Gold Miners ETF) is in a uptrend state on the monthly chart with 72% confidence. Monthly uptrend after a sharp blow-off to ~$114–$116, followed by a 2–3 candle pullback; price still well above rising EMA50/EMA100 with RSI cooling (~62).
On the monthly timeframe, GDX has key support at $80.0 and key resistance at $92.0. The most likely scenario (bullish) targets $92.0 and $115, with a revert level at $84.0.
GDX (VanEck Gold Miners ETF) is currently classified as uptrend on the monthly chart, with 72% confidence. Confirmation requires: Monthly close back above $92 would confirm continuation after the pullback This would be invalidated by: Monthly close below $70 would invalidate the current uptrend structure (break of key swing support/impulse base)
The most likely scenario (bullish) targets $92.0 and $115, with a revert level at $84.0. The alternative scenario (bearish) targets $74.0 and $70.0.
Multi-layer AI agents analyse 200+ stocks across daily, weekly, and monthly timeframes — producing market state classifications, price scenarios with targets, and position entry/exit levels. Daily charts updated every trading day at 6 PM ET. Weekly charts refresh Fridays. Monthly charts refresh on the last trading day of each month. No paywall. No sign-up required.
Built by Foliotrail.
All content on this website — including charts, analysis, price targets, support/resistance levels, and position zones — is generated entirely by AI and provided for educational and informational purposes only.
This is not financial advice. NEXUSNOIR VENTURES SL (the operator of this website) is not a registered investment adviser or broker-dealer. You should not make investment decisions based solely on this information. Always do your own research and consult a qualified financial advisor.
By continuing, you acknowledge that you have read and agree to our full disclaimer & terms of use and privacy policy.