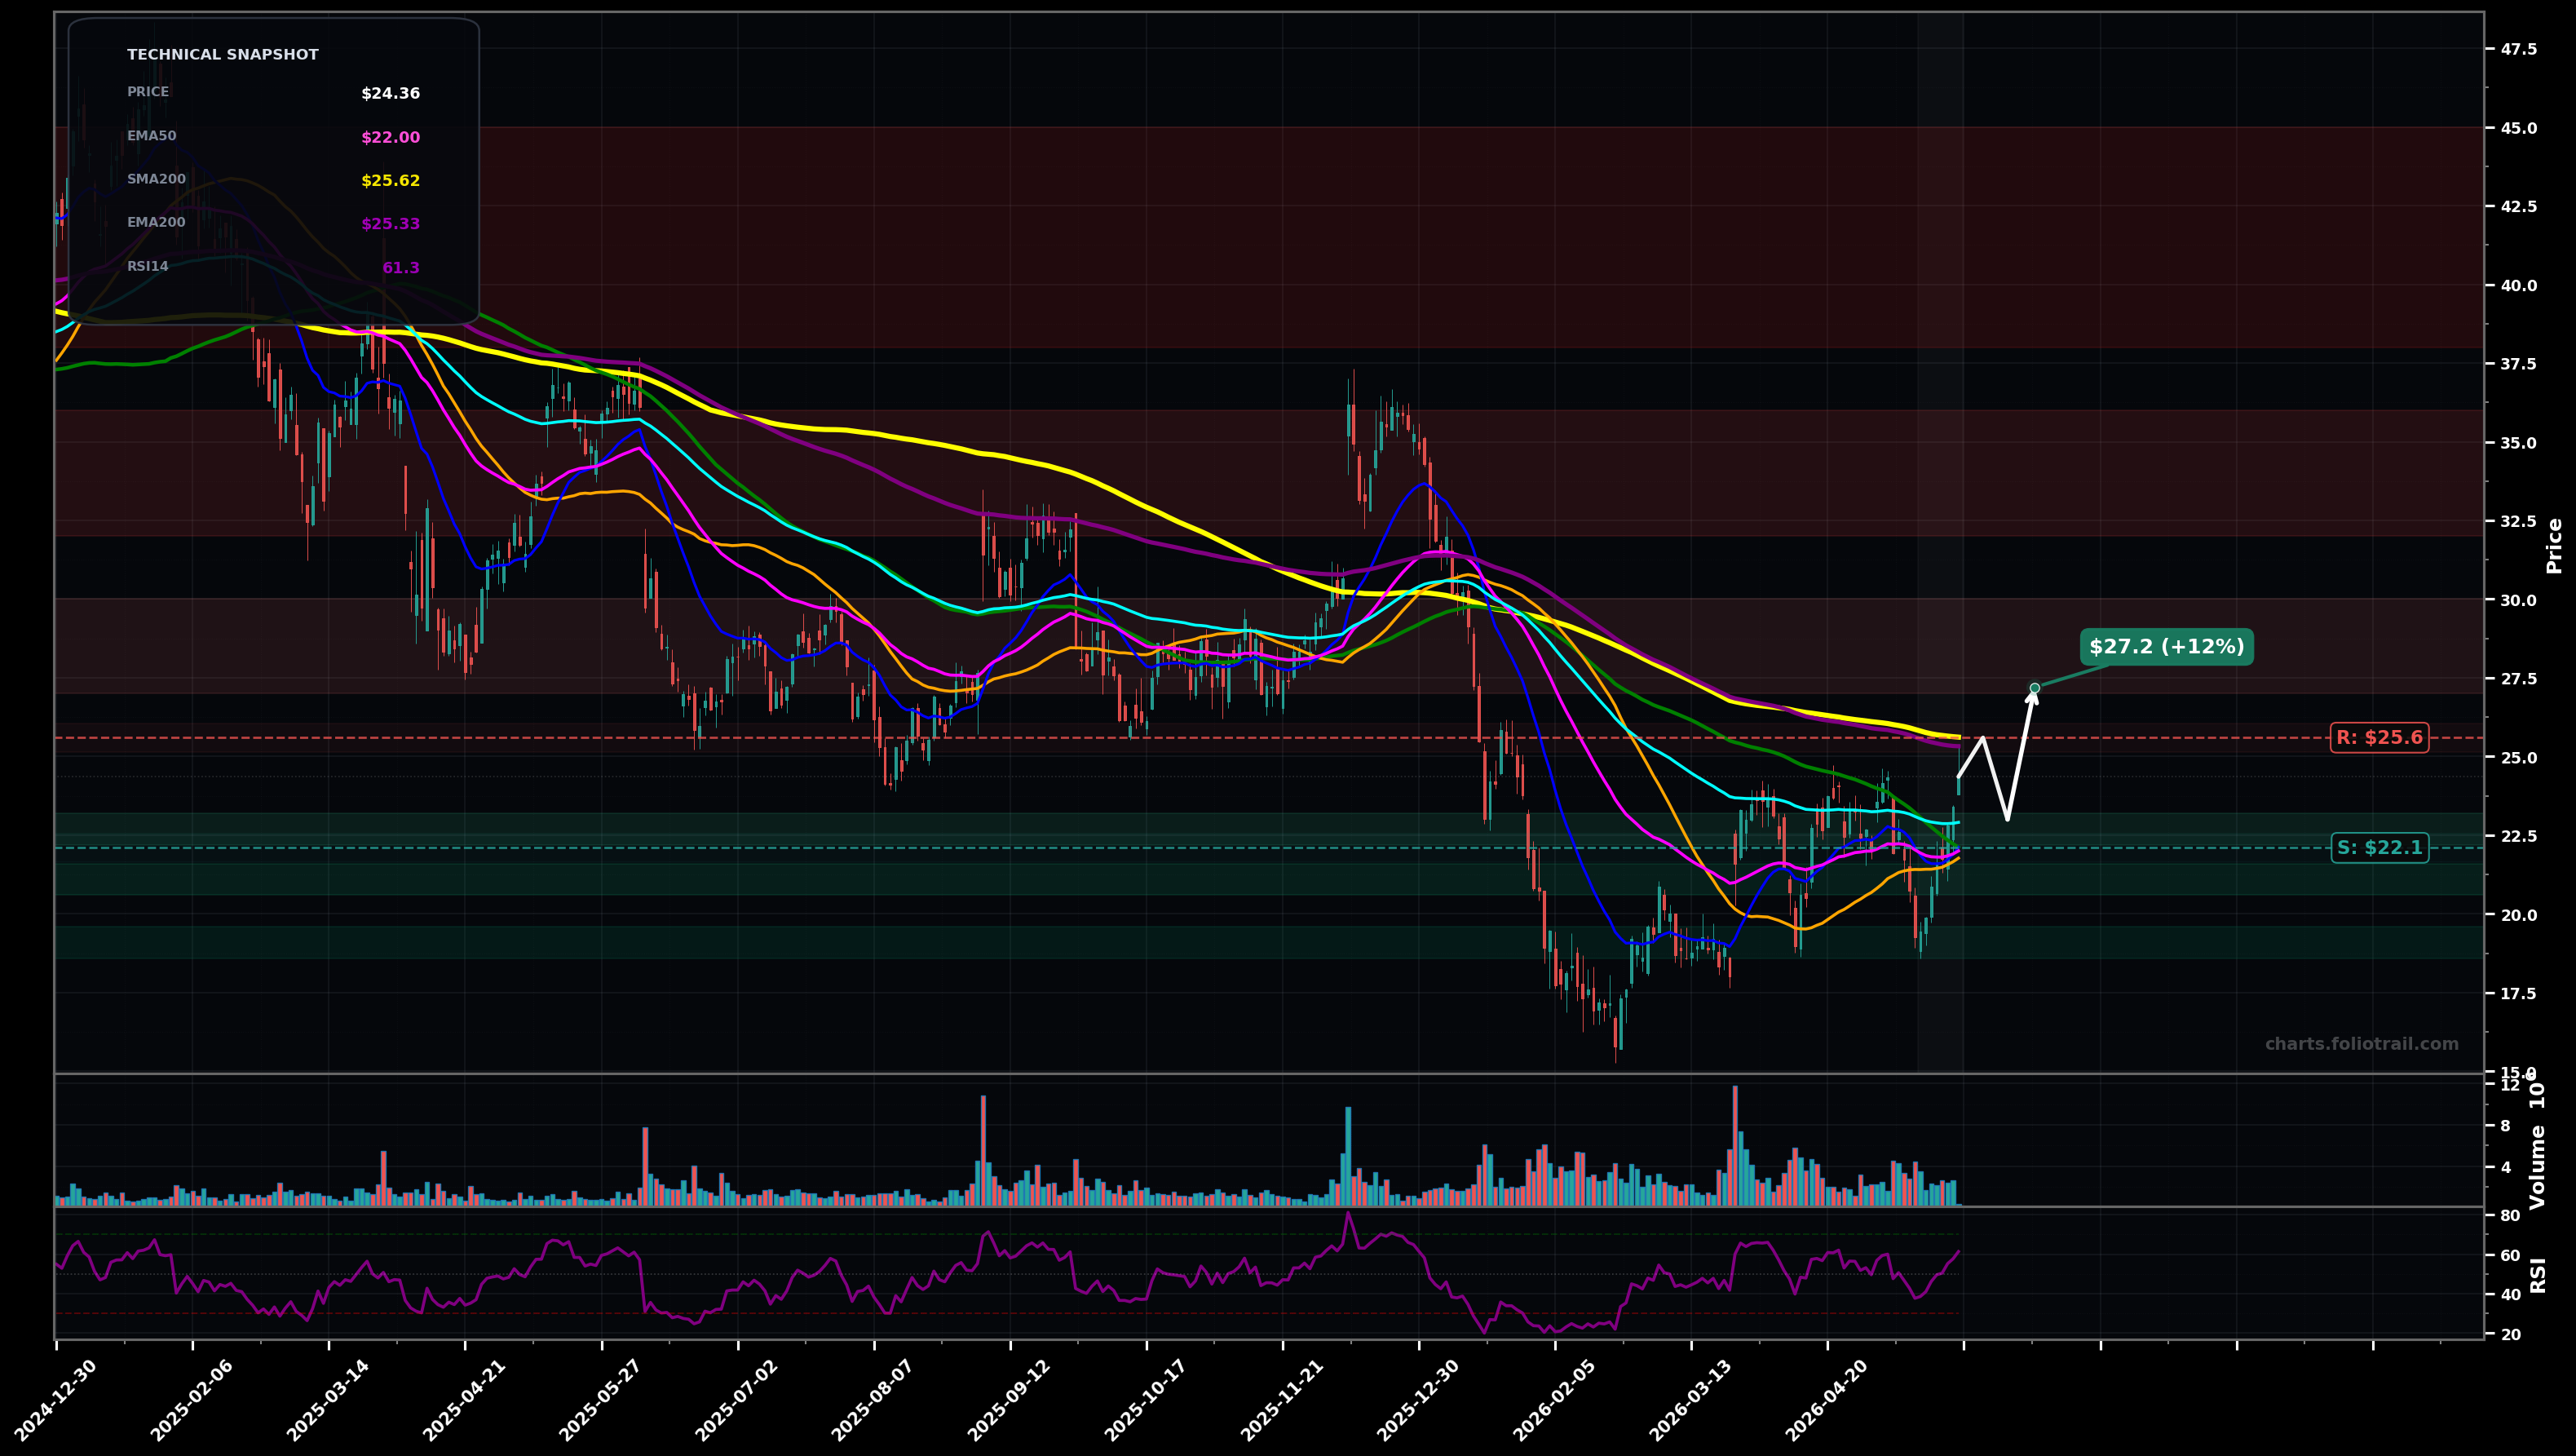
As of May 22, 2026, BRZE (Braze, Inc.) is in a breakout reversal state on the daily chart, with a confidence level of 62%. Key support is at $22.1 and key resistance at $25.6. Sharp rebound from the ~$19-$20 base and a strong push to ~$24.36, reclaiming the EMA50/EMA100 area with RSI ~61 (momentum improving) but still under the falling long-term MAs (SMA200/EMA200).
Bullish continuation: price consolidates above ~$22-$23, then grinds up into the heavy MA/structure band ($25-$27). If accepted above that band, a larger trend reversal toward low-$30s becomes plausible.
Failed reclaim / bull trap: rejection at the $25-$26 MA ceiling leads to a pullback into the prior range, retesting the breakout level and possibly the base if risk-off returns.
Daily closes hold above $23.00 and then break/hold above $25.60 (SMA200/EMA200 zone).
Daily close back below $22.10 (EMA100 area) would negate the breakout-reversal attempt.
Start near reclaimed EMA100/EMA50 support; add on deeper pullback toward prior range support; heavy add only on base retest near the swing low zone (~$19) where invalidation is clear.
Trims into overhead supply/major MA clusters first, then into likely Elliott Wave (C/3) extension zones; full exit only if price becomes extremely stretched vs long-term averages and prior distribution highs.
As of May 22, 2026, BRZE (Braze, Inc.) is in a breakout reversal state on the daily chart with 62% confidence. Sharp rebound from the ~$19-$20 base and a strong push to ~$24.36, reclaiming the EMA50/EMA100 area with RSI ~61 (momentum improving) but still under the falling long-term MAs (SMA200/EMA200).
On the daily timeframe, BRZE has key support at $22.1 and key resistance at $25.6. The most likely scenario (bullish) targets $25.6 and $27.2, with a revert level at $23.0.
BRZE (Braze, Inc.) is currently classified as breakout reversal on the daily chart, with 62% confidence. Confirmation requires: Daily closes hold above $23.00 and then break/hold above $25.60 (SMA200/EMA200 zone). This would be invalidated by: Daily close back below $22.10 (EMA100 area) would negate the breakout-reversal attempt.
The most likely scenario (bullish) targets $25.6 and $27.2, with a revert level at $23.0. The alternative scenario (bearish) targets $22.1 and $19.2.
Multi-layer AI agents analyse 200+ stocks across daily, weekly, and monthly timeframes — producing market state classifications, price scenarios with targets, and position entry/exit levels. Daily charts updated every trading day at 6 PM ET. Weekly charts refresh Fridays. Monthly charts refresh on the last trading day of each month. No paywall. No sign-up required.
Built by Foliotrail.
All content on this website — including charts, analysis, price targets, support/resistance levels, and position zones — is generated entirely by AI and provided for educational and informational purposes only.
This is not financial advice. NEXUSNOIR VENTURES SL (the operator of this website) is not a registered investment adviser or broker-dealer. You should not make investment decisions based solely on this information. Always do your own research and consult a qualified financial advisor.
By continuing, you acknowledge that you have read and agree to our full disclaimer & terms of use and privacy policy.