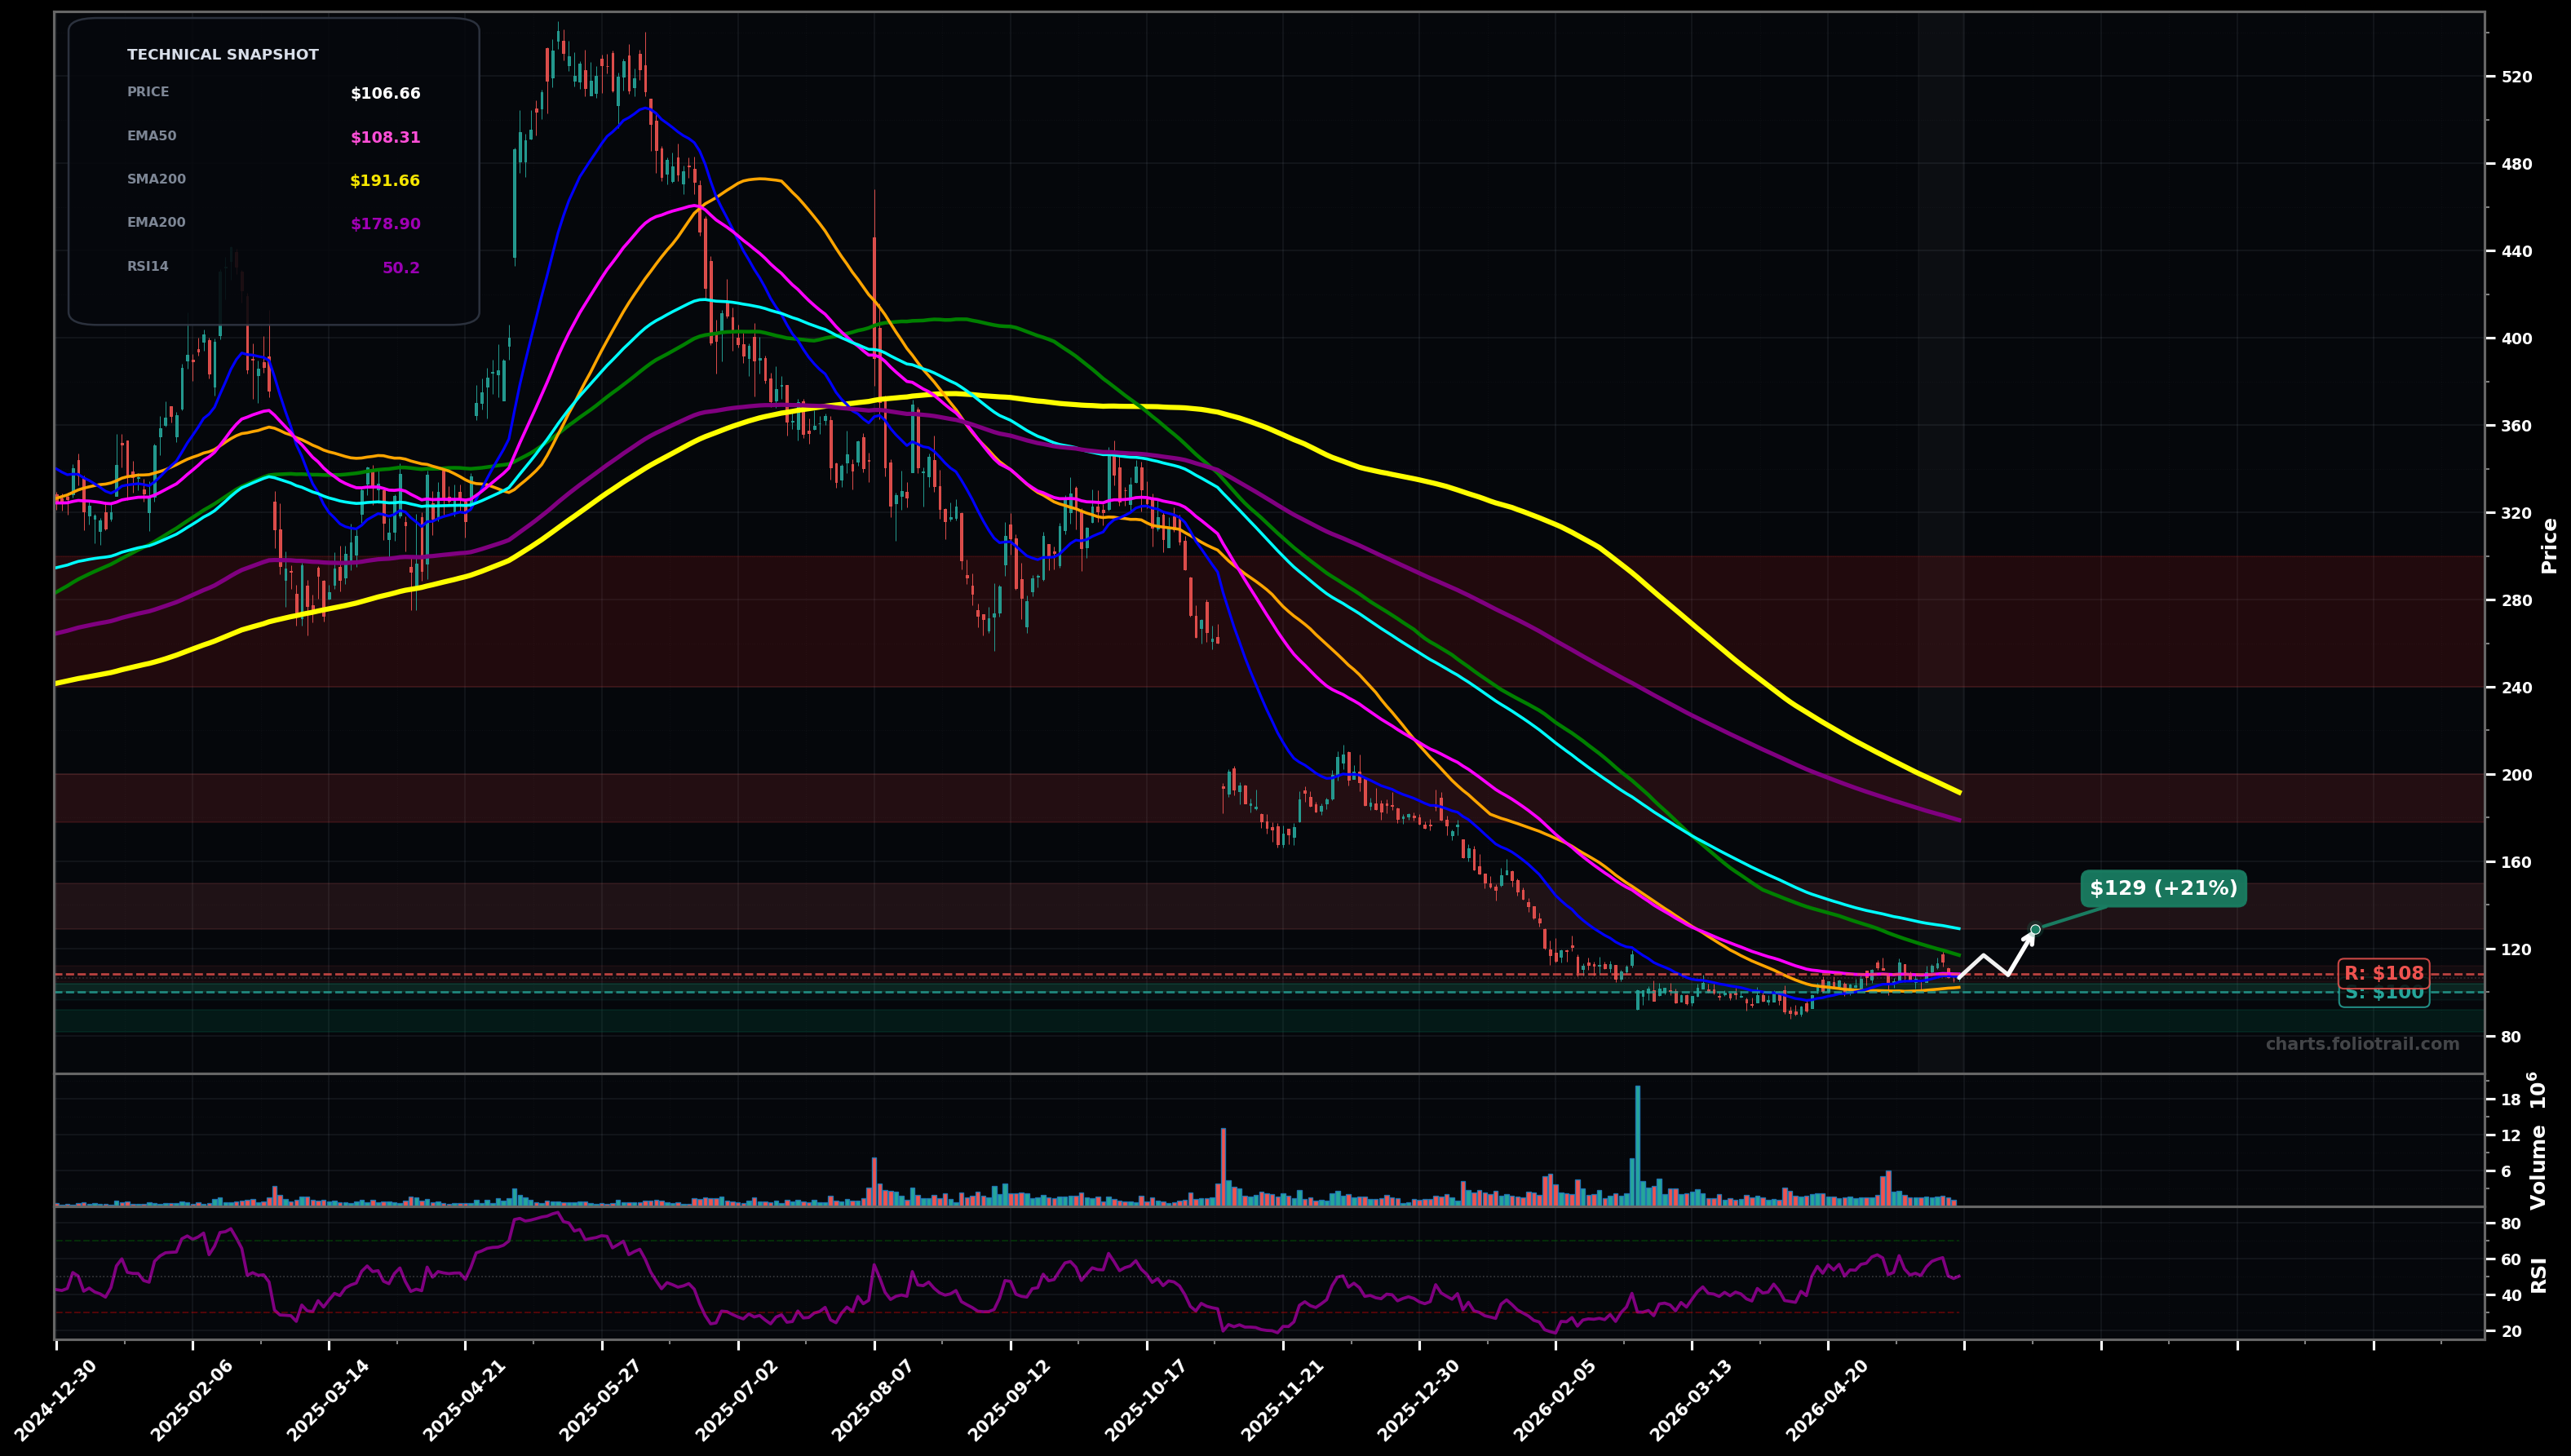
As of May 22, 2026, DUOL (Duolingo, Inc.) is in a stabilized base state on the daily chart, with a confidence level of 63%. Key support is at $100 and key resistance at $108. Price is basing around $100-$110 after a long selloff; reclaimed/holding near SMA50 ($102.24) but still below falling EMA50 ($108.31) with RSI ~50.
Base continues and resolves upward: price holds $100 support, reclaims EMA50 (~$108) then grinds toward the next MA cluster (EMA100/SMA100 area). Rough probability 60%.
Range fails: breakdown under $100 triggers another down leg (bear flag style) before any sustainable trend reversal. Rough probability 40%.
2+ daily closes above $108.50 (EMA50) with a higher low holding above $102.00
Daily close below $98.00 (range floor / recent swing-low support)
Start near range support/SMA50 area; add on a controlled flush into prior base lows; heavy add only if a capitulation-type move reaches the next demand pocket (downtrend extension).
Trim into MA overhead supply (EMA100/SMA100 then EMA200/SMA200) and prior breakdown zones; fully exit if price gets extremely extended relative to long MAs (multi-year stretch).
As of May 22, 2026, DUOL (Duolingo, Inc.) is in a stabilized base state on the daily chart with 63% confidence. Price is basing around $100-$110 after a long selloff; reclaimed/holding near SMA50 ($102.24) but still below falling EMA50 ($108.31) with RSI ~50.
On the daily timeframe, DUOL has key support at $100 and key resistance at $108. The most likely scenario (bullish) targets $117 and $129, with a revert level at $108.
DUOL (Duolingo, Inc.) is currently classified as stabilized base on the daily chart, with 63% confidence. Confirmation requires: 2+ daily closes above $108.50 (EMA50) with a higher low holding above $102.00 This would be invalidated by: Daily close below $98.00 (range floor / recent swing-low support)
The most likely scenario (bullish) targets $117 and $129, with a revert level at $108. The alternative scenario (bearish) targets $92.0 and $82.0.
Multi-layer AI agents analyse 200+ stocks across daily, weekly, and monthly timeframes — producing market state classifications, price scenarios with targets, and position entry/exit levels. Daily charts updated every trading day at 6 PM ET. Weekly charts refresh Fridays. Monthly charts refresh on the last trading day of each month. No paywall. No sign-up required.
Built by Foliotrail.
All content on this website — including charts, analysis, price targets, support/resistance levels, and position zones — is generated entirely by AI and provided for educational and informational purposes only.
This is not financial advice. NEXUSNOIR VENTURES SL (the operator of this website) is not a registered investment adviser or broker-dealer. You should not make investment decisions based solely on this information. Always do your own research and consult a qualified financial advisor.
By continuing, you acknowledge that you have read and agree to our full disclaimer & terms of use and privacy policy.