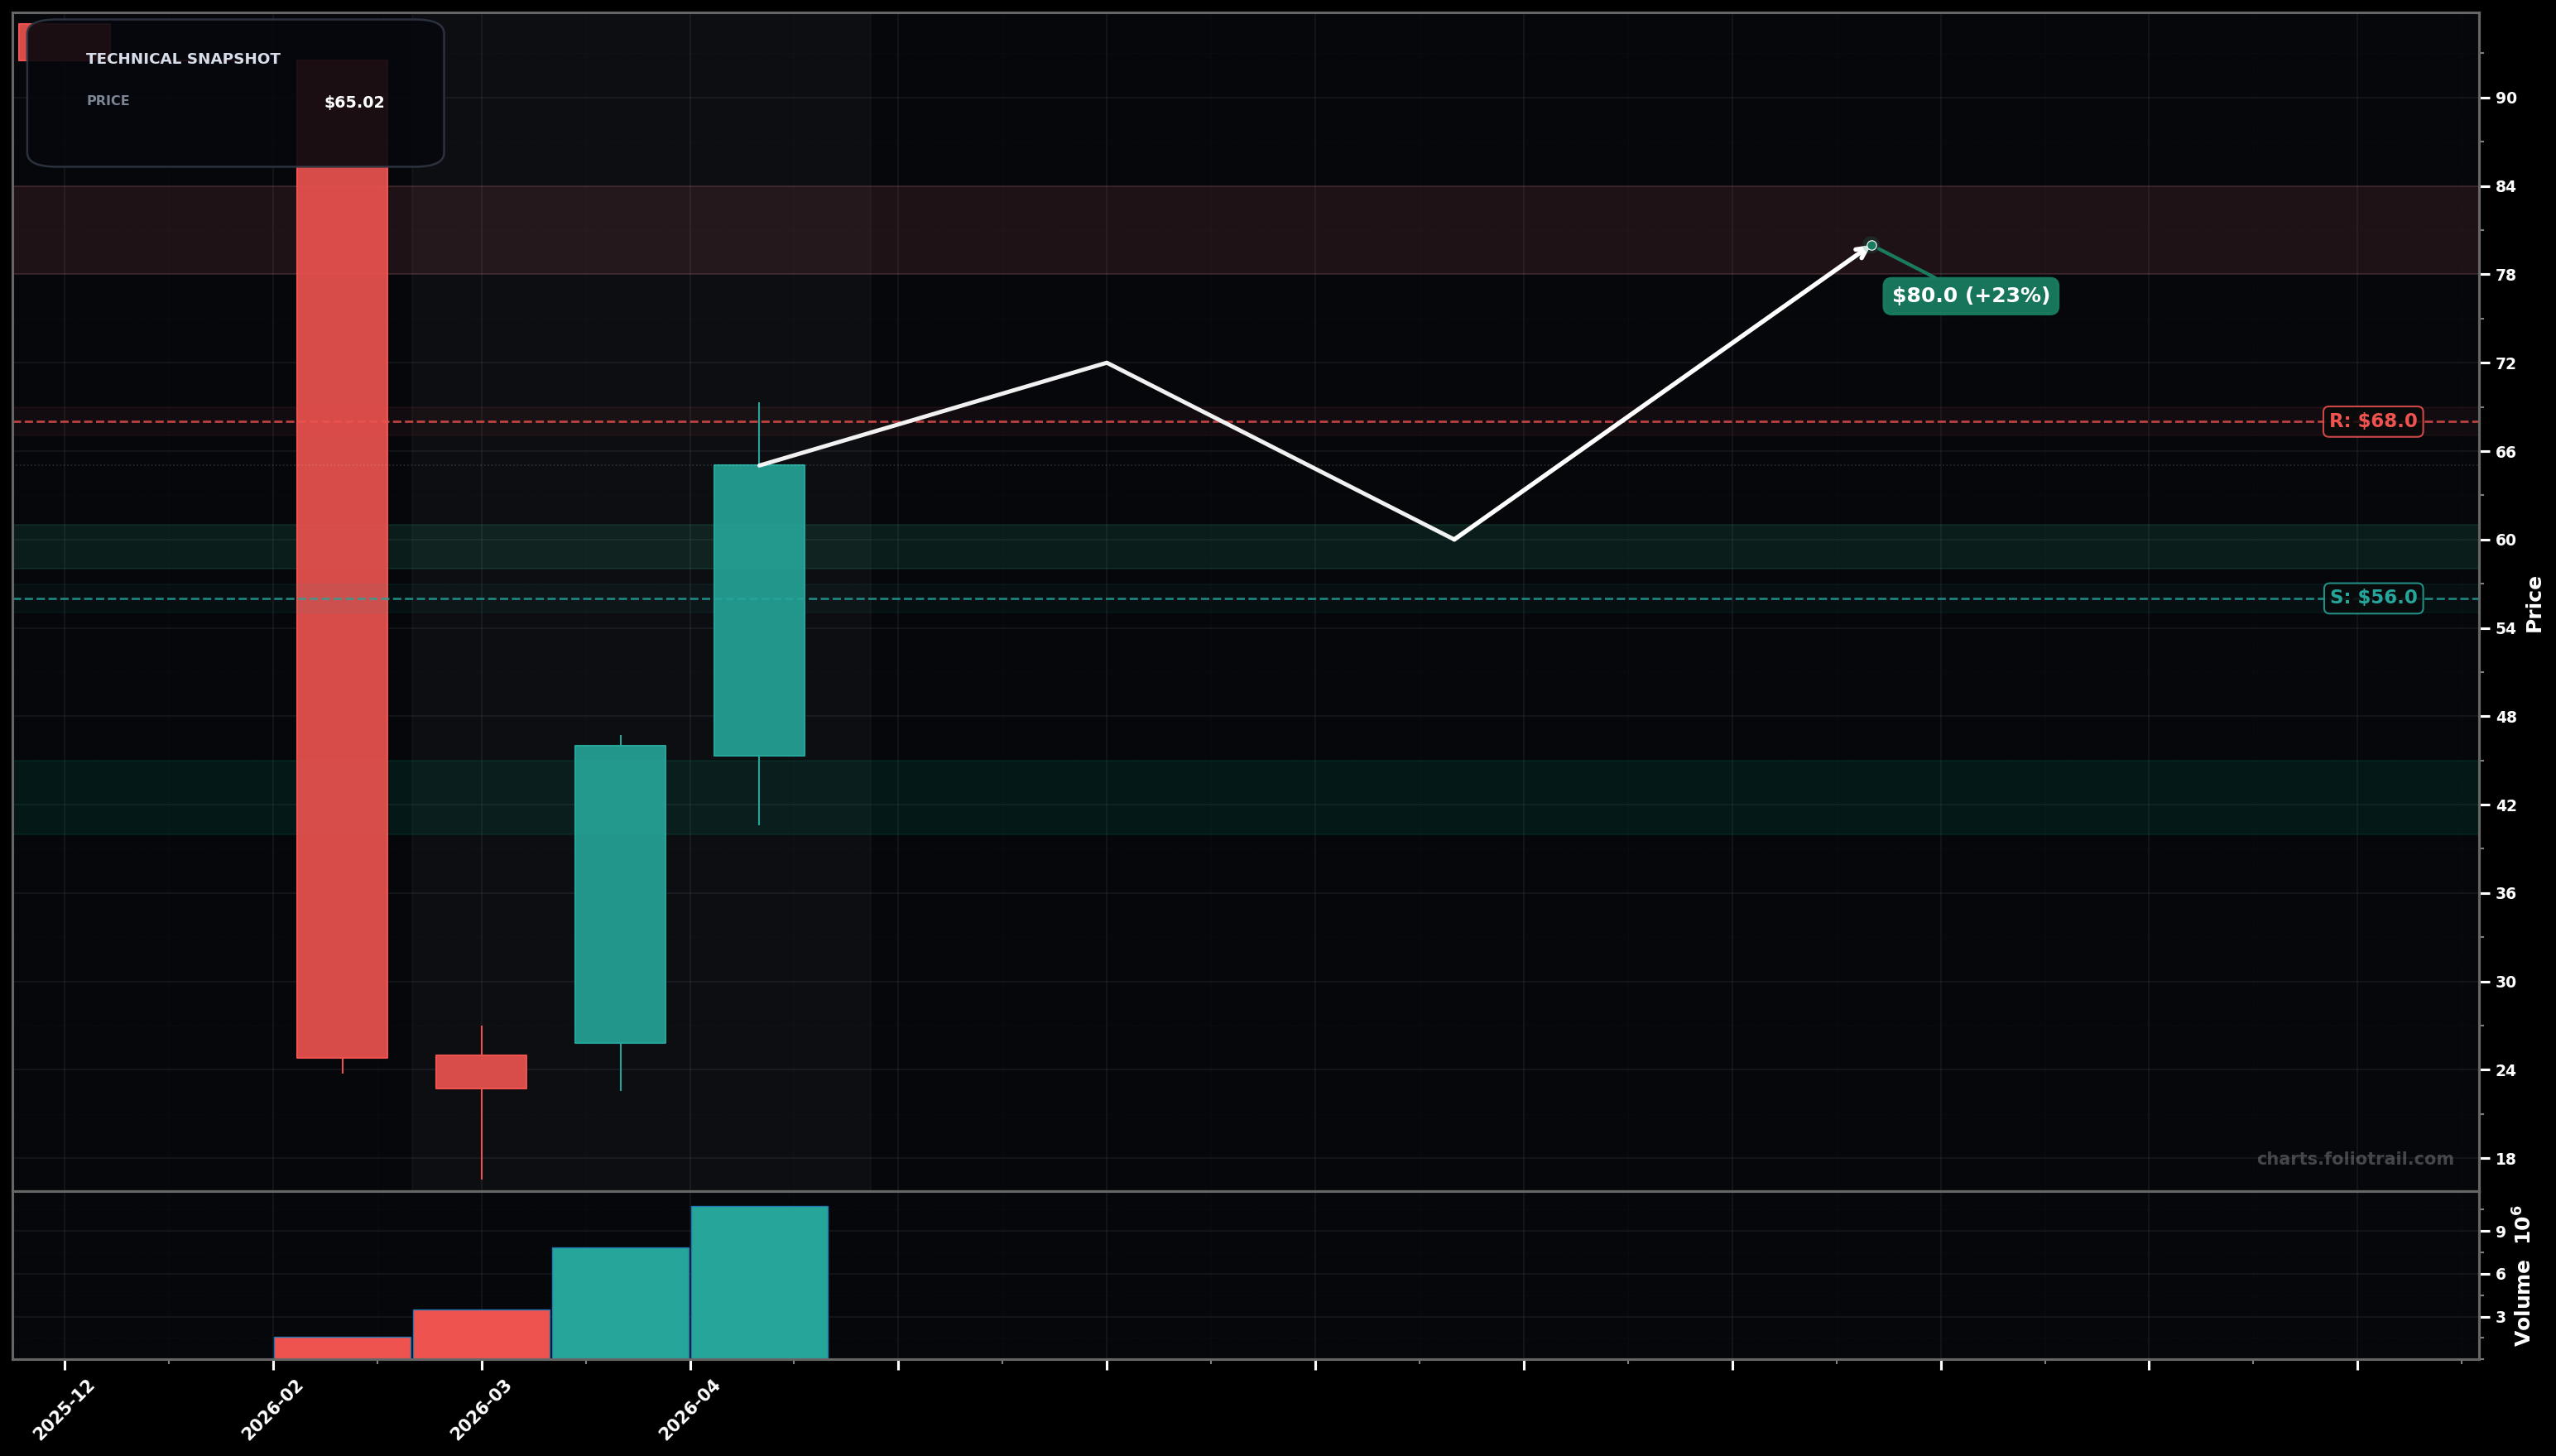
As of May 26, 2026, SHAZ (SharonAI Holdings Inc.) is in a volatility expansion state on the monthly chart, with a confidence level of 72%. Key support is at $56.0 and key resistance at $68.0. After a sharp selloff and base attempt, SHAZ printed two strong green monthly candles and is now consolidating just below the recent swing high; latest price around $65.02.
Bullish continuation: a brief consolidation above ~$60 followed by a breakout through the ~$66-$68 swing-high supply, targeting the prior distribution zone; Elliott read: rebound likely Wave (3) underway after a Wave (2) low near ~$20, with near-term Wave (4) chop possible before another push.
Bearish rejection: failure at ~$66-$68 leads to a deeper pullback to retest the breakout base; if $56 fails, price can mean-revert toward the prior pivot/volume shelf; Fibonacci: a typical retrace of the rally could revisit the ~50%-61.8% zone of the last impulse leg.
Monthly close above $68.00 with follow-through (next month holds above $68.00).
Monthly close below $56.00 (breaks the post-rebound higher-low structure and reopens downside).
Scale-in around the post-rally higher-low area ($58-$61), add on a clean retest of key support ($52-$56), and only deploy heavily on a deeper mean-reversion to the prior consolidation/volume shelf ($40-$45).
Trim into successive overhead supply zones above the recent swing high (prior distribution levels), with full exit reserved for a multi-year stretch extension where monthly candles become climactic and rejection risk rises.
As of May 26, 2026, SHAZ (SharonAI Holdings Inc.) is in a volatility expansion state on the monthly chart with 72% confidence. After a sharp selloff and base attempt, SHAZ printed two strong green monthly candles and is now consolidating just below the recent swing high; latest price around $65.02.
On the monthly timeframe, SHAZ has key support at $56.0 and key resistance at $68.0. The most likely scenario (bullish) targets $72.0 and $80.0, with a revert level at $60.0.
SHAZ (SharonAI Holdings Inc.) is currently classified as volatility expansion on the monthly chart, with 72% confidence. Confirmation requires: Monthly close above $68.00 with follow-through (next month holds above $68.00). This would be invalidated by: Monthly close below $56.00 (breaks the post-rebound higher-low structure and reopens downside).
The most likely scenario (bullish) targets $72.0 and $80.0, with a revert level at $60.0. The alternative scenario (bearish) targets $56.0 and $44.0.
Multi-layer AI agents analyse 200+ stocks across daily, weekly, and monthly timeframes — producing market state classifications, price scenarios with targets, and position entry/exit levels. Daily charts updated every trading day at 6 PM ET. Weekly charts refresh Fridays. Monthly charts refresh on the last trading day of each month. No paywall. No sign-up required.
Built by Foliotrail.
All content on this website — including charts, analysis, price targets, support/resistance levels, and position zones — is generated entirely by AI and provided for educational and informational purposes only.
This is not financial advice. NEXUSNOIR VENTURES SL (the operator of this website) is not a registered investment adviser or broker-dealer. You should not make investment decisions based solely on this information. Always do your own research and consult a qualified financial advisor.
By continuing, you acknowledge that you have read and agree to our full disclaimer & terms of use and privacy policy.