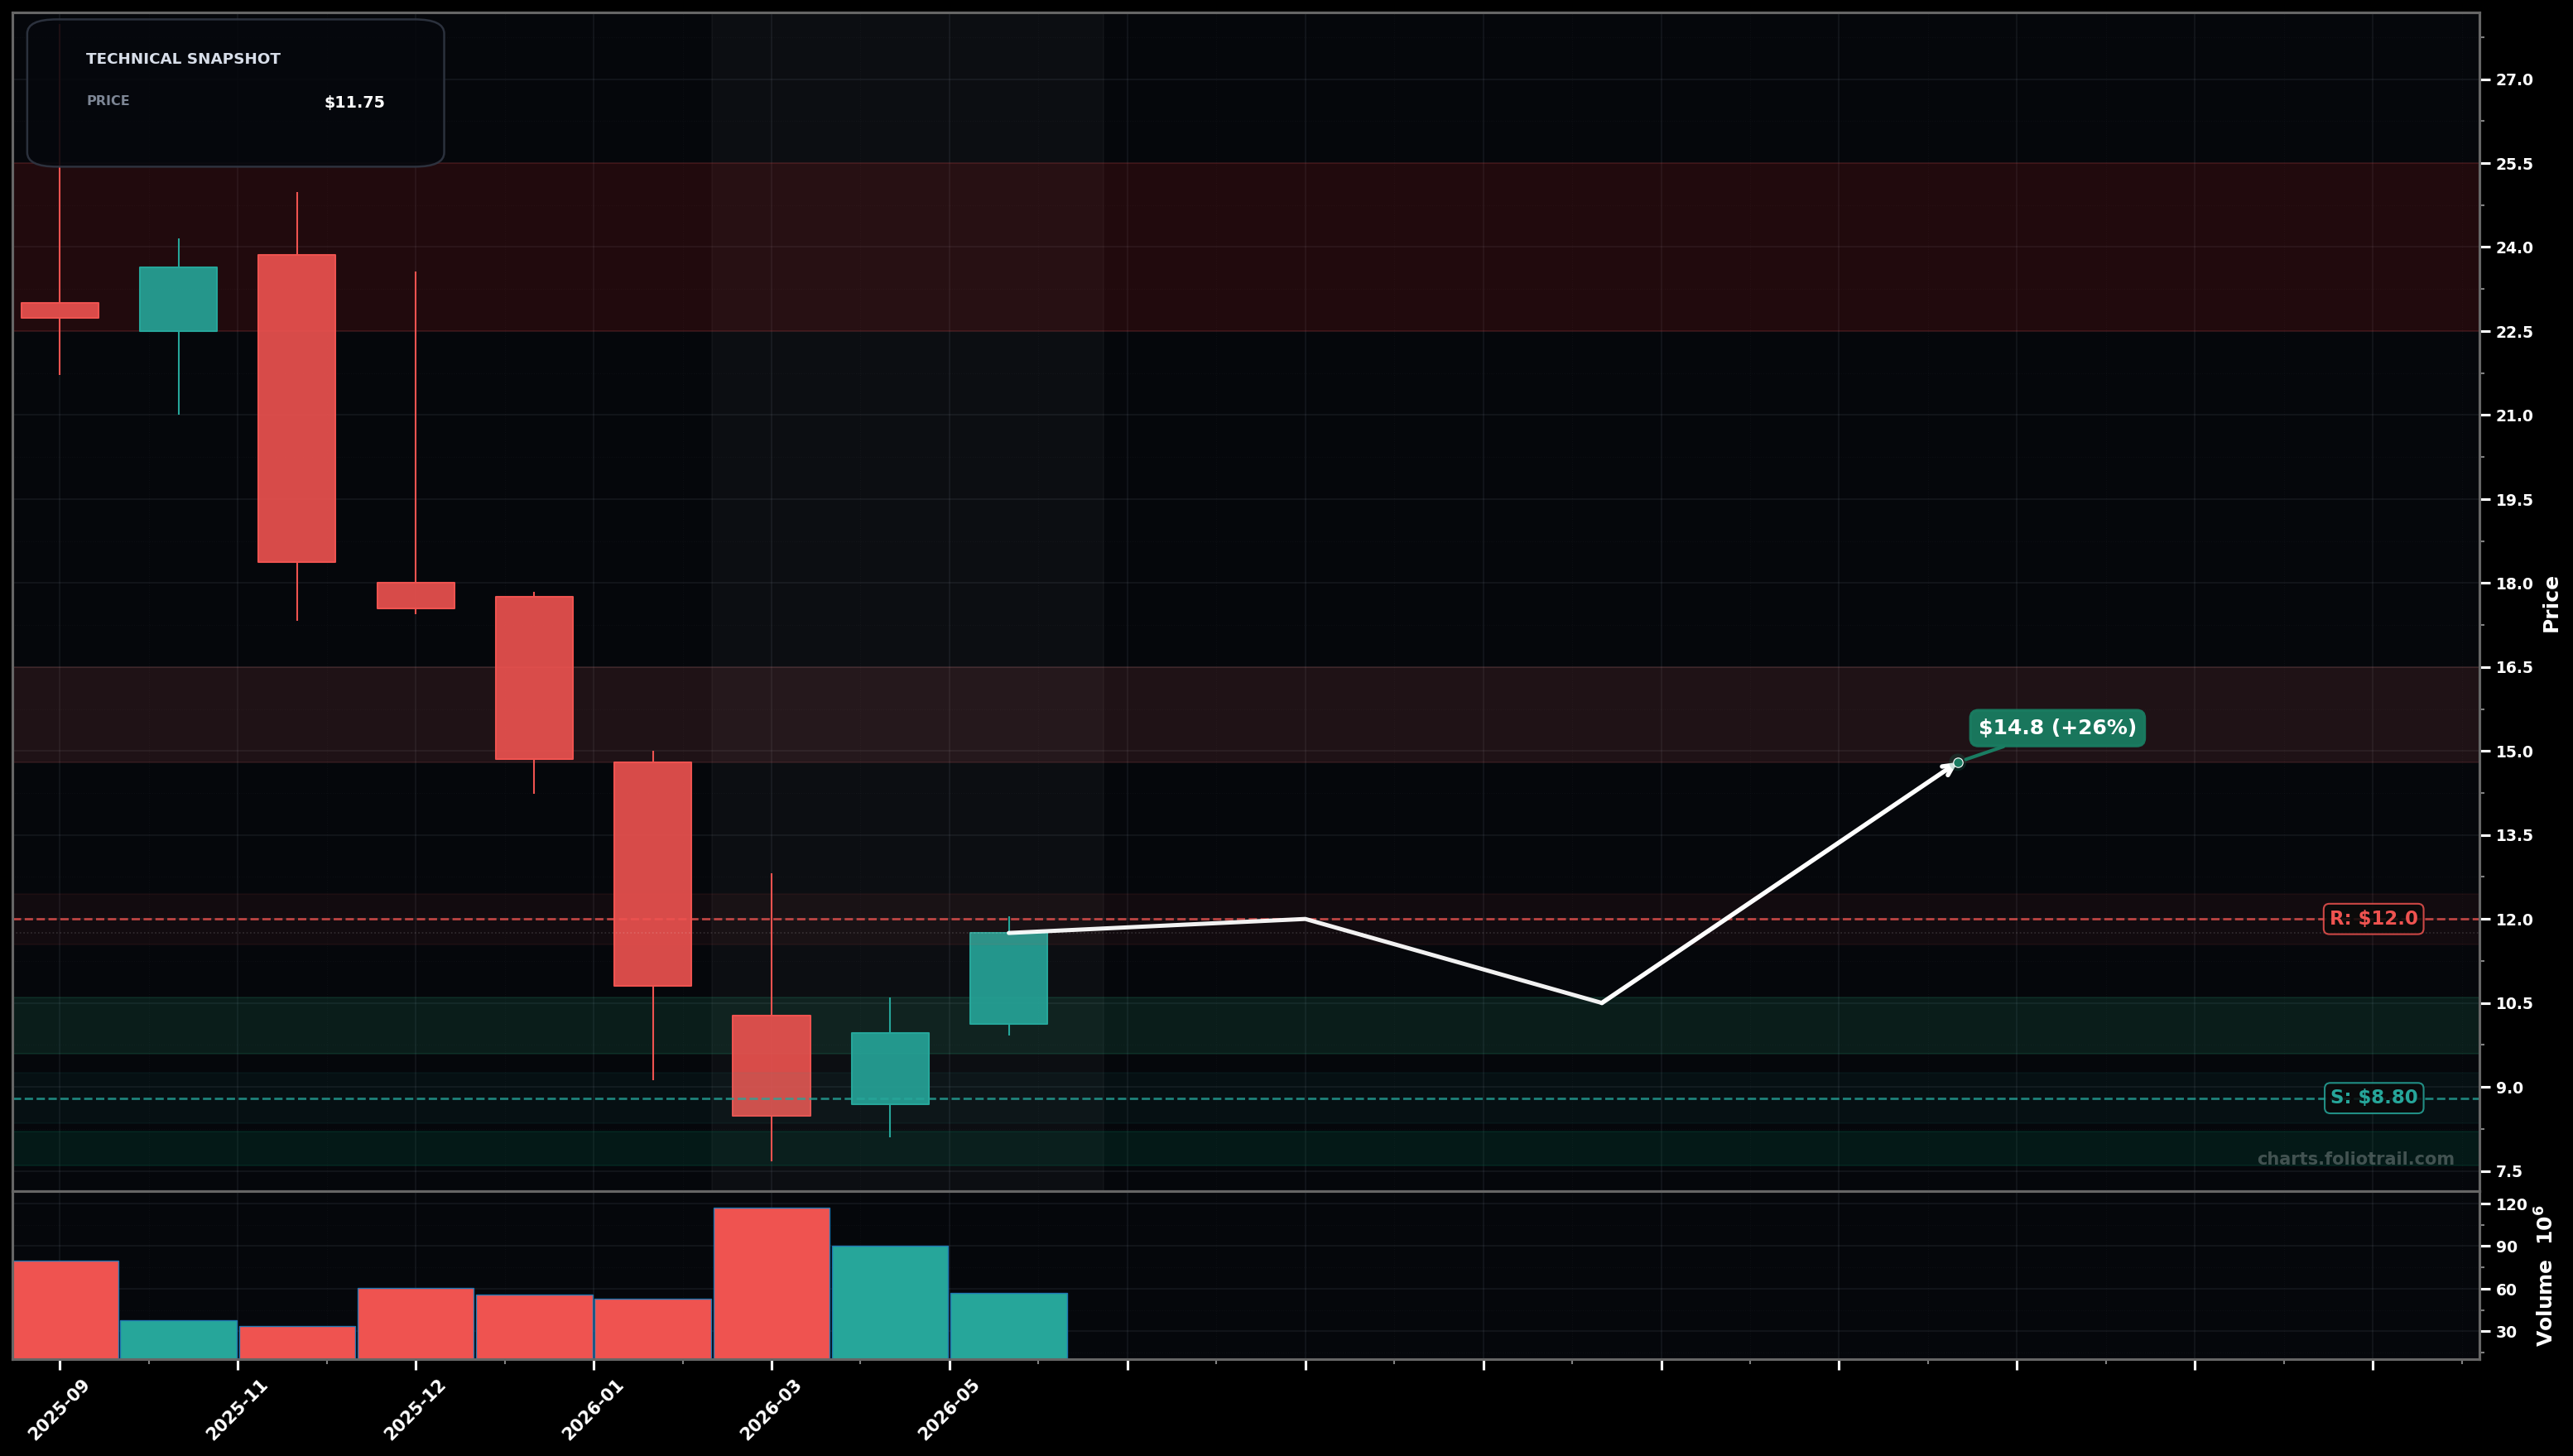
As of May 25, 2026, NTSK (Netskope, Inc.) is in a bottoming attempt state on the monthly chart, with a confidence level of 61%. Key support is at $8.80 and key resistance at $12.0. Sharp multi-month selloff from ~$24 area into a low near ~$8, followed by a 2-candle rebound to ~$11.75; volatility/volume expanded during the drop.
Base-building after capitulation: price chops between ~$8.8 support and ~$12 resistance, then attempts a breakout; Elliott-wise this fits an A-B-C down ending and starting an impulsive wave (1) up if $12 breaks. Fib-wise, first meaningful retrace zone sits near the ~38.2% area around ~$14-$15.
Failed bottom: bounce stalls under ~$12 and rolls over; a breakdown retests the lows and can extend to a deeper Fib extension zone (capitulation continuation). Elliott-wise this would be wave (5) continuation lower rather than a completed C-wave.
Monthly close above $12.00 (follow-through reclaiming the post-drop supply zone).
Monthly close below $8.50 (breaks the swing-low reference and signals renewed downside).
Scale-in around the post-capitulation base: starter on pullbacks, add at primary swing-support, heavy add only on a deeper retest/undercut near prior lows (risk defined below $8.5).
Trim into Fib retrace/overhead supply from the breakdown zone (~$15 then ~$18-$20), and close into a full mean-reversion back toward the pre-drop distribution area (~$23-$25).
As of May 25, 2026, NTSK (Netskope, Inc.) is in a bottoming attempt state on the monthly chart with 61% confidence. Sharp multi-month selloff from ~$24 area into a low near ~$8, followed by a 2-candle rebound to ~$11.75; volatility/volume expanded during the drop.
On the monthly timeframe, NTSK has key support at $8.80 and key resistance at $12.0. The most likely scenario (bullish) targets $12.0 and $14.8, with a revert level at $10.5.
NTSK (Netskope, Inc.) is currently classified as bottoming attempt on the monthly chart, with 61% confidence. Confirmation requires: Monthly close above $12.00 (follow-through reclaiming the post-drop supply zone). This would be invalidated by: Monthly close below $8.50 (breaks the swing-low reference and signals renewed downside).
The most likely scenario (bullish) targets $12.0 and $14.8, with a revert level at $10.5. The alternative scenario (bearish) targets $9.00 and $7.60.
Multi-layer AI agents analyse 200+ stocks across daily, weekly, and monthly timeframes — producing market state classifications, price scenarios with targets, and position entry/exit levels. Daily charts updated every trading day at 6 PM ET. Weekly charts refresh Fridays. Monthly charts refresh on the last trading day of each month. No paywall. No sign-up required.
Built by Foliotrail.
All content on this website — including charts, analysis, price targets, support/resistance levels, and position zones — is generated entirely by AI and provided for educational and informational purposes only.
This is not financial advice. NEXUSNOIR VENTURES SL (the operator of this website) is not a registered investment adviser or broker-dealer. You should not make investment decisions based solely on this information. Always do your own research and consult a qualified financial advisor.
By continuing, you acknowledge that you have read and agree to our full disclaimer & terms of use and privacy policy.