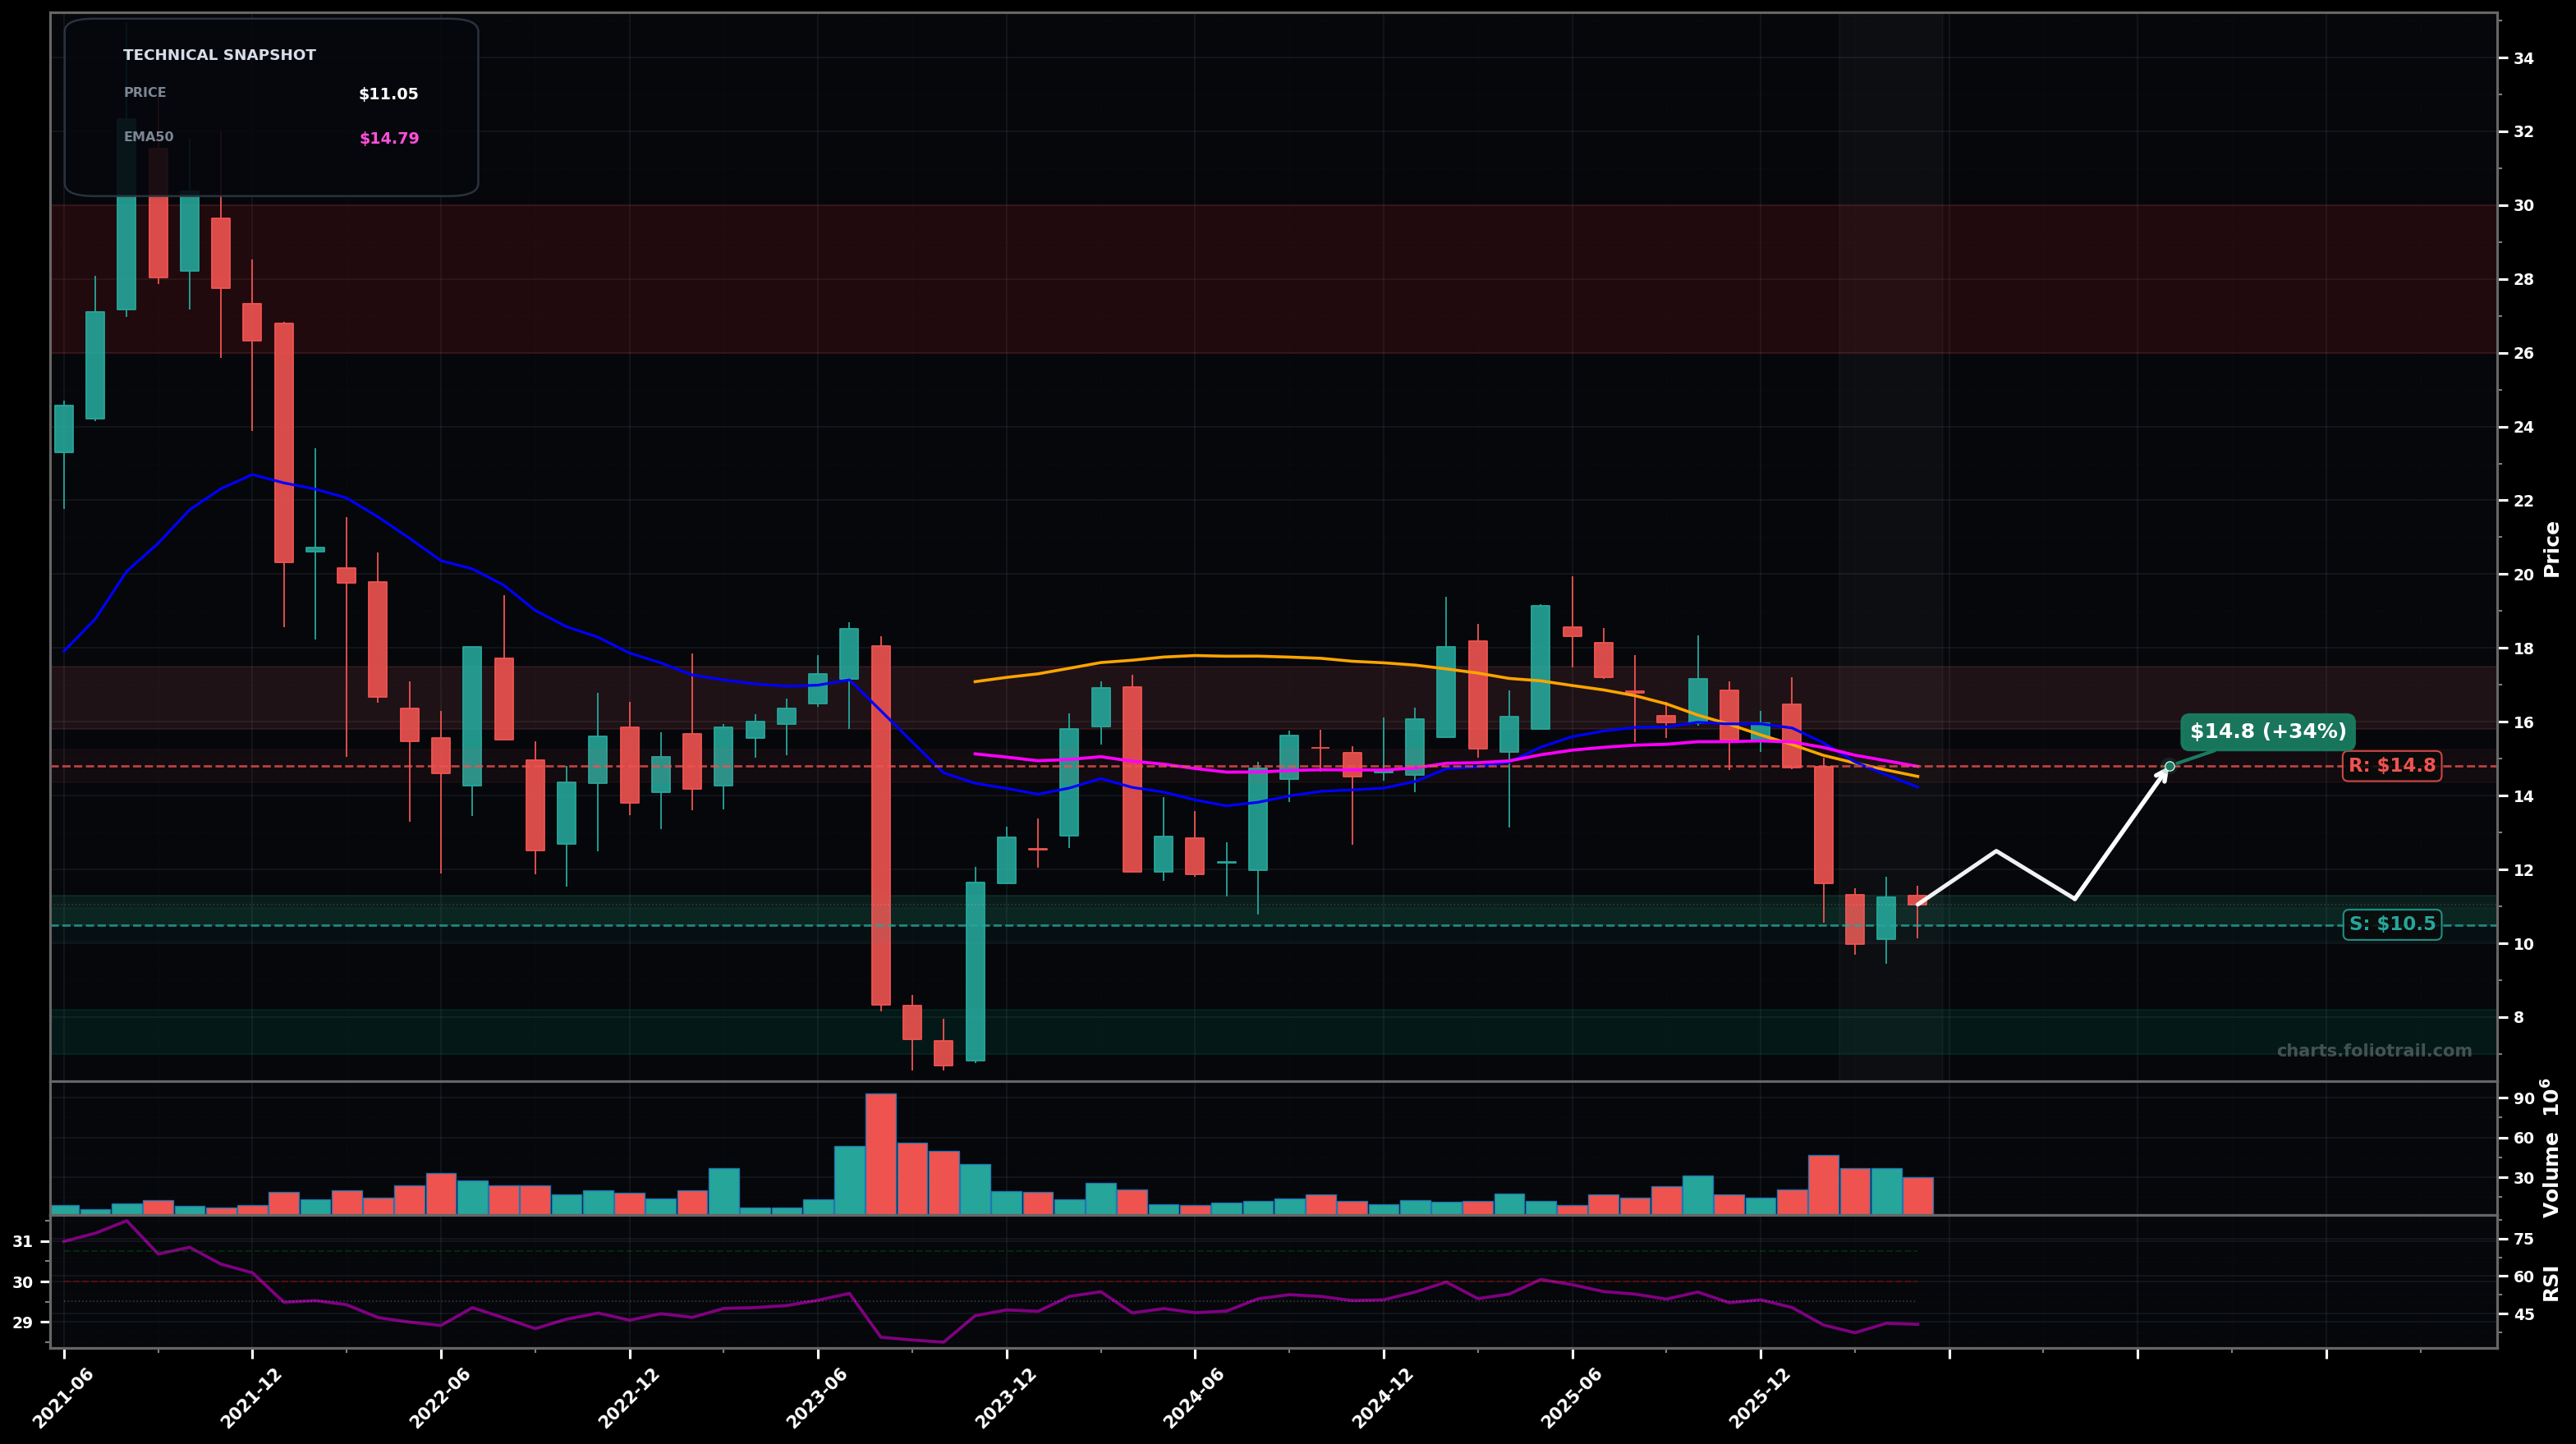
As of May 22, 2026, ADYEY (Adyen N.V. ADR) is in a downtrend state on the monthly chart, with a confidence level of 73%. Key support is at $10.5 and key resistance at $14.8. Monthly selloff broke below the clustered EMA20/EMA50 and SMA50; last candles are small and stabilizing around $11 after a sharp drop from the $15–$16 area; RSI ~40 (weak momentum).
Base-building attempt above ~$10.50 with a relief rally back into the broken moving-average cluster; likely to face supply around $14–$15 before any bigger trend change.
Support fails and price resumes the primary monthly downtrend, retesting the prior capitulation zone from 2023 and potentially undercutting it (wave-5 style extension).
Monthly close below $10.50 (support break) would confirm continued downtrend pressure.
Two consecutive monthly closes back above $14.80 (EMA50 zone reclaim) would invalidate the downtrend call and shift toward breakout-reversal.
Start near current swing support (~$10.5–$11.3); add on breakdown/retest ($9.4–$10.5); heavy add only on a deeper capitulation/undercut near prior major low zone (~$7–$8.2).
Trim into prior supply zones and MA congestion ($16–$18), trim more on a retest of the bigger distribution pivot ($19–$22), and fully close only if price becomes extremely stretched back toward the old monthly highs ($26–$30).
As of May 22, 2026, ADYEY (Adyen N.V. ADR) is in a downtrend state on the monthly chart with 73% confidence. Monthly selloff broke below the clustered EMA20/EMA50 and SMA50; last candles are small and stabilizing around $11 after a sharp drop from the $15–$16 area; RSI ~40 (weak momentum).
On the monthly timeframe, ADYEY has key support at $10.5 and key resistance at $14.8. The most likely scenario (bullish) targets $12.5 and $14.8, with a revert level at $11.2.
ADYEY (Adyen N.V. ADR) is currently classified as downtrend on the monthly chart, with 73% confidence. Confirmation requires: Monthly close below $10.50 (support break) would confirm continued downtrend pressure. This would be invalidated by: Two consecutive monthly closes back above $14.80 (EMA50 zone reclaim) would invalidate the downtrend call and shift toward breakout-reversal.
The most likely scenario (bullish) targets $12.5 and $14.8, with a revert level at $11.2. The alternative scenario (bearish) targets $9.60 and $7.20.
Multi-layer AI agents analyse 200+ stocks across daily, weekly, and monthly timeframes — producing market state classifications, price scenarios with targets, and position entry/exit levels. Daily charts updated every trading day at 6 PM ET. Weekly charts refresh Fridays. Monthly charts refresh on the last trading day of each month. No paywall. No sign-up required.
Built by Foliotrail.
All content on this website — including charts, analysis, price targets, support/resistance levels, and position zones — is generated entirely by AI and provided for educational and informational purposes only.
This is not financial advice. NEXUSNOIR VENTURES SL (the operator of this website) is not a registered investment adviser or broker-dealer. You should not make investment decisions based solely on this information. Always do your own research and consult a qualified financial advisor.
By continuing, you acknowledge that you have read and agree to our full disclaimer & terms of use and privacy policy.