Netskope, Inc. — AI-powered chart analysis updated every trading day at 6 PM ET
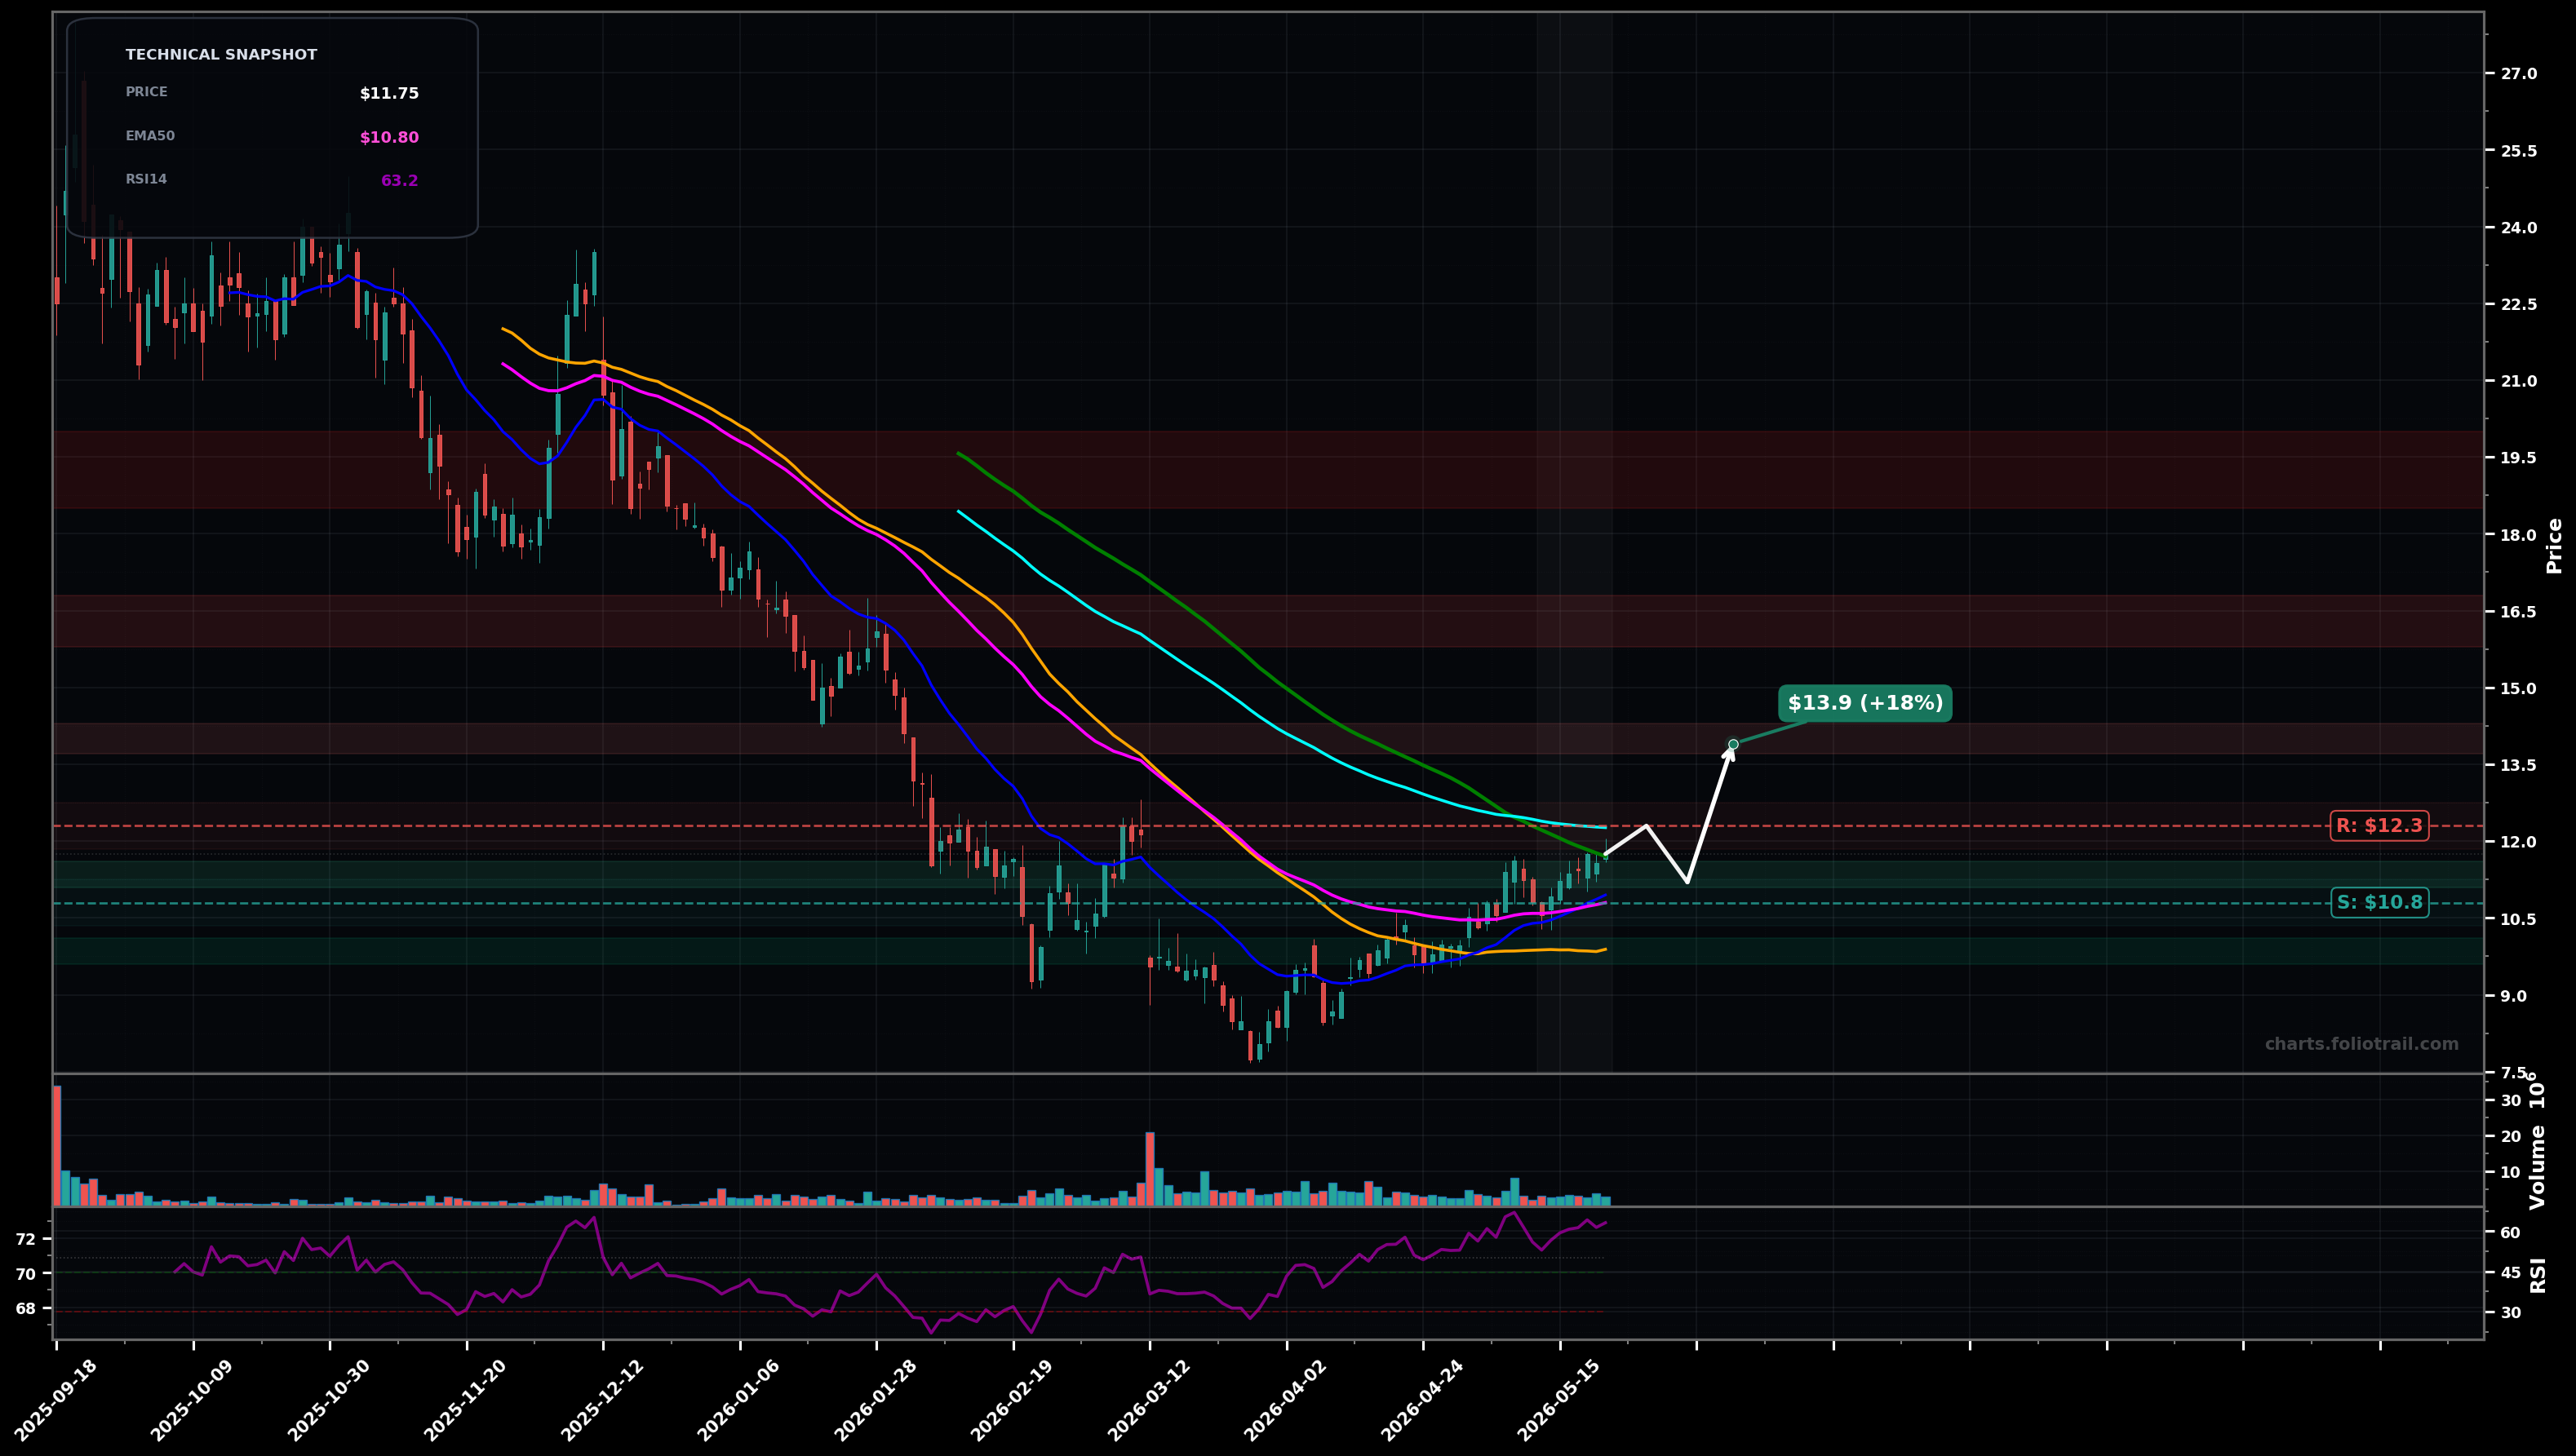
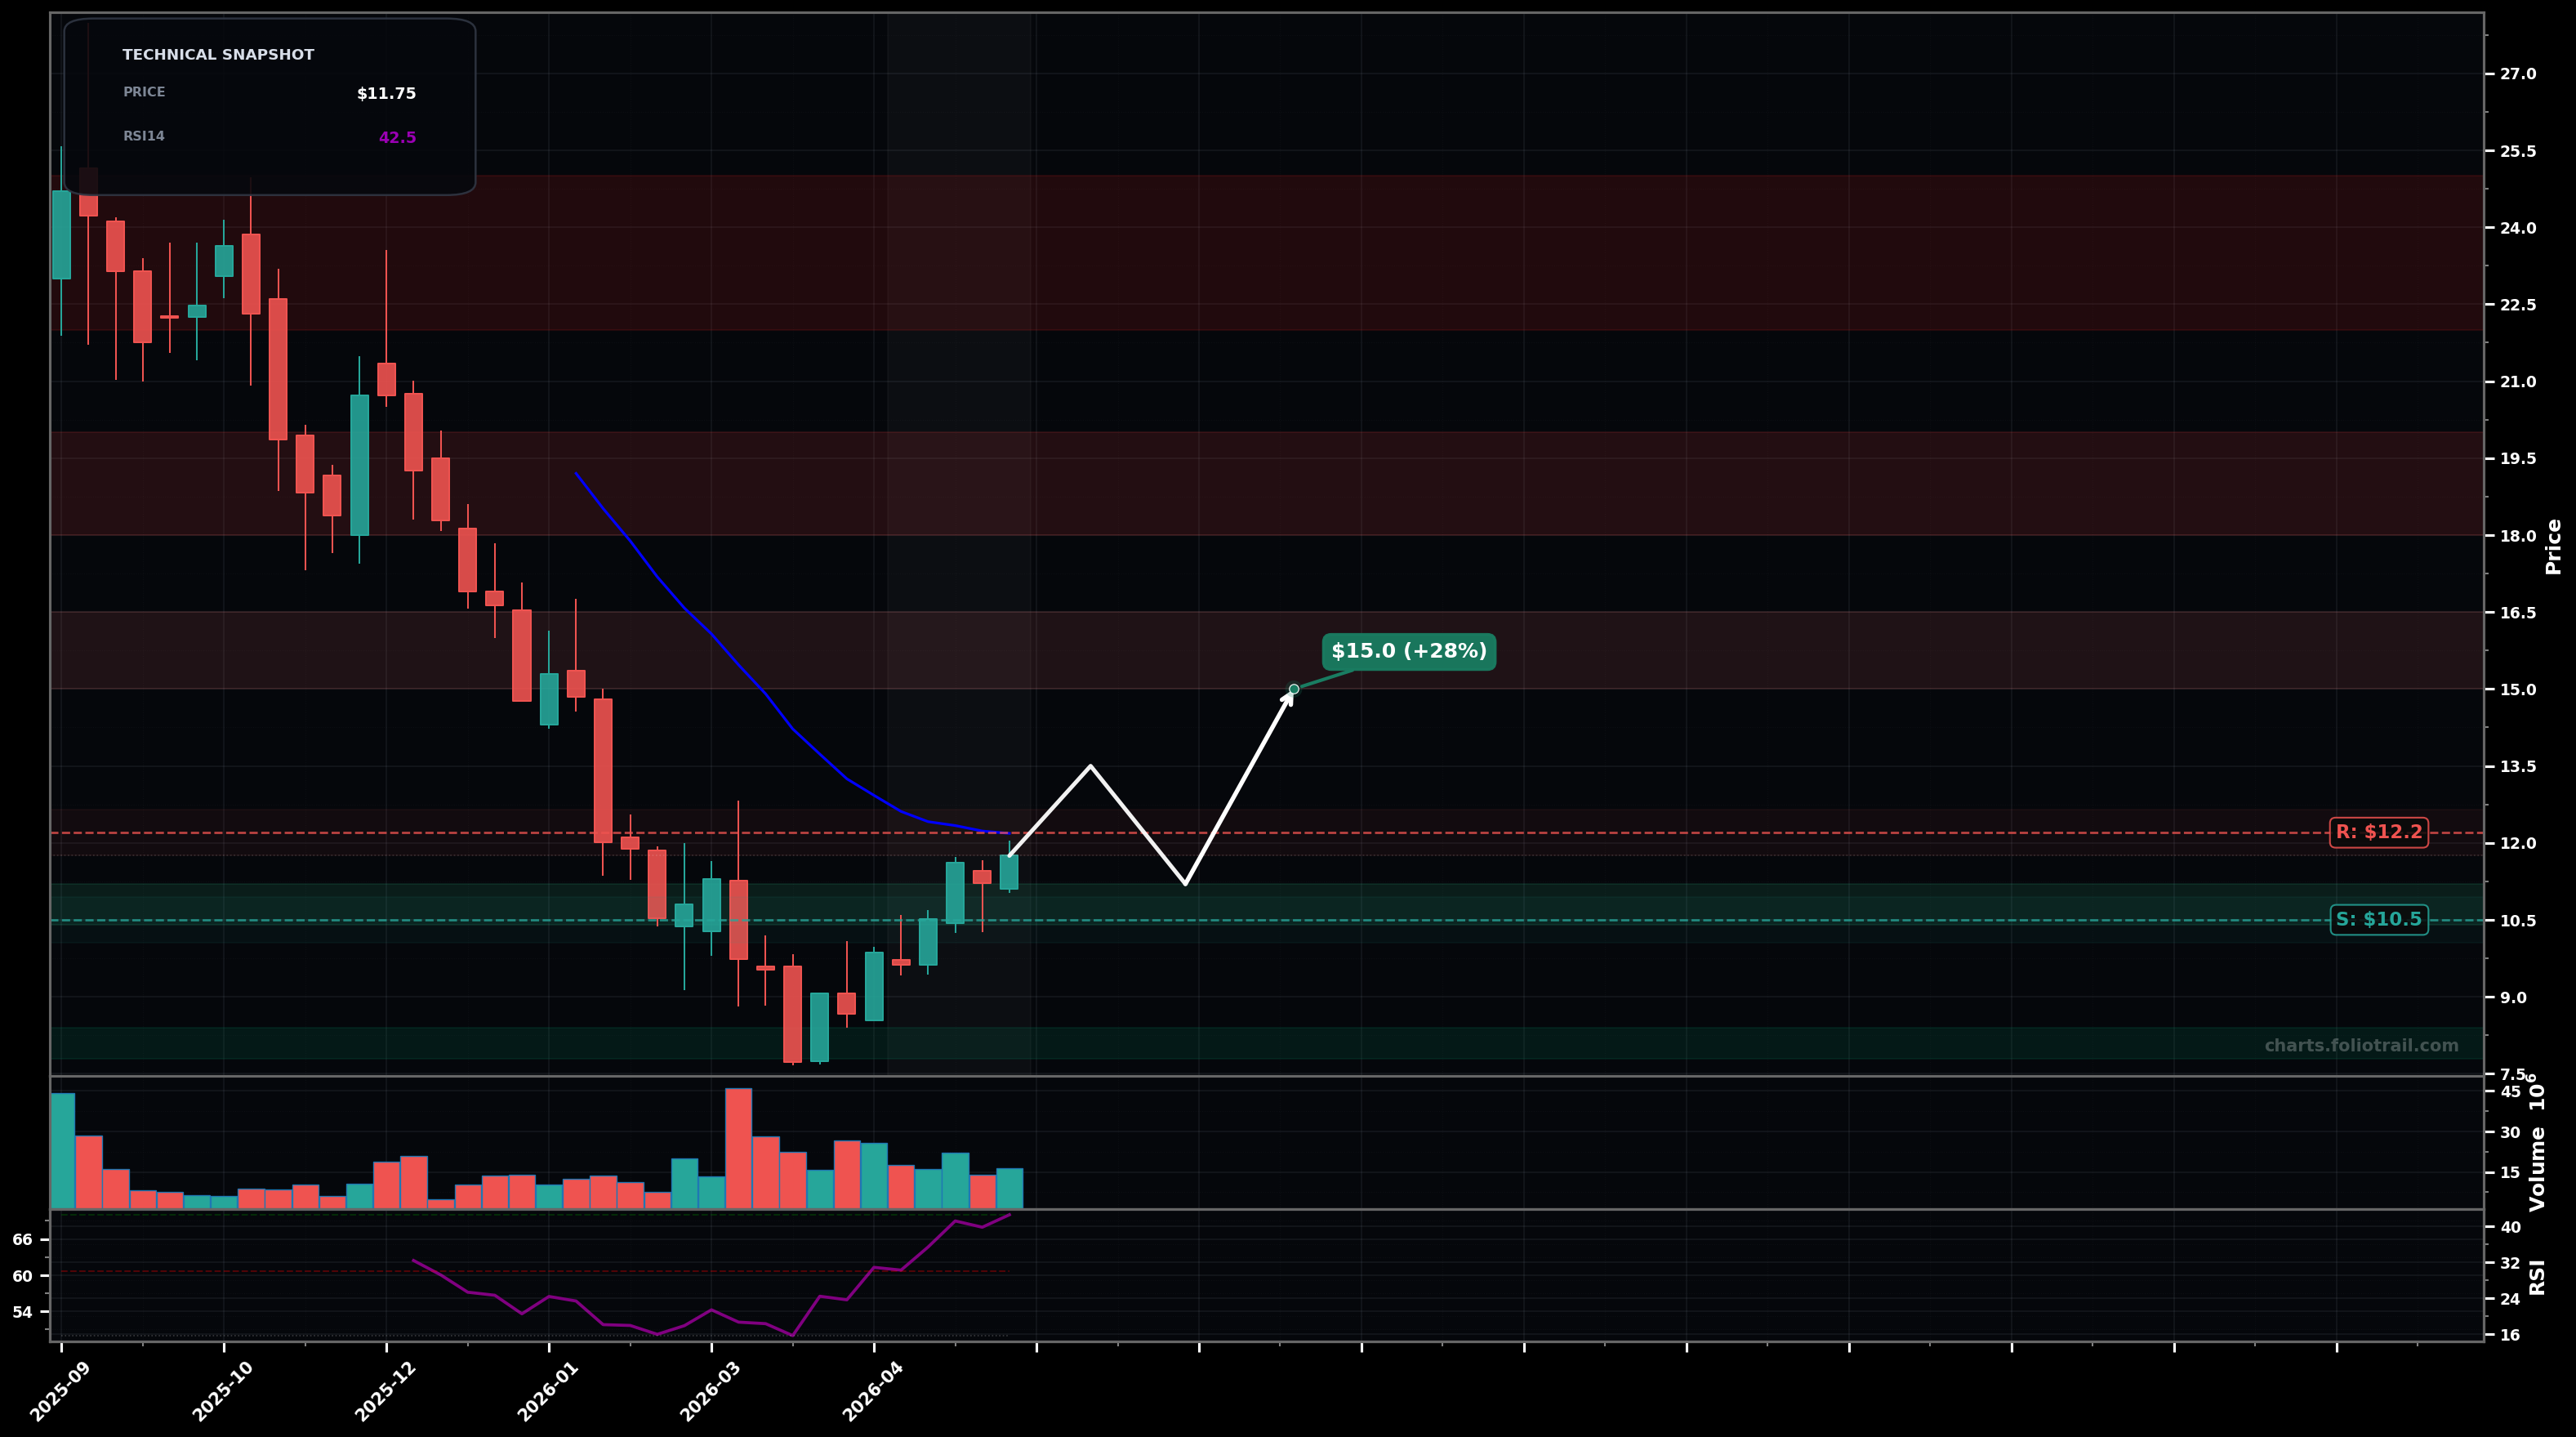
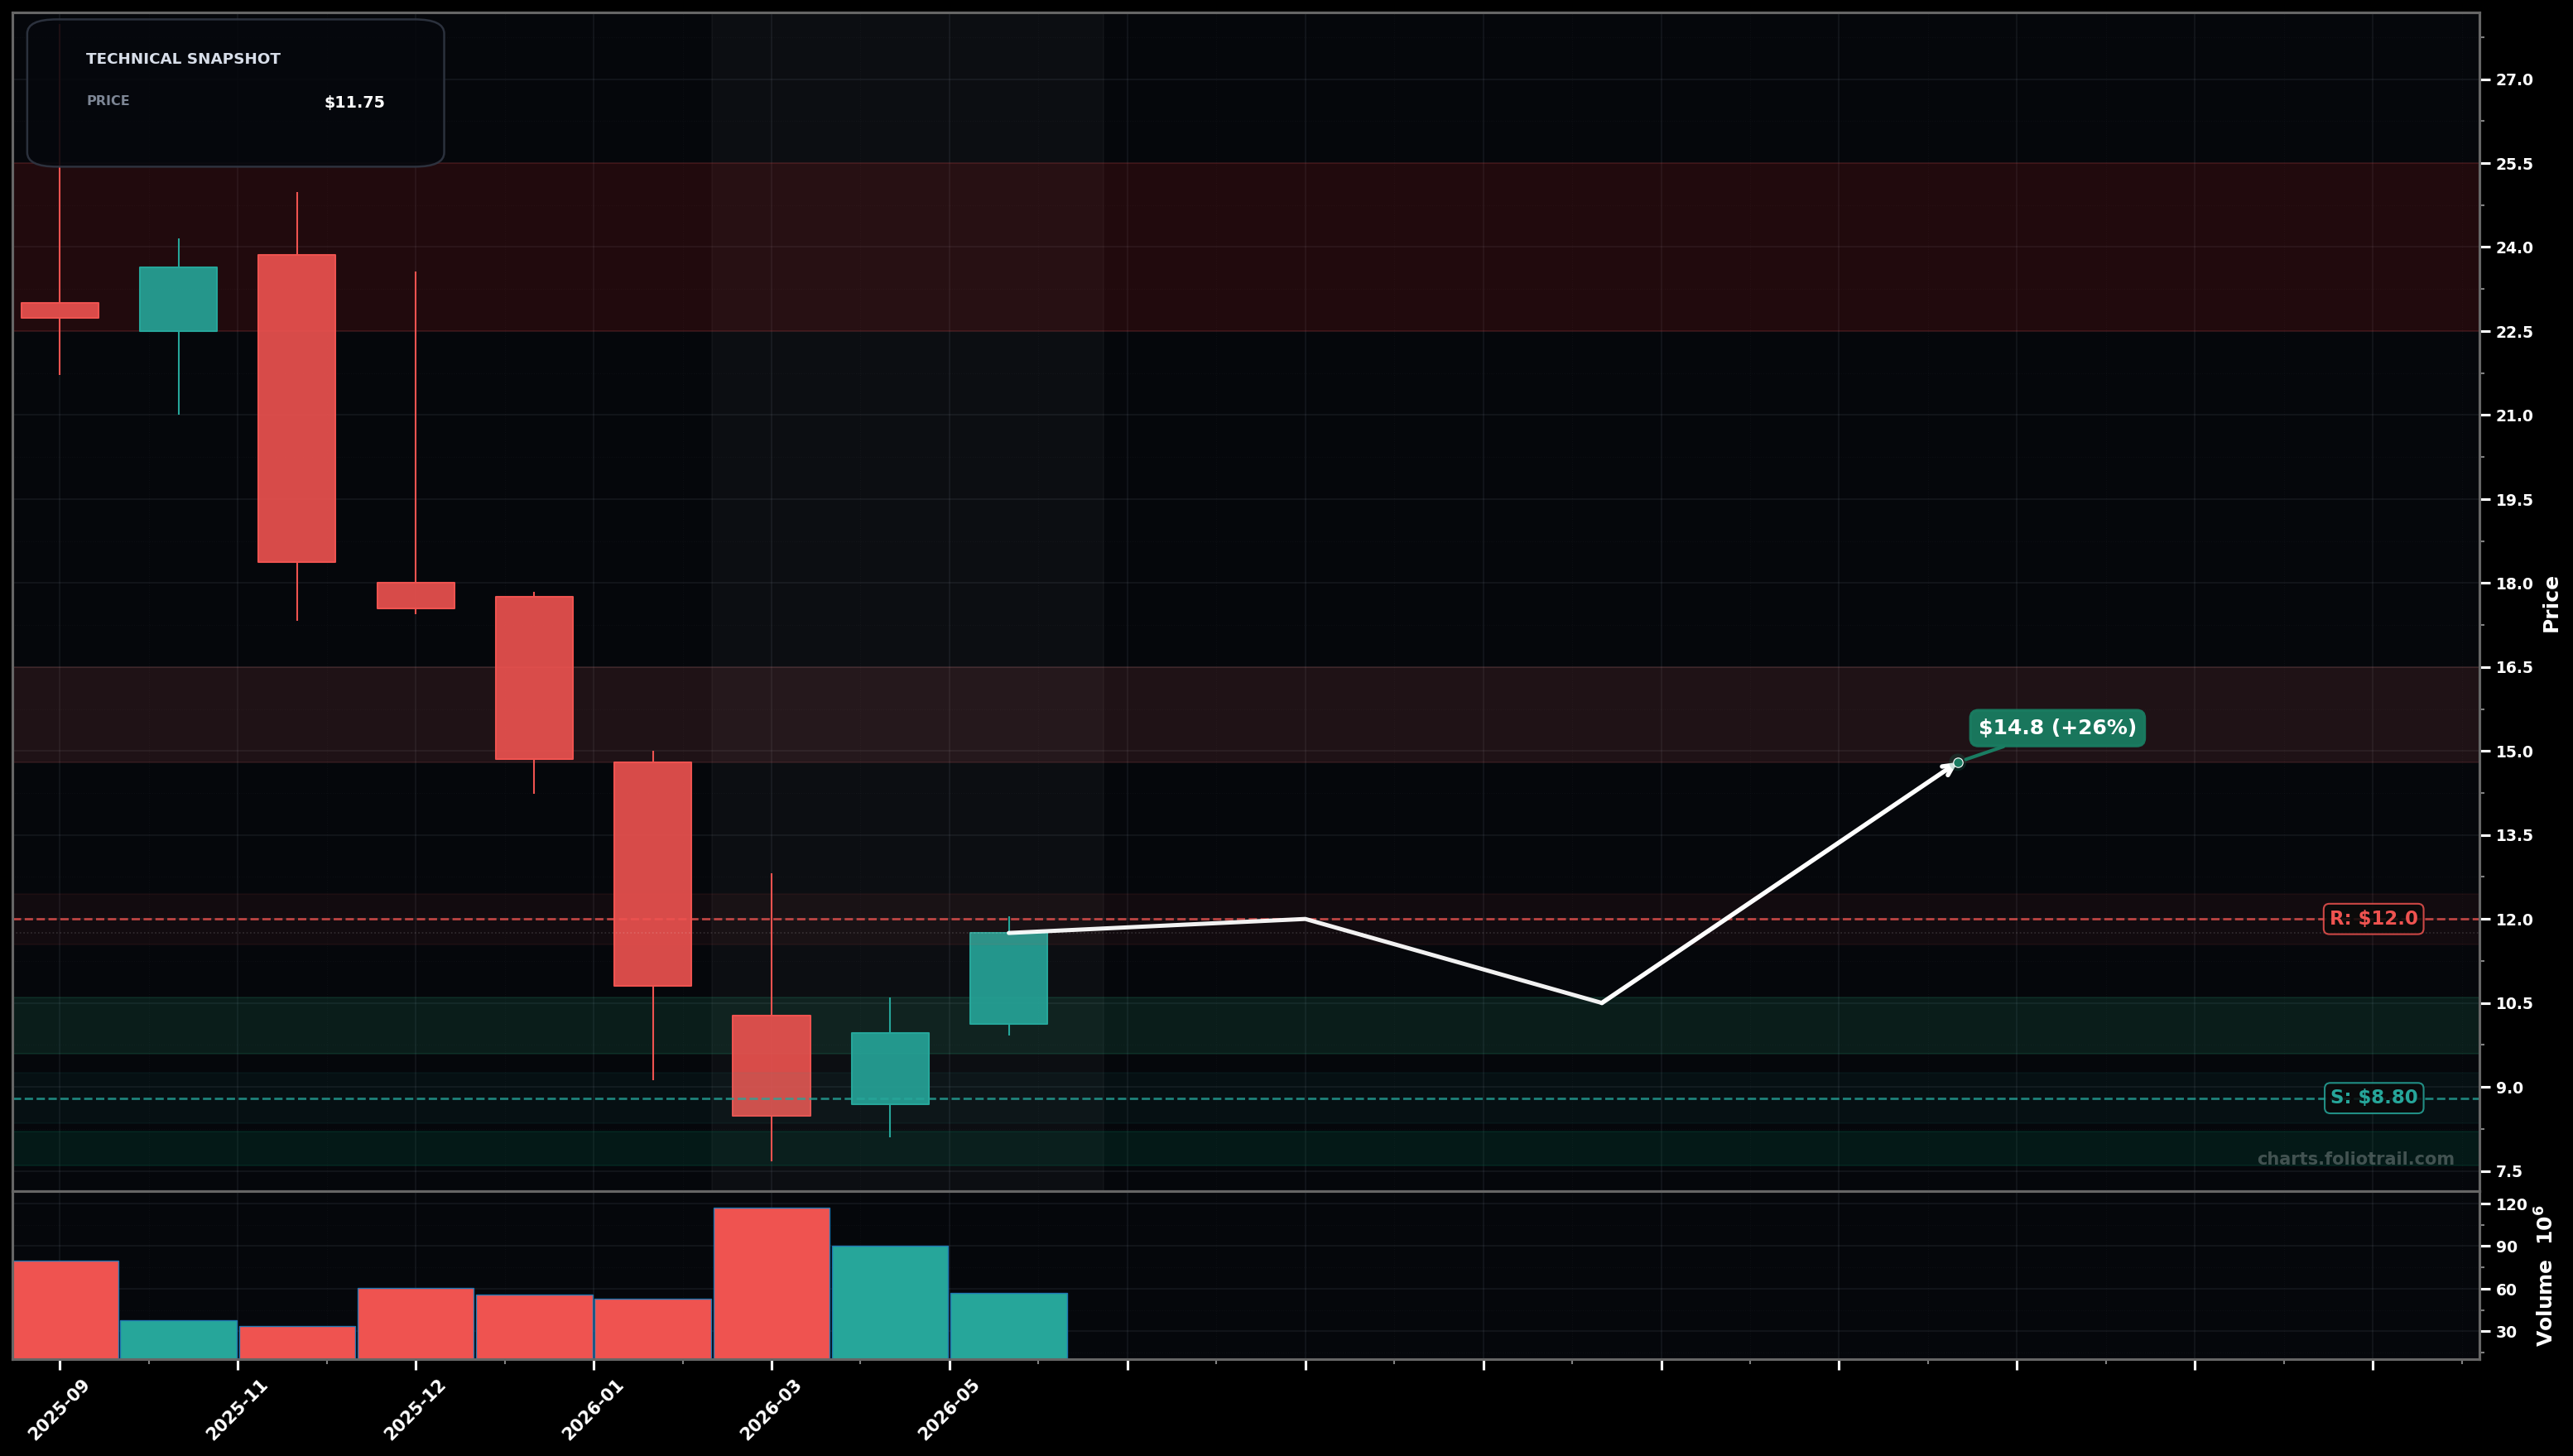
As of May 25, 2026, NTSK (Netskope, Inc.) is in a bottoming attempt state on the daily timeframe with 66% confidence. The weekly chart shows a bottoming attempt pattern (62% confidence), while the monthly timeframe indicates bottoming attempt.
As of May 25, 2026, NTSK (Netskope, Inc.) is in a bottoming attempt state on the daily timeframe with 66% confidence. Price is basing and grinding higher into a confluence of long-term moving averages (~$11.7-$12.3) after a prior downtrend; RSI ~63 shows improving momentum but price is still below the declining EMA100.
On the daily chart, NTSK has key support at $10.8 and resistance at $12.3. On the weekly chart, support sits at $10.5 with resistance at $12.2. The monthly timeframe shows support at $8.80 and resistance at $12.0.
FolioCharts provides daily, weekly, and monthly technical analysis for NTSK. Each timeframe is analysed independently by AI agents using moving averages, RSI, and price action.
NTSK daily charts are updated every trading day at 6 PM ET. Weekly charts refresh on Fridays and monthly charts on the last trading day of each month. Learn more about our methodology.
Multi-layer AI agents analyse 200+ stocks across daily, weekly, and monthly timeframes — producing market state classifications, price scenarios with targets, and position entry/exit levels. Daily charts updated every trading day at 6 PM ET. Weekly charts refresh Fridays. Monthly charts refresh on the last trading day of each month. No paywall. No sign-up required.
Built by Foliotrail.
All content on this website — including charts, analysis, price targets, support/resistance levels, and position zones — is generated entirely by AI and provided for educational and informational purposes only.
This is not financial advice. NEXUSNOIR VENTURES SL (the operator of this website) is not a registered investment adviser or broker-dealer. You should not make investment decisions based solely on this information. Always do your own research and consult a qualified financial advisor.
By continuing, you acknowledge that you have read and agree to our full disclaimer & terms of use and privacy policy.