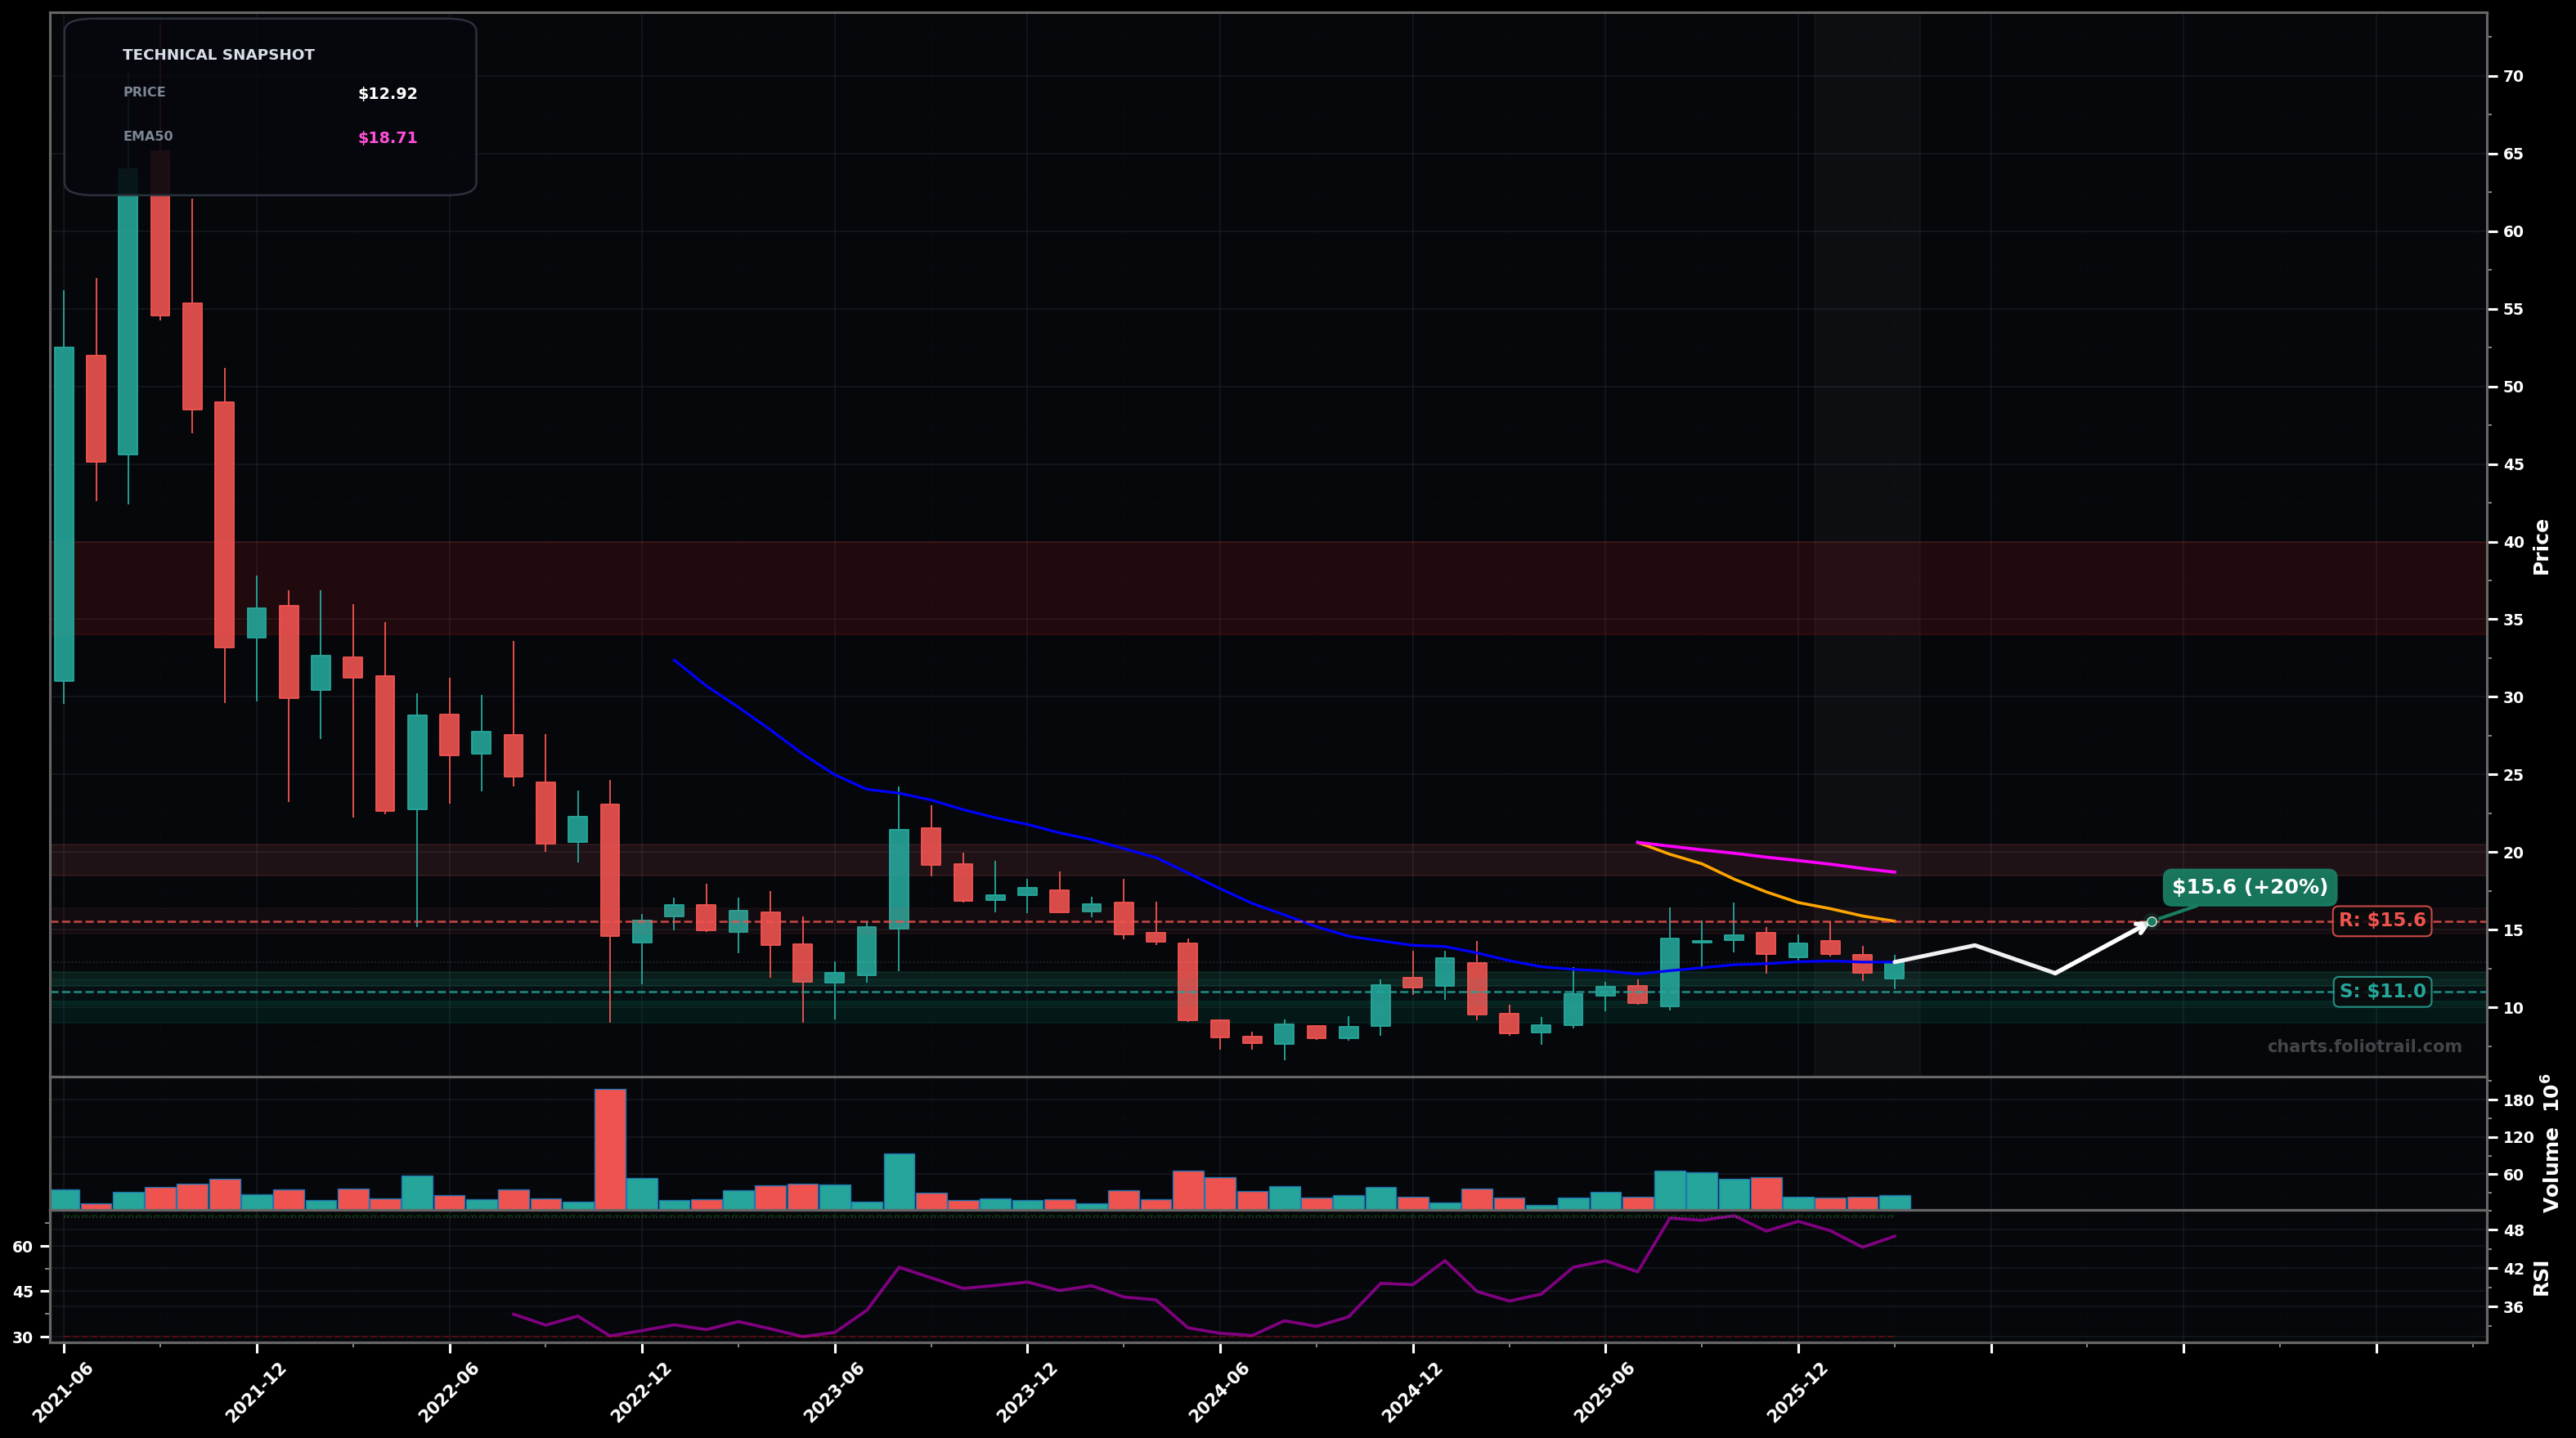
As of May 22, 2026, DLO (DLocal Limited) is in a bottoming attempt state on the monthly chart, with a confidence level of 64%. Key support is at $10.8 and key resistance at $14.8. Monthly price at ~$12.05 is consolidating after a rebound, still below key trend MAs (EMA50 ~$18.13, EMA20 ~$12.87, SMA50 ~$14.79); RSI ~45.8 (neutral-weak).
Base holds and price grinds higher; a reclaim of the $12.90–$14.80 band (EMA20 then SMA50) sets up a move toward the next supply zone under the falling EMA50.
Support fails and the larger downtrend reasserts; breakdown below the swing-low triggers a continuation move into the prior demand zone (capitulation/flush risk).
2+ monthly closes above $14.80 (SMA50) with the next month holding above $14.00
Monthly close below $10.80 (recent swing-low support)
Accumulation zones are set around the swing-low support and the next lower demand pocket; thesis is a bottoming structure unless $10.80 breaks on a monthly close.
Trim into major MA/structure resistances: first near EMA50 (~$18) then prior breakdown/overhead supply zones; full exit only if price reaches historically stretched multi-year mean-reversion levels.
As of May 22, 2026, DLO (DLocal Limited) is in a bottoming attempt state on the monthly chart with 64% confidence. Monthly price at ~$12.05 is consolidating after a rebound, still below key trend MAs (EMA50 ~$18.13, EMA20 ~$12.87, SMA50 ~$14.79); RSI ~45.8 (neutral-weak).
On the monthly timeframe, DLO has key support at $10.8 and key resistance at $14.8. The most likely scenario (bullish) targets $14.8 and $18.1, with a revert level at $13.4.
DLO (DLocal Limited) is currently classified as bottoming attempt on the monthly chart, with 64% confidence. Confirmation requires: 2+ monthly closes above $14.80 (SMA50) with the next month holding above $14.00 This would be invalidated by: Monthly close below $10.80 (recent swing-low support)
The most likely scenario (bullish) targets $14.8 and $18.1, with a revert level at $13.4. The alternative scenario (bearish) targets $10.0 and $8.20.
Multi-layer AI agents analyse 200+ stocks across daily, weekly, and monthly timeframes — producing market state classifications, price scenarios with targets, and position entry/exit levels. Daily charts updated every trading day at 6 PM ET. Weekly charts refresh Fridays. Monthly charts refresh on the last trading day of each month. No paywall. No sign-up required.
Built by Foliotrail.
All content on this website — including charts, analysis, price targets, support/resistance levels, and position zones — is generated entirely by AI and provided for educational and informational purposes only.
This is not financial advice. NEXUSNOIR VENTURES SL (the operator of this website) is not a registered investment adviser or broker-dealer. You should not make investment decisions based solely on this information. Always do your own research and consult a qualified financial advisor.
By continuing, you acknowledge that you have read and agree to our full disclaimer & terms of use and privacy policy.