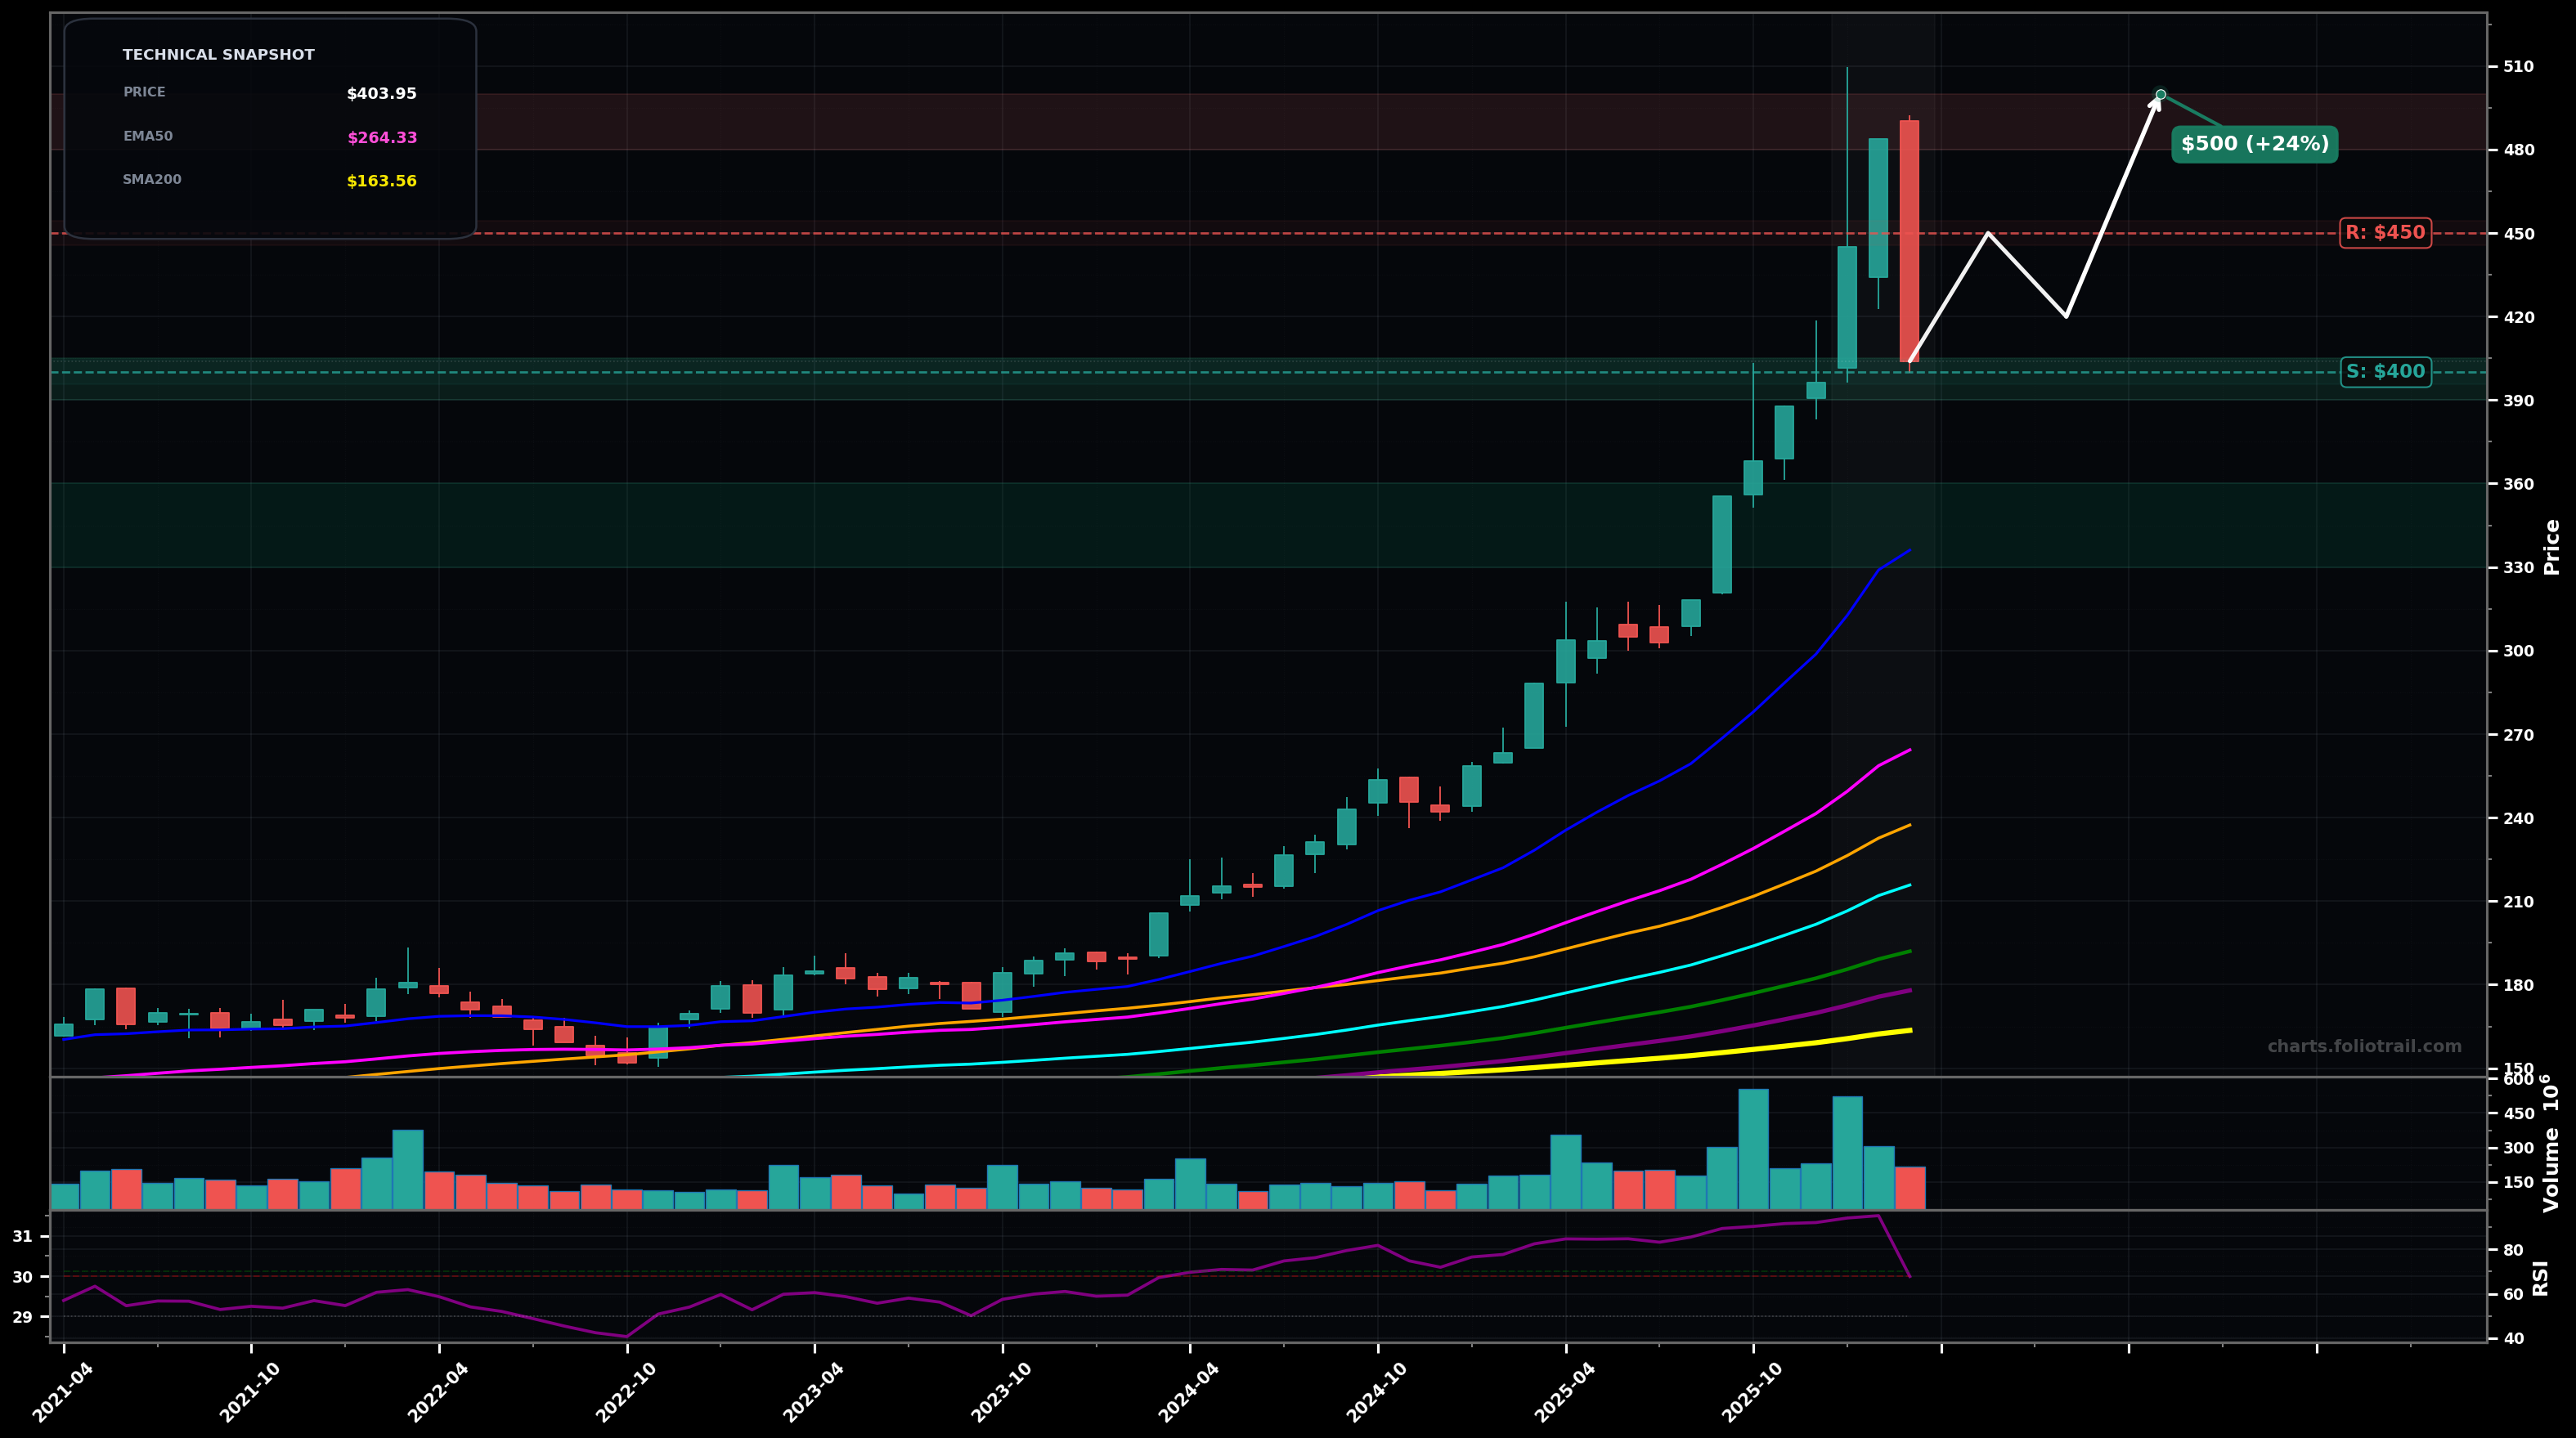
As of March 23, 2026, GLD (SPDR Gold Shares) is in a uptrend state on the monthly chart, with a confidence level of 72%. Key support is at $400 and key resistance at $450. Strong multi-month rally to a new swing high near $500 followed by a sharp pullback to ~$404; still holding well above rising EMA50/EMA100 with RSI ~68 cooling from overbought.
Bullish continuation: current drop acts as a wave-4 style pullback/throwback; price bases above ~$400 then reclaims $450 and retests the prior swing high zone.
Deeper correction: the rejection from ~$500 is a larger ABC; price mean-reverts toward the rising fast MA cluster (EMA20) before resuming the primary uptrend later.
Monthly close back above $450 (and holding $403 as a higher low) confirms uptrend continuation
Monthly close below $336 (EMA20 area) would likely signal a deeper corrective phase
Stagger entries around the breakout-retest zone (~$400), then into Fibonacci-style pullback bands toward EMA20 (~$336) if the correction deepens while the long-term MA stack stays bullish.
Trim into prior swing-high supply ($480–$500) and potential extension zones above it; fully exit only if price becomes extremely extended vs the rising MA structure (late-cycle blow-off risk).
As of March 23, 2026, GLD (SPDR Gold Shares) is in a uptrend state on the monthly chart with 72% confidence. Strong multi-month rally to a new swing high near $500 followed by a sharp pullback to ~$404; still holding well above rising EMA50/EMA100 with RSI ~68 cooling from overbought.
On the monthly timeframe, GLD has key support at $400 and key resistance at $450. The most likely scenario (bullish) targets $450 and $500, with a revert level at $420.
GLD (SPDR Gold Shares) is currently classified as uptrend on the monthly chart, with 72% confidence. Confirmation requires: Monthly close back above $450 (and holding $403 as a higher low) confirms uptrend continuation This would be invalidated by: Monthly close below $336 (EMA20 area) would likely signal a deeper corrective phase
The most likely scenario (bullish) targets $450 and $500, with a revert level at $420. The alternative scenario (bearish) targets $360 and $336.
All content on this website — including charts, analysis, price targets, support/resistance levels, and position zones — is generated entirely by AI and provided for educational and informational purposes only.
This is not financial advice. NEXUSNOIR VENTURES SL (the operator of this website) is not a registered investment adviser or broker-dealer. You should not make investment decisions based solely on this information. Always do your own research and consult a qualified financial advisor.
By continuing, you acknowledge that you have read and agree to our full disclaimer & terms of use and privacy policy.