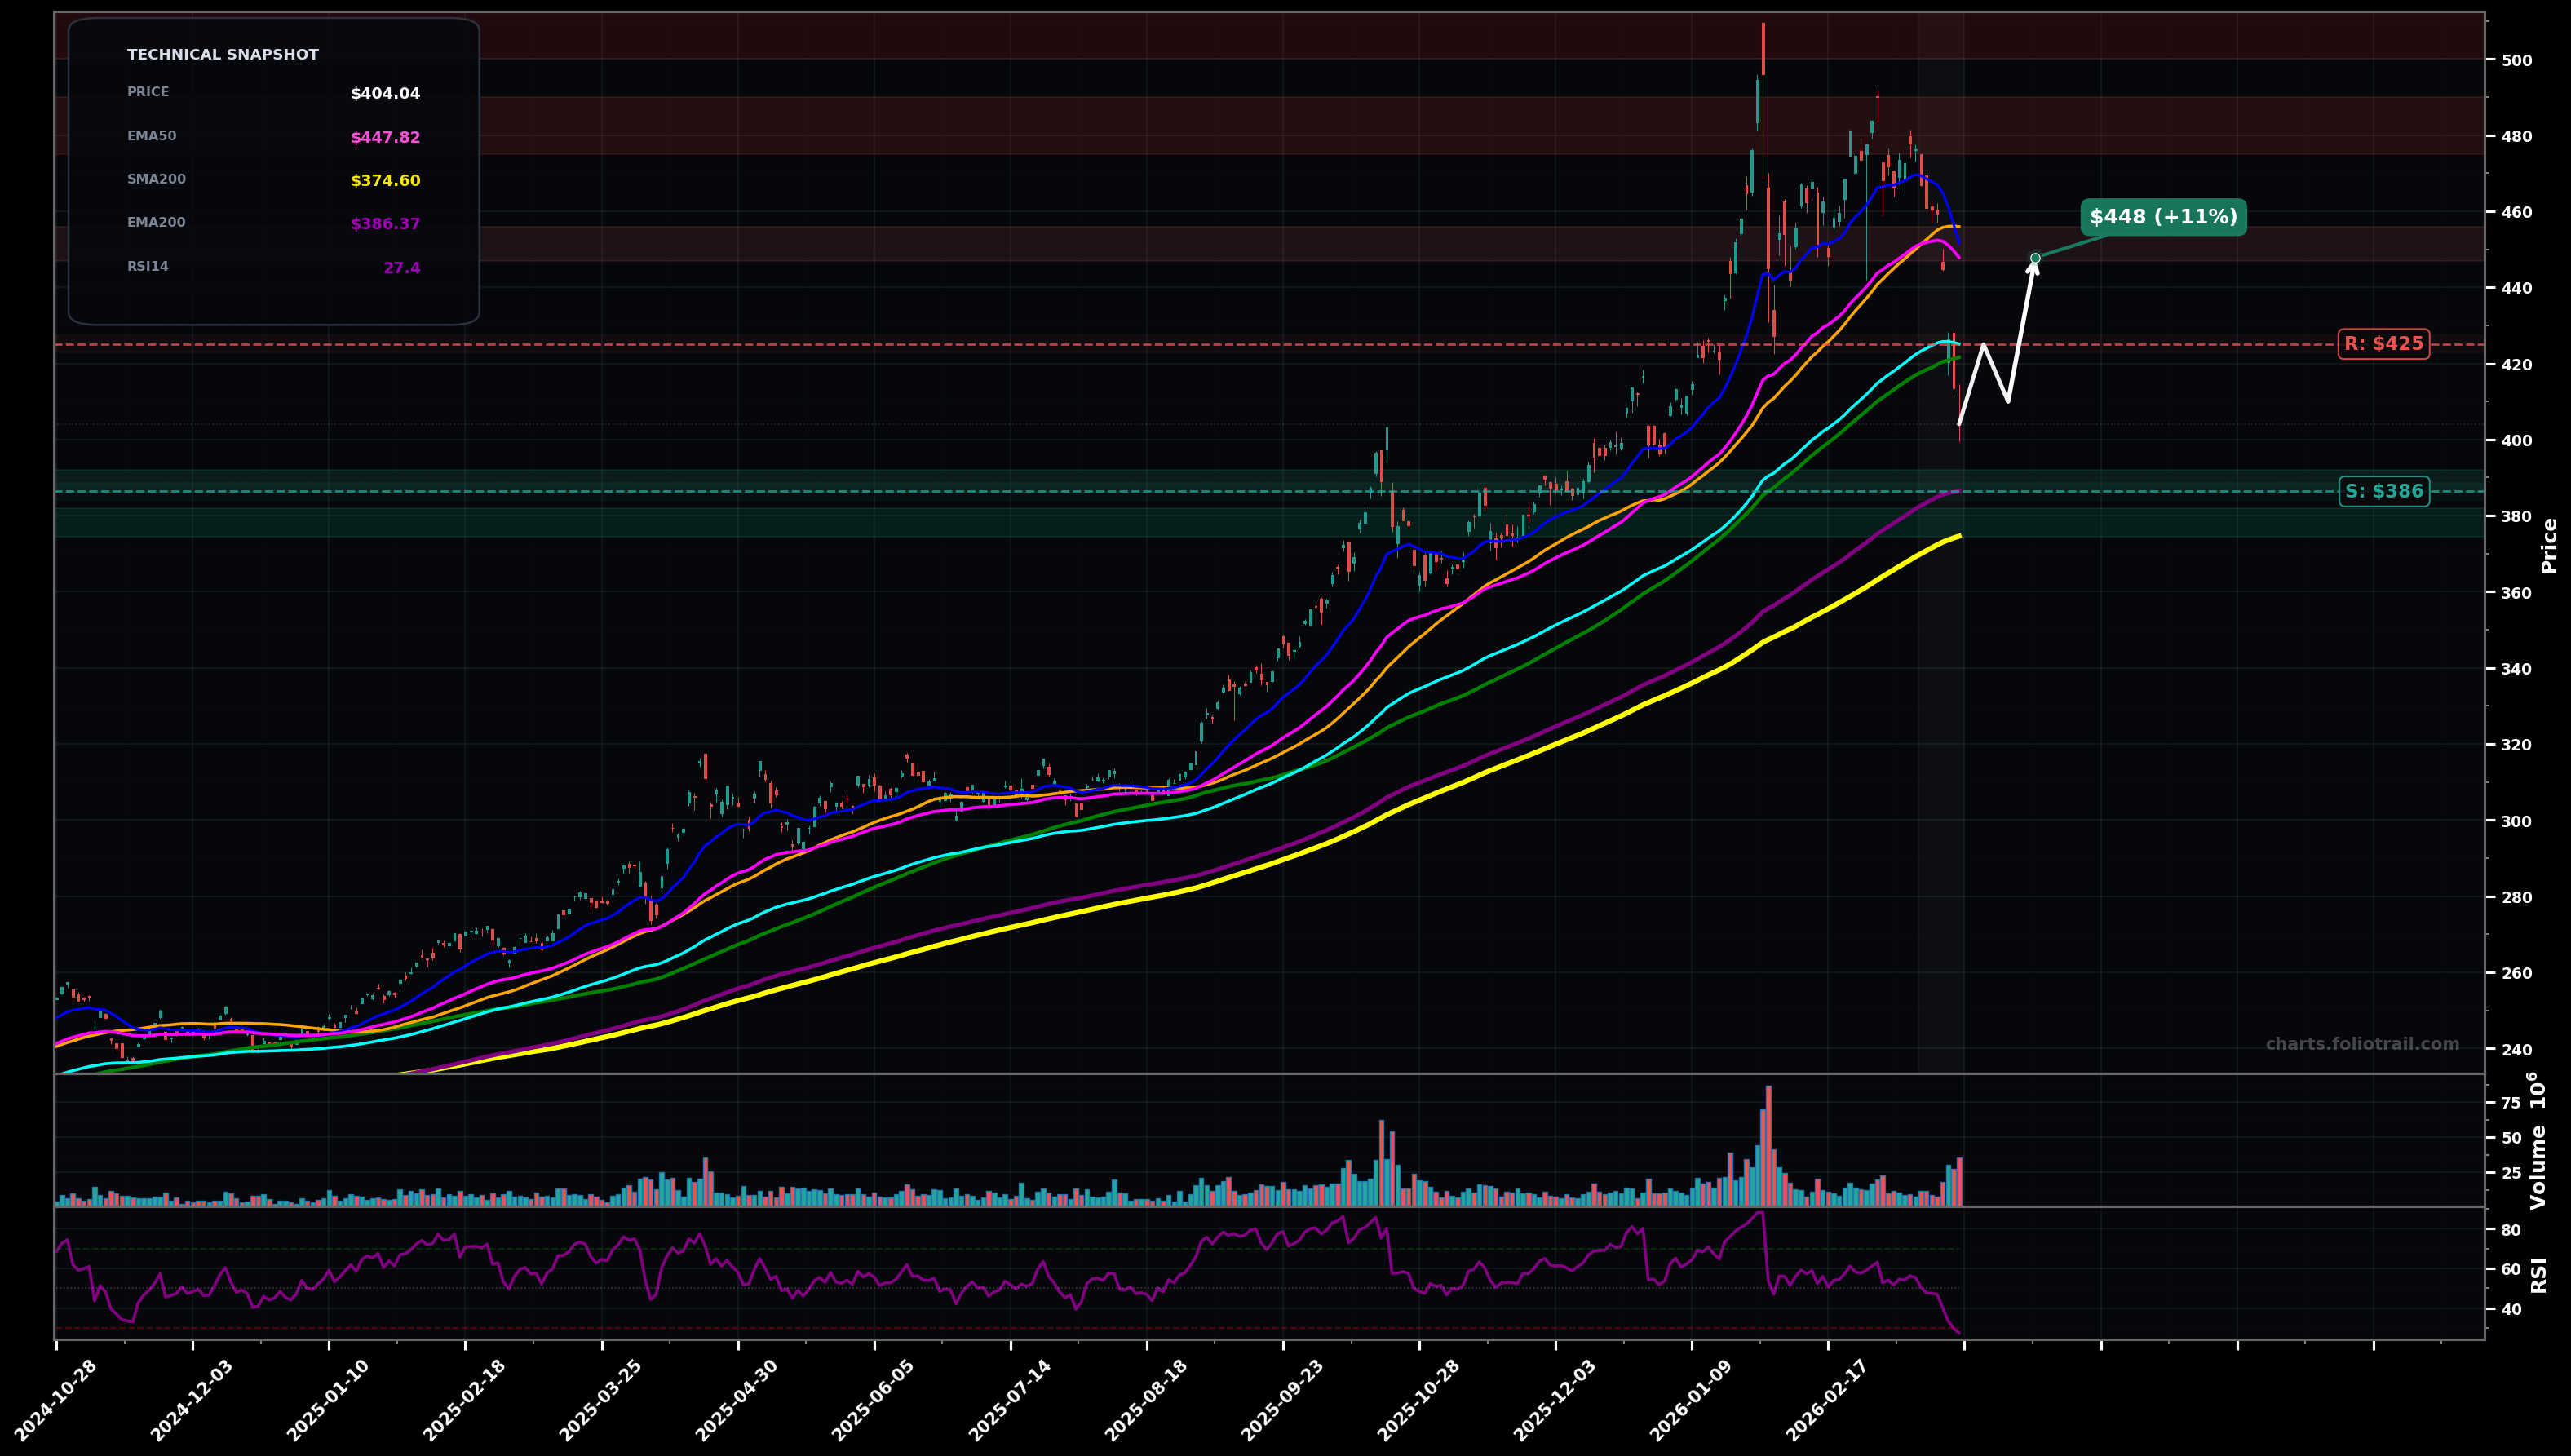
As of May 22, 2026, GLD (SPDR Gold Shares) is in a downtrend state on the daily chart, with a confidence level of 67%. Key support is at $400 and key resistance at $430. Price ~$413.84 is consolidating below the falling EMA50 (~$429.78) and EMA100 (~$425.94) after a sharp pullback from the ~$480–$500 blow-off; RSI-14 ~40 suggests weak momentum but not extreme capitulation.
Base-building above the $400 long-term MA cluster, then a mean-reversion bounce into the $425–$440 supply zone (MA reclaim attempt), with sellers likely defending the first test.
Support gives way: a clean breakdown through $400 triggers continuation lower (prior consolidation shelf / fib retrace zone), before any durable low forms.
Daily close below $410 with follow-through toward $400 (EMA200/SMA200 area).
Two consecutive daily closes back above $430 (reclaim EMA50 + prior breakdown zone).
Buy-the-dip tiers around the $400 EMA200/SMA200 confluence; add on a controlled breakdown to next demand shelves (likely fib retrace zones from the ~$300→~$500 impulse).
Trim into prior distribution/swing-supply near ~$450–$470 and the prior peak zone ~$485–$505; fully exit if price becomes extended beyond the prior blow-off highs (probable late-wave/Elliott Wave 5 extension risk).
As of May 22, 2026, GLD (SPDR Gold Shares) is in a downtrend state on the daily chart with 67% confidence. Price ~$413.84 is consolidating below the falling EMA50 (~$429.78) and EMA100 (~$425.94) after a sharp pullback from the ~$480–$500 blow-off; RSI-14 ~40 suggests weak momentum but not extreme capitulation.
On the daily timeframe, GLD has key support at $400 and key resistance at $430. The most likely scenario (bullish) targets $425 and $440, with a revert level at $412.
GLD (SPDR Gold Shares) is currently classified as downtrend on the daily chart, with 67% confidence. Confirmation requires: Daily close below $410 with follow-through toward $400 (EMA200/SMA200 area). This would be invalidated by: Two consecutive daily closes back above $430 (reclaim EMA50 + prior breakdown zone).
The most likely scenario (bullish) targets $425 and $440, with a revert level at $412. The alternative scenario (bearish) targets $390 and $375.
Multi-layer AI agents analyse 200+ stocks across daily, weekly, and monthly timeframes — producing market state classifications, price scenarios with targets, and position entry/exit levels. Daily charts updated every trading day at 6 PM ET. Weekly charts refresh Fridays. Monthly charts refresh on the last trading day of each month. No paywall. No sign-up required.
Built by Foliotrail.
All content on this website — including charts, analysis, price targets, support/resistance levels, and position zones — is generated entirely by AI and provided for educational and informational purposes only.
This is not financial advice. NEXUSNOIR VENTURES SL (the operator of this website) is not a registered investment adviser or broker-dealer. You should not make investment decisions based solely on this information. Always do your own research and consult a qualified financial advisor.
By continuing, you acknowledge that you have read and agree to our full disclaimer & terms of use and privacy policy.