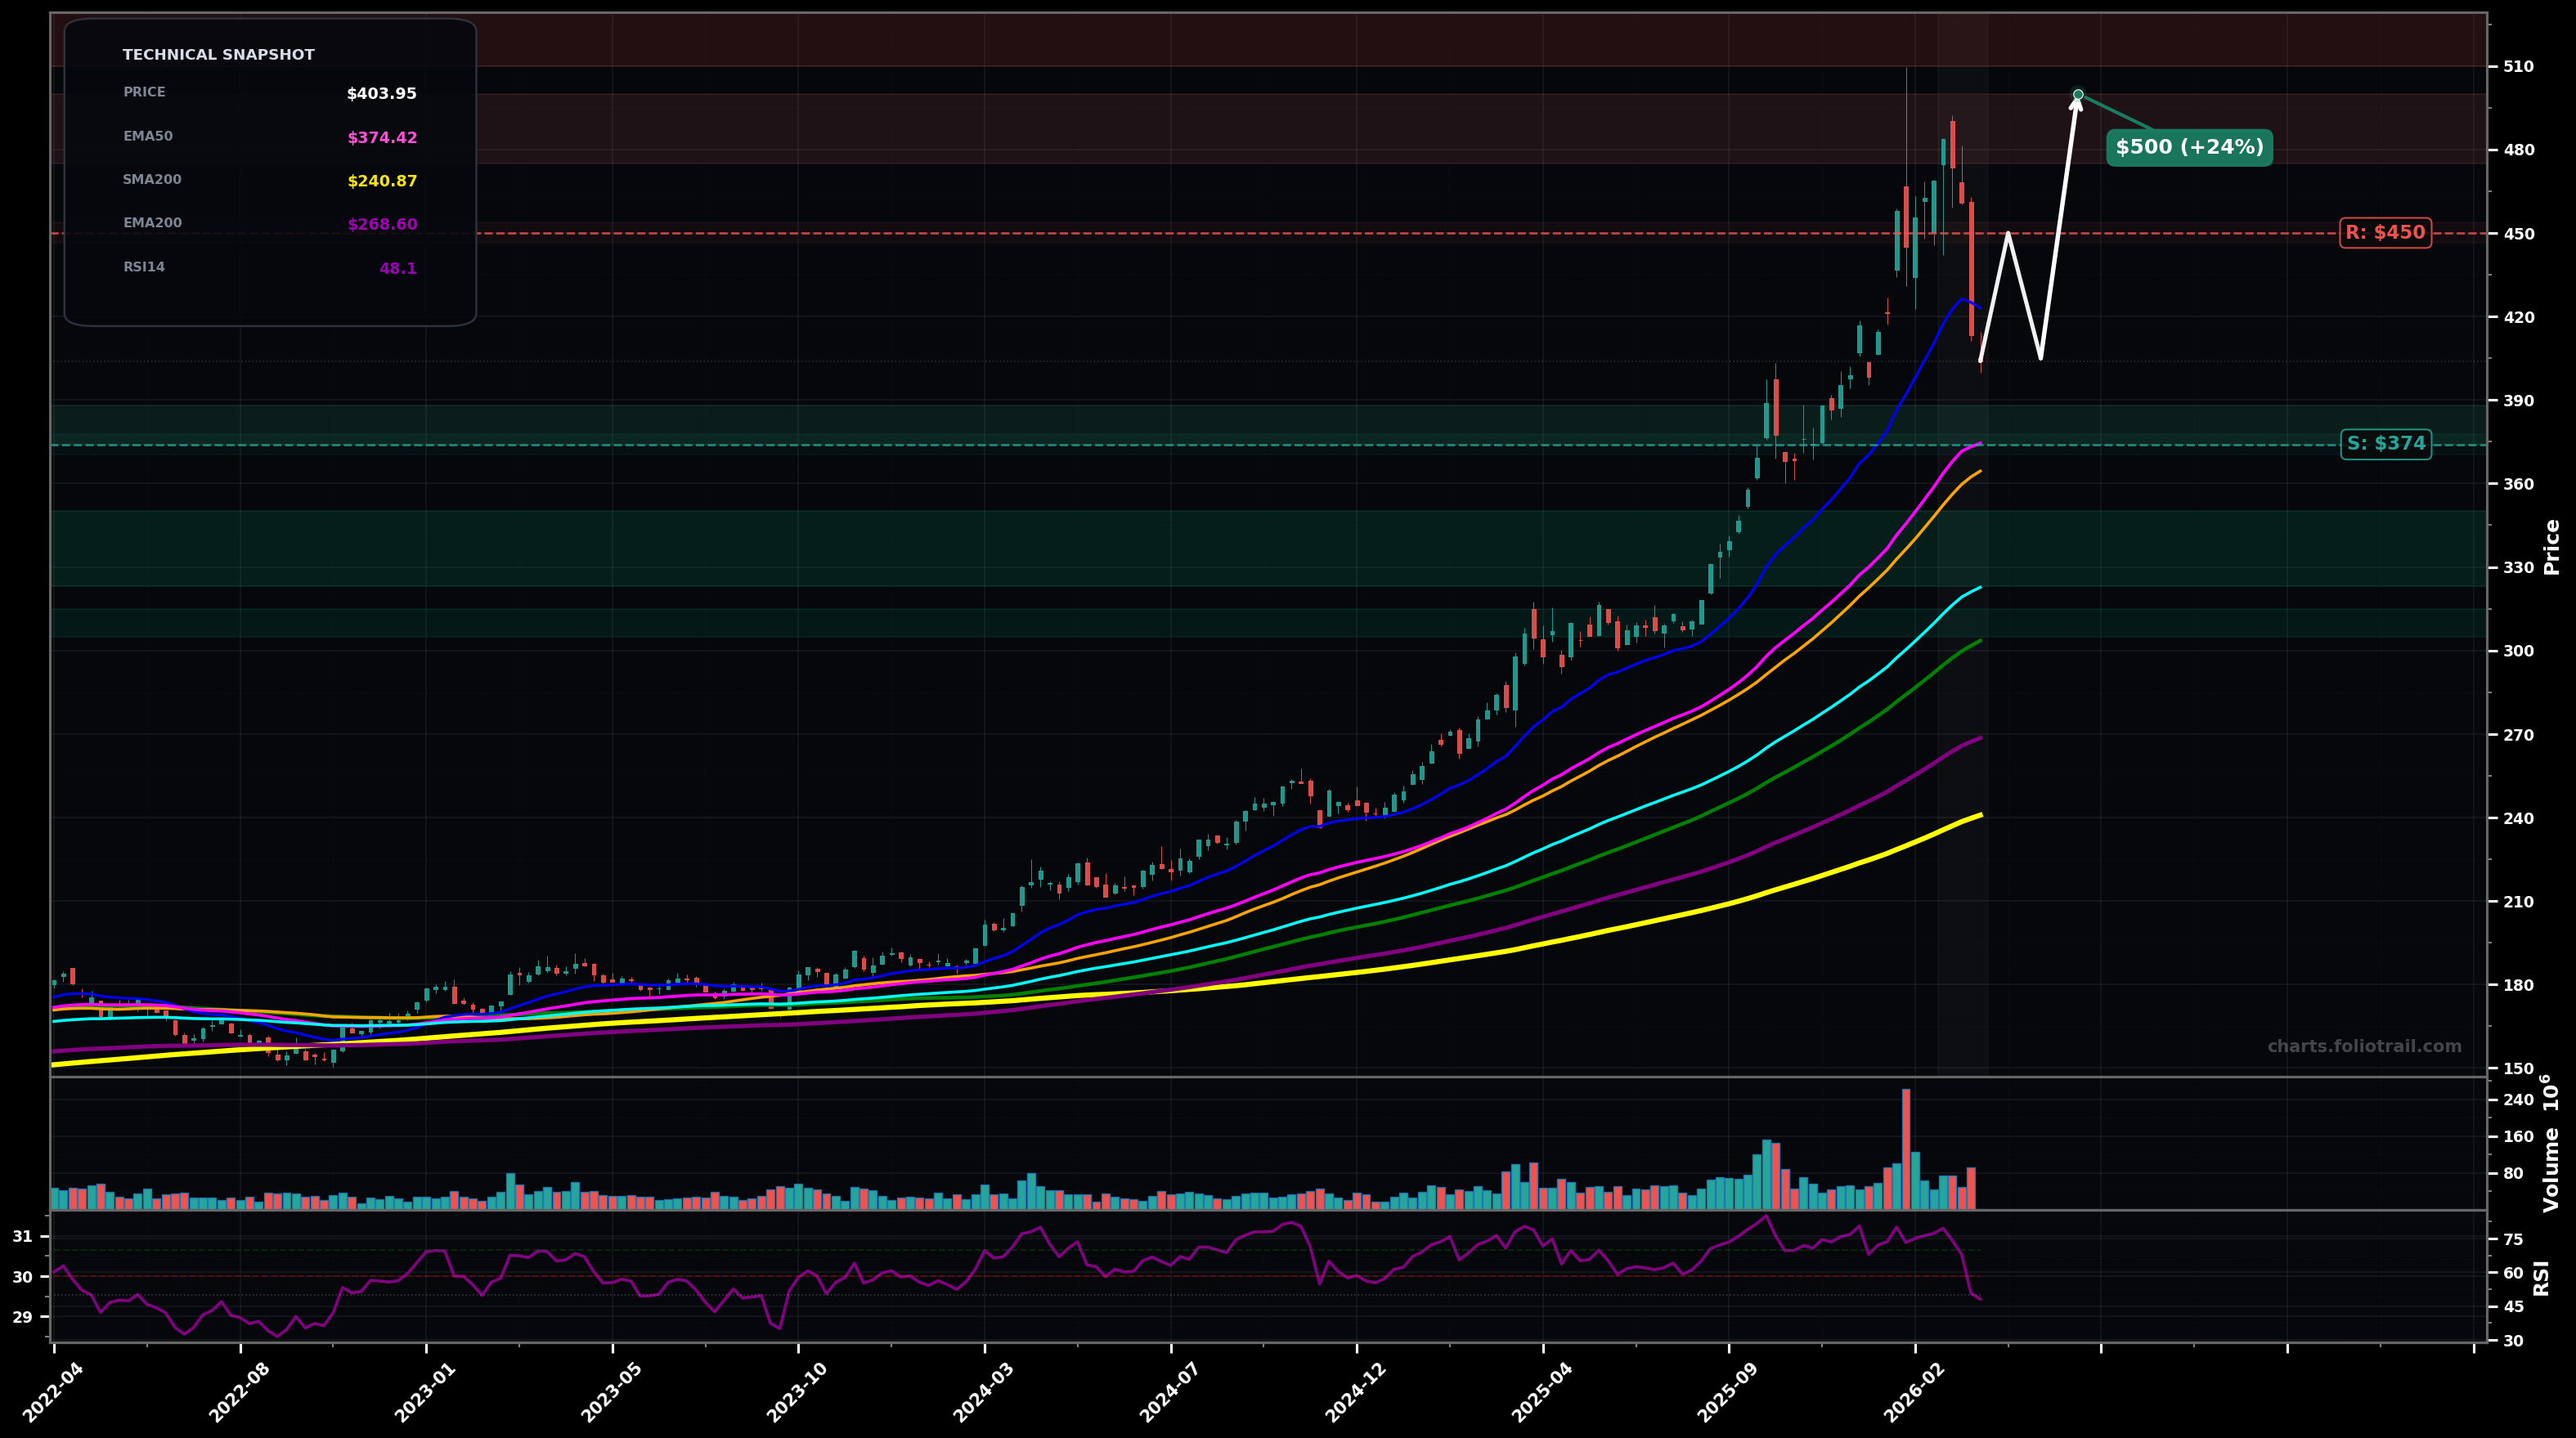
As of May 22, 2026, GLD (SPDR Gold Shares) is in a uptrend state on the weekly chart, with a confidence level of 66%. Key support is at $390 and key resistance at $426. GLD is pulling back from the $480-$490 blow-off peak and drifting lower; price ($413.84) is below the short-term EMA20 ($425.99) but still above rising EMA50 ($389.56) and well above EMA100 ($338.59). RSI14 ~48 shows momentum reset rather than a full trend break.
Most likely: corrective pullback holds above EMA50 ($389) and forms a higher low; then GLD reclaims EMA20 (~$426) and grinds back toward the prior supply zone.
Second likely: deeper ABC correction (Elliott) where wave C sweeps into the rising EMA50/SMA50 confluence and possibly the prior breakout shelf before stabilizing; if $389 fails, GLD can mean-revert toward the next MA cluster.
Weekly close back above $426 (EMA20 area) with follow-through toward $440+
Weekly close below $389 (EMA50) and failure to reclaim it on the next 1-2 weeks
Buy-the-dip plan uses rising EMA50 (~$390) as first HL candidate; add on a deeper flush into former breakout/50wk area; heavy add only if mean-reversion reaches EMA100 (~$339) support cluster.
Trim into prior peak/supply ($470-$490); stronger trimming if price extends into a new euphoric leg above $500; full exit only on multi-year stretch targets well above prior ATH (Fibo extension-style overshoot zone).
As of May 22, 2026, GLD (SPDR Gold Shares) is in a uptrend state on the weekly chart with 66% confidence. GLD is pulling back from the $480-$490 blow-off peak and drifting lower; price ($413.84) is below the short-term EMA20 ($425.99) but still above rising EMA50 ($389.56) and well above EMA100 ($338.59). RSI14 ~48 shows momentum reset rather than a full trend break.
On the weekly timeframe, GLD has key support at $390 and key resistance at $426. The most likely scenario (bullish) targets $440 and $470, with a revert level at $426.
GLD (SPDR Gold Shares) is currently classified as uptrend on the weekly chart, with 66% confidence. Confirmation requires: Weekly close back above $426 (EMA20 area) with follow-through toward $440+ This would be invalidated by: Weekly close below $389 (EMA50) and failure to reclaim it on the next 1-2 weeks
The most likely scenario (bullish) targets $440 and $470, with a revert level at $426. The alternative scenario (bearish) targets $384 and $339.
Multi-layer AI agents analyse 200+ stocks across daily, weekly, and monthly timeframes — producing market state classifications, price scenarios with targets, and position entry/exit levels. Daily charts updated every trading day at 6 PM ET. Weekly charts refresh Fridays. Monthly charts refresh on the last trading day of each month. No paywall. No sign-up required.
Built by Foliotrail.
All content on this website — including charts, analysis, price targets, support/resistance levels, and position zones — is generated entirely by AI and provided for educational and informational purposes only.
This is not financial advice. NEXUSNOIR VENTURES SL (the operator of this website) is not a registered investment adviser or broker-dealer. You should not make investment decisions based solely on this information. Always do your own research and consult a qualified financial advisor.
By continuing, you acknowledge that you have read and agree to our full disclaimer & terms of use and privacy policy.