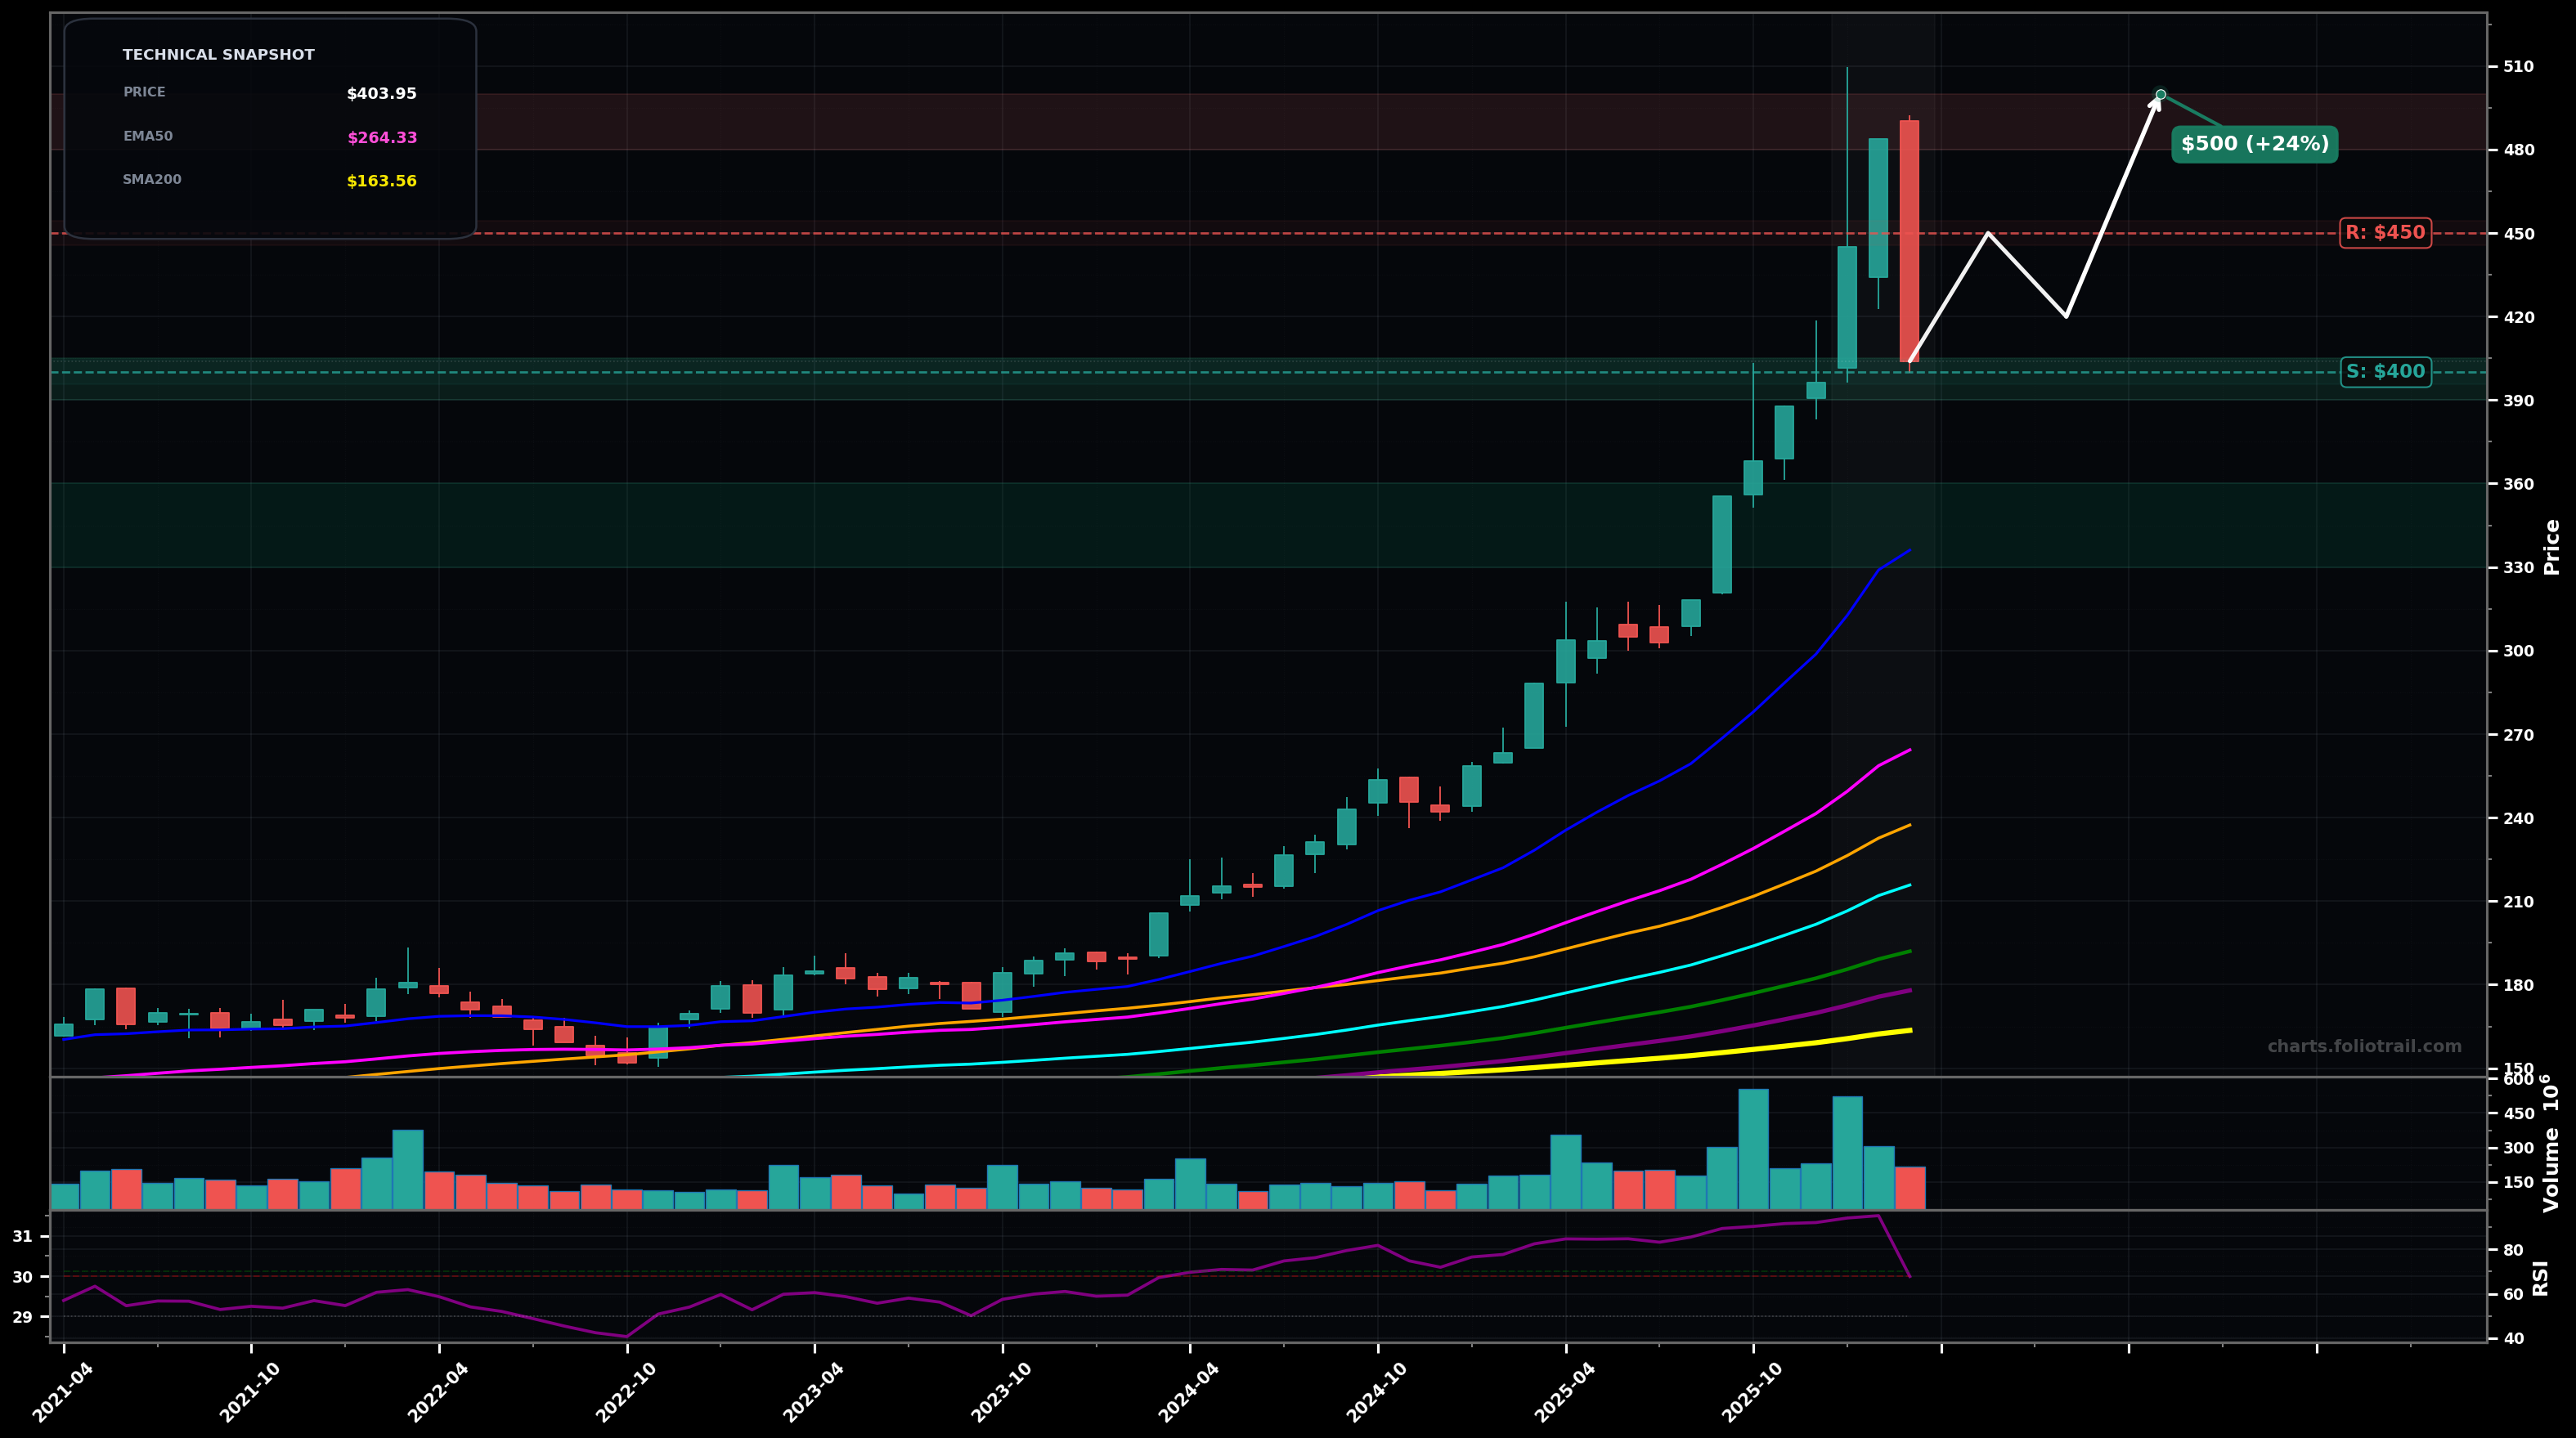
As of May 22, 2026, GLD (SPDR Gold Shares) is in a volatility expansion state on the monthly chart, with a confidence level of 72%. Key support is at $400 and key resistance at $450. Strong multi-month breakout into a blow-off high near ~$500 followed by a sharp pullback and 3 red monthly candles; price still well above rising EMA50/EMA100 with RSI cooling from near-overbought (~70).
Bullish consolidation: price holds the $400-$390 area (prior breakout zone/round-number support), forms a HL on the monthly, then resumes uptrend with a retest of the $450 area and later a run back toward the prior peak region.
Bearish deeper retrace: failure to hold $400 leads to a larger ABC correction toward the fast-trend supports (EMA20/near prior structure), with buyers likely reappearing around the mid-$300s before any sustainable push higher.
2 monthly closes above $450 would confirm volatility resolving bullish (continuation).
Monthly close below $380 would invalidate the bullish resolution and shift risk to a deeper correction.
Use the swing-low/high reference: buy near the $400 breakdown/defense zone first, add into a Fibonacci-style 38.2%-50% retrace area, heavy add near the 50%-61.8% retrace + EMA20/structure confluence (monthly).
Trim into overhead supply at $450-$475, more trimming into prior blow-off top zone $475-$505, and fully close if price enters an extended 1.272-1.618 extension-style overshoot above the prior peak area (parabolic risk).
As of May 22, 2026, GLD (SPDR Gold Shares) is in a volatility expansion state on the monthly chart with 72% confidence. Strong multi-month breakout into a blow-off high near ~$500 followed by a sharp pullback and 3 red monthly candles; price still well above rising EMA50/EMA100 with RSI cooling from near-overbought (~70).
On the monthly timeframe, GLD has key support at $400 and key resistance at $450. The most likely scenario (bullish) targets $450 and $495, with a revert level at $410.
GLD (SPDR Gold Shares) is currently classified as volatility expansion on the monthly chart, with 72% confidence. Confirmation requires: 2 monthly closes above $450 would confirm volatility resolving bullish (continuation). This would be invalidated by: Monthly close below $380 would invalidate the bullish resolution and shift risk to a deeper correction.
The most likely scenario (bullish) targets $450 and $495, with a revert level at $410. The alternative scenario (bearish) targets $380 and $350.
Multi-layer AI agents analyse 200+ stocks across daily, weekly, and monthly timeframes — producing market state classifications, price scenarios with targets, and position entry/exit levels. Daily charts updated every trading day at 6 PM ET. Weekly charts refresh Fridays. Monthly charts refresh on the last trading day of each month. No paywall. No sign-up required.
Built by Foliotrail.
All content on this website — including charts, analysis, price targets, support/resistance levels, and position zones — is generated entirely by AI and provided for educational and informational purposes only.
This is not financial advice. NEXUSNOIR VENTURES SL (the operator of this website) is not a registered investment adviser or broker-dealer. You should not make investment decisions based solely on this information. Always do your own research and consult a qualified financial advisor.
By continuing, you acknowledge that you have read and agree to our full disclaimer & terms of use and privacy policy.