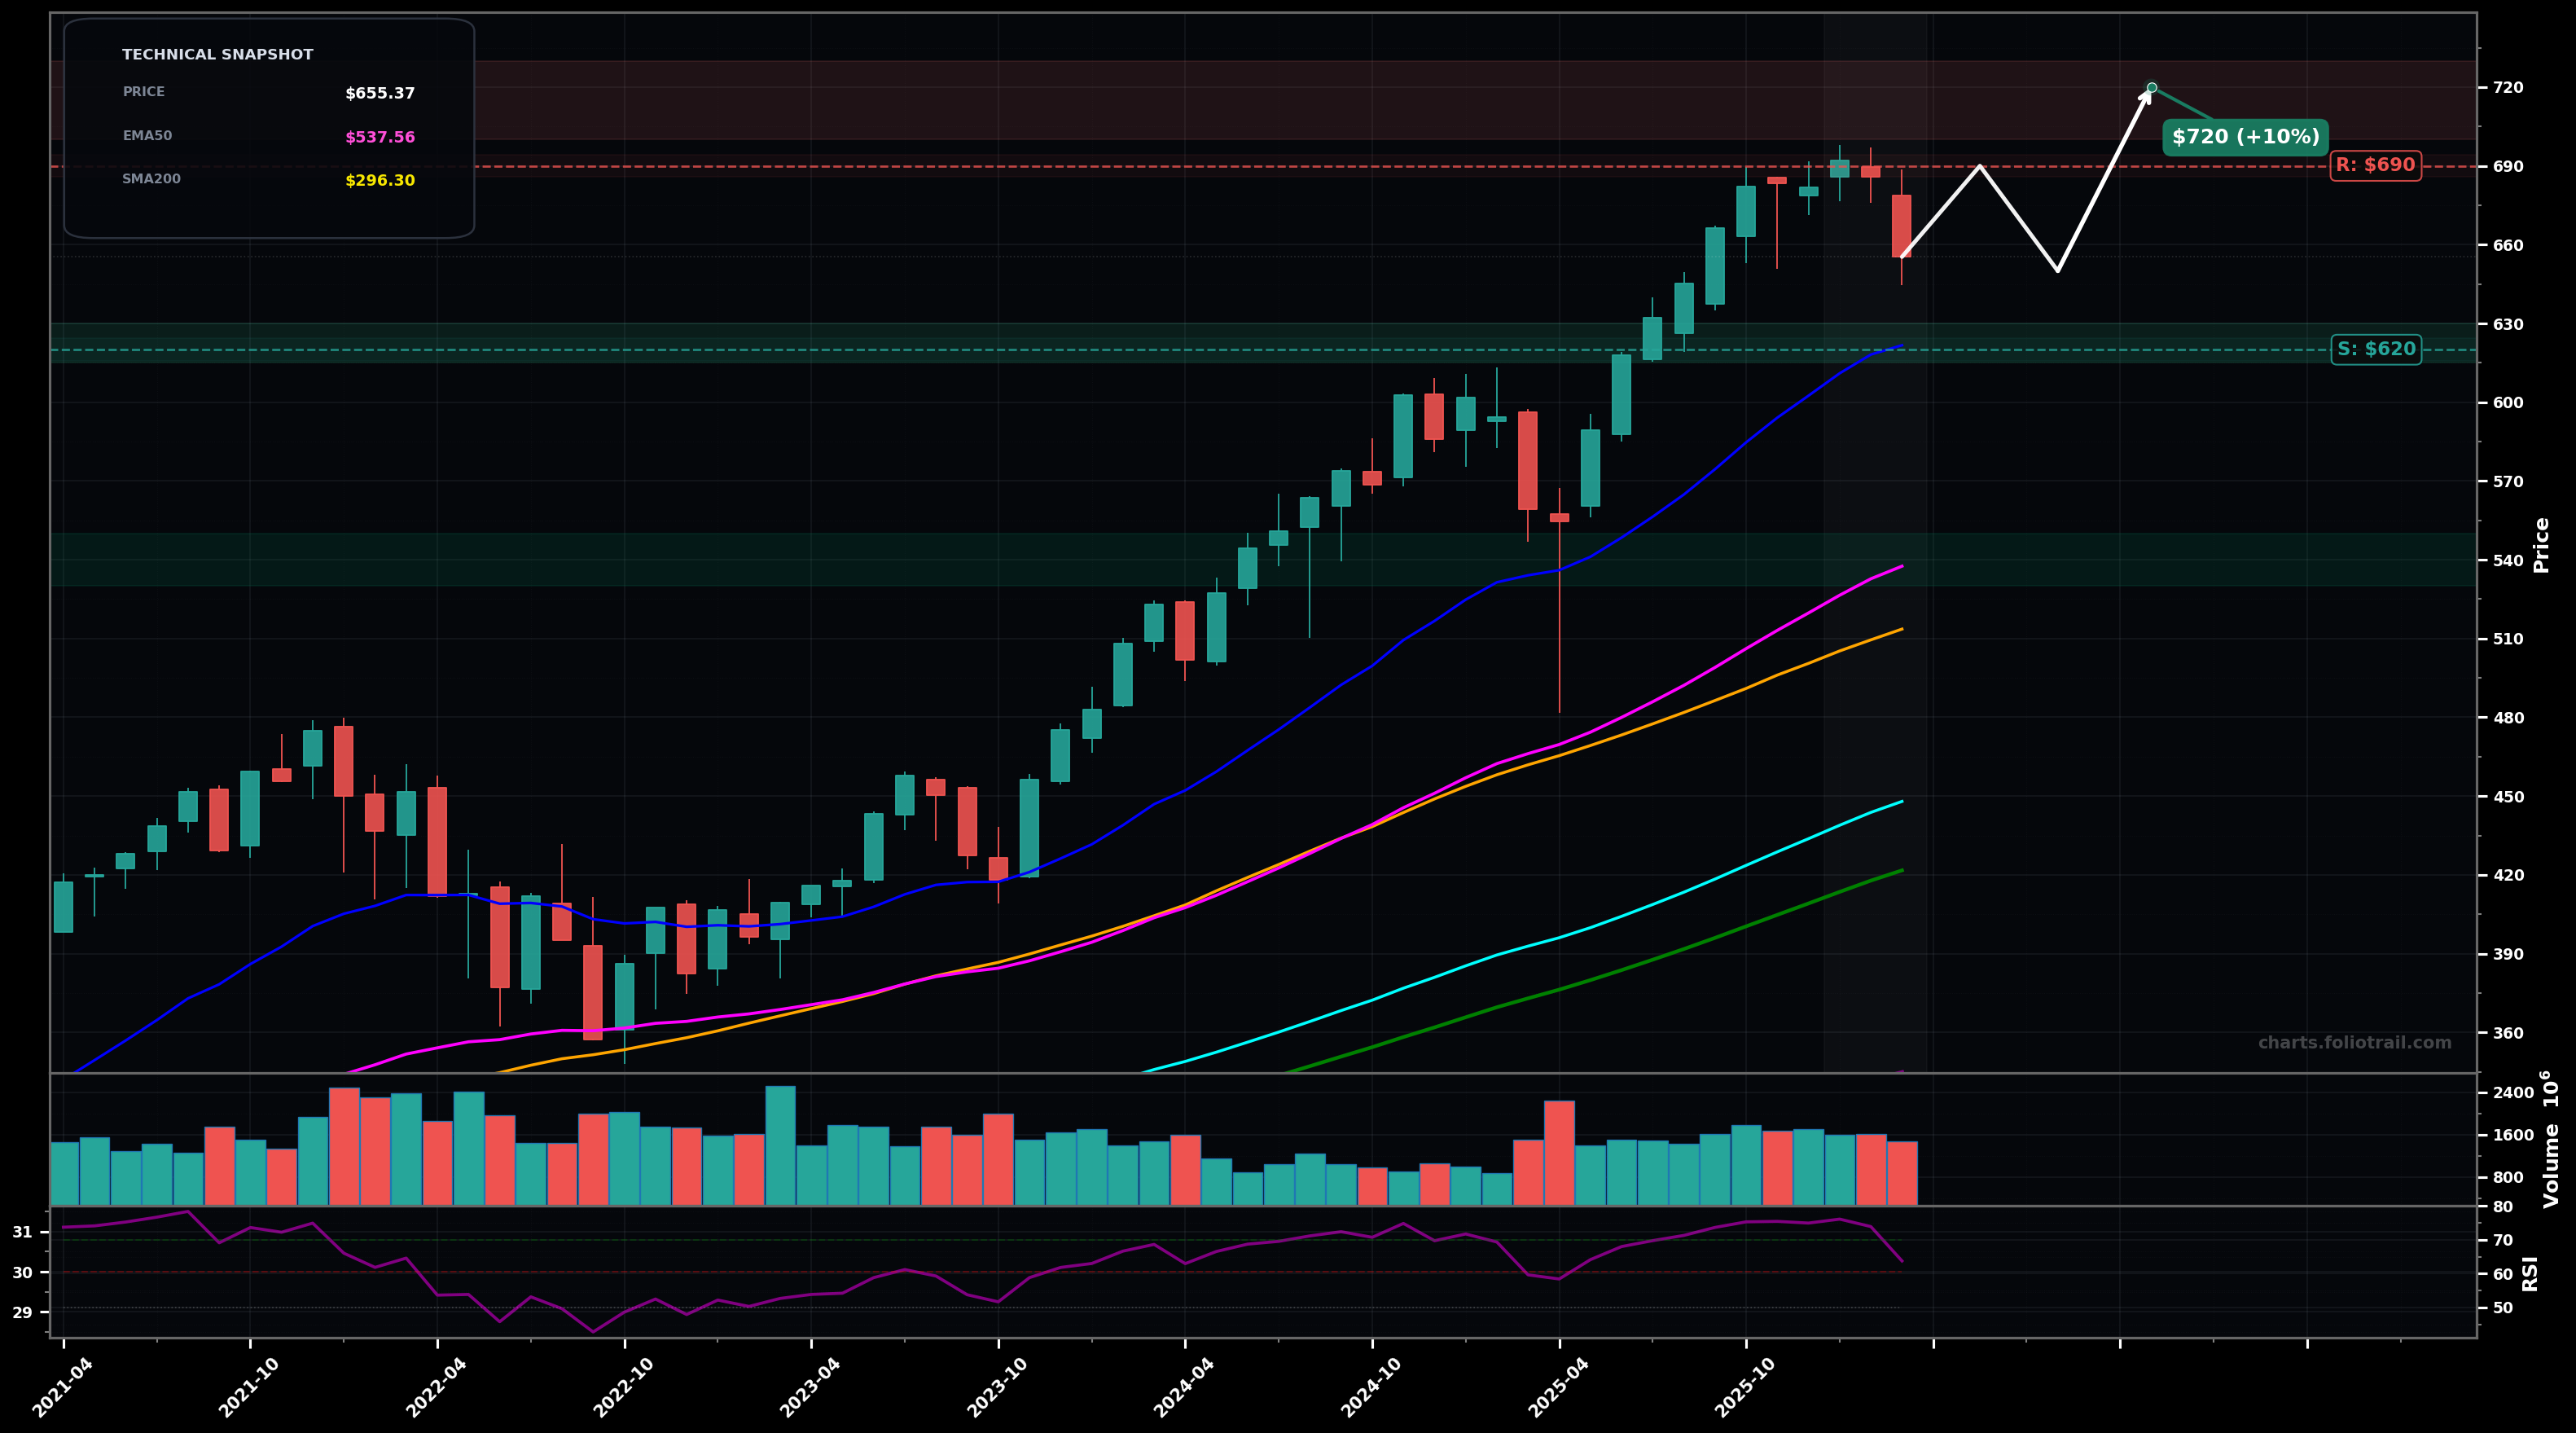
As of March 23, 2026, SPY (SPDR S&P 500 ETF Trust) is in a uptrend state on the monthly chart, with a confidence level of 74%. Key support is at $620 and key resistance at $690. Strong multi-month advance to new highs, followed by a sharp red pullback from the ~$690 area; price still holding above rising EMA20/EMA50 with RSI(14) ~64 cooling from elevated levels.
Bullish continuation: pullback holds above the $620–$630 swing support area (near EMA20 ~$621.70), then a push back to retest the highs and attempt breakout; Elliott wave read: likely a wave 4 pullback within a larger impulse, with wave 5 attempting new highs. Fib guide (rough): if ~$690 is the swing high and ~$490 the prior major swing low, a typical 23.6% retrace sits near ~$643 and 38.2% near ~$614—supporting the $620 area as key.
Deeper correction: failure to reclaim $680 and a breakdown below $620 triggers a larger monthly pullback toward the rising EMA50 and the prior breakout shelf; Elliott wave alternate: the move from ~$490 to ~$690 completed a 5-wave sequence, and this is an A-B-C correction targeting the 38.2%–50% retrace zone.
Monthly close back above $680
Monthly close below $620
Start near the 38.2% retrace/EMA20 swing-support area, add on a cleaner breakdown-and-reclaim attempt around $600, and heavy add only near rising EMA50 (~$538) / prior breakout structure where long-term trend support is strongest.
Trim into new-high extensions (wave-5 risk and stretch vs EMA50), increase trimming if price becomes materially extended above long MAs, and consider full close only in an extreme multi-year overextension zone.
As of March 23, 2026, SPY (SPDR S&P 500 ETF Trust) is in a uptrend state on the monthly chart with 74% confidence. Strong multi-month advance to new highs, followed by a sharp red pullback from the ~$690 area; price still holding above rising EMA20/EMA50 with RSI(14) ~64 cooling from elevated levels.
On the monthly timeframe, SPY has key support at $620 and key resistance at $690. The most likely scenario (bullish) targets $690 and $720, with a revert level at $650.
SPY (SPDR S&P 500 ETF Trust) is currently classified as uptrend on the monthly chart, with 74% confidence. Confirmation requires: Monthly close back above $680 This would be invalidated by: Monthly close below $620
The most likely scenario (bullish) targets $690 and $720, with a revert level at $650. The alternative scenario (bearish) targets $600 and $540.
All content on this website — including charts, analysis, price targets, support/resistance levels, and position zones — is generated entirely by AI and provided for educational and informational purposes only.
This is not financial advice. NEXUSNOIR VENTURES SL (the operator of this website) is not a registered investment adviser or broker-dealer. You should not make investment decisions based solely on this information. Always do your own research and consult a qualified financial advisor.
By continuing, you acknowledge that you have read and agree to our full disclaimer & terms of use and privacy policy.