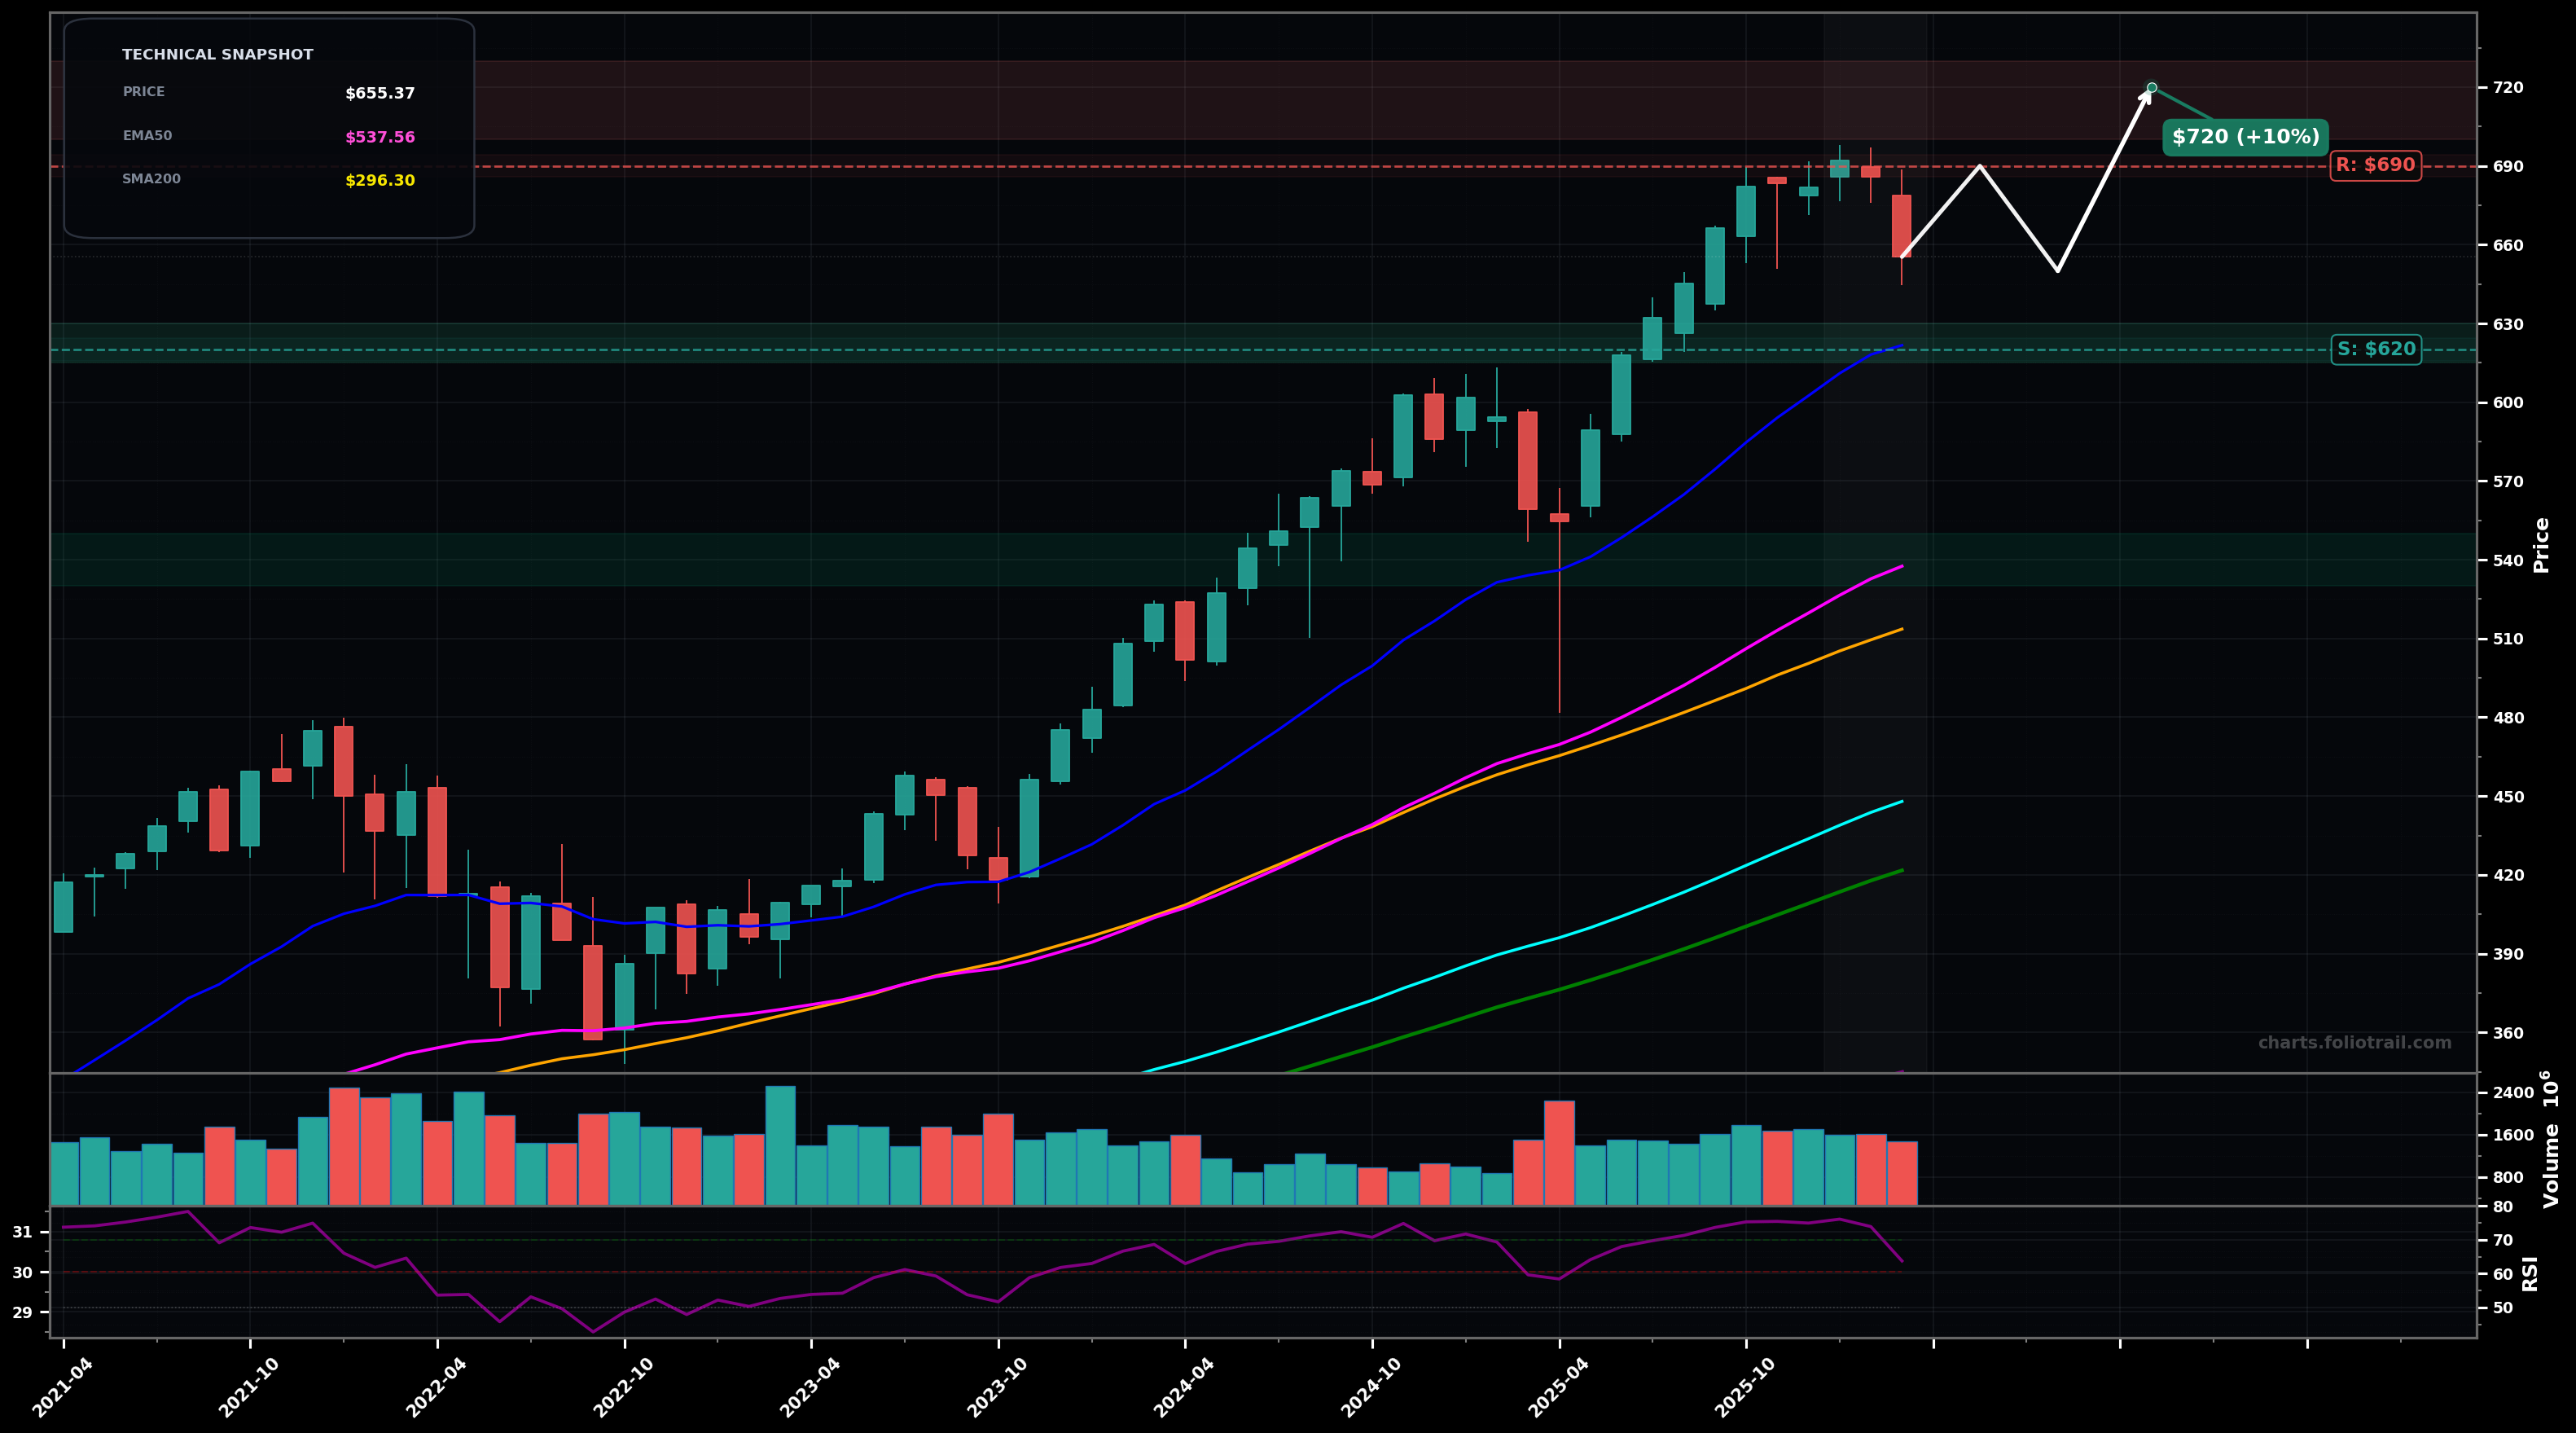
As of April 30, 2026, SPY (SPDR S&P 500 ETF) is in a uptrend state on the monthly chart, with a confidence level of 78%. Key support is at $630 and key resistance at $720. Monthly uptrend resumes with a strong bullish engulfing-type recovery back toward the prior highs after a sharp pullback; price holds well above rising EMA50/EMA100 and far above SMA50.
Bullish continuation: the recent dip is a Wave 4-style pullback (or late-cycle consolidation) and price pushes to a marginal/new high; momentum remains strong but not yet a blow-off.
Bearish correction: this is a late Wave 5 / stretched advance and the market rolls into a larger monthly ABC correction, first breaking back below the recent rebound area and then mean-reverting toward the EMA50/SMA50 zone.
Monthly close above $720 would confirm continuation to new highs
Monthly close below $630 would invalidate the near-term uptrend momentum and raise risk of a deeper correction
Start near EMA20/$630 support; add on deeper pullback toward EMA50/SMA50 confluence; heavy add only if a larger ABC plays out toward EMA100 ($453) / prior base region.
RSI is elevated (~71.5) and price is extended vs EMA50/EMA100; trim into new highs, trim more if acceleration continues, and consider full exit only if a true parabolic overshoot develops well beyond trend MAs.
As of April 30, 2026, SPY (SPDR S&P 500 ETF) is in a uptrend state on the monthly chart with 78% confidence. Monthly uptrend resumes with a strong bullish engulfing-type recovery back toward the prior highs after a sharp pullback; price holds well above rising EMA50/EMA100 and far above SMA50.
On the monthly timeframe, SPY has key support at $630 and key resistance at $720. The most likely scenario (bullish) targets $720 and $760, with a revert level at $680.
SPY (SPDR S&P 500 ETF) is currently classified as uptrend on the monthly chart, with 78% confidence. Confirmation requires: Monthly close above $720 would confirm continuation to new highs This would be invalidated by: Monthly close below $630 would invalidate the near-term uptrend momentum and raise risk of a deeper correction
The most likely scenario (bullish) targets $720 and $760, with a revert level at $680. The alternative scenario (bearish) targets $630 and $545.
Multi-layer AI agents analyse 200+ stocks across daily, weekly, and monthly timeframes — producing market state classifications, price scenarios with targets, and position entry/exit levels. Daily charts updated every trading day at 6 PM ET. Weekly charts refresh Fridays. Monthly charts refresh on the last trading day of each month. No paywall. No sign-up required.
Built by Foliotrail.
All content on this website — including charts, analysis, price targets, support/resistance levels, and position zones — is generated entirely by AI and provided for educational and informational purposes only.
This is not financial advice. NEXUSNOIR VENTURES SL (the operator of this website) is not a registered investment adviser or broker-dealer. You should not make investment decisions based solely on this information. Always do your own research and consult a qualified financial advisor.
By continuing, you acknowledge that you have read and agree to our full disclaimer & terms of use and privacy policy.